HAL Id: inserm-02236550
https://www.hal.inserm.fr/inserm-02236550
Submitted on 1 Aug 2019
HAL is a multi-disciplinary open access archive for the deposit and dissemination of sci-entific research documents, whether they are pub-lished or not. The documents may come from teaching and research institutions in France or abroad, or from public or private research centers.
L’archive ouverte pluridisciplinaire HAL, est destinée au dépôt et à la diffusion de documents scientifiques de niveau recherche, publiés ou non, émanant des établissements d’enseignement et de recherche français ou étrangers, des laboratoires publics ou privés.
textural analysis in pre-therapeutic FDG PET/CT in
head and neck cancer
Catherine Guezennec, David Bourhis, Fanny Orlhac, Philippe Robin,
Jean-Baptiste Corre, Olivier Delcroix, Yves Gobel, Ulrike Schick, Pierre-Yves
Salaün, Ronan Abgral
To cite this version:
Catherine Guezennec, David Bourhis, Fanny Orlhac, Philippe Robin, Jean-Baptiste Corre, et al.. Inter-observer and segmentation method variability of textural analysis in pre-therapeutic FDG PET/CT in head and neck cancer. PLoS ONE, Public Library of Science, 2019, 14 (3), pp.e0214299. �10.1371/journal.pone.0214299�. �inserm-02236550�
Inter-observer and segmentation method
variability of textural analysis in
pre-therapeutic FDG PET/CT in head and neck
cancer
Catherine GuezennecID1, David Bourhis1, Fanny Orlhac2, Philippe Robin1,
Jean-Baptiste Corre1, Olivier Delcroix1, Yves Gobel3, Ulrike Schick4, Pierre-Yves Salau¨ n1,
Ronan Abgral1*
1 Department of Nuclear Medicine, Brest University Hospital, Brest, France, 2 Imagerie Mole´culaire in Vivo,
CEA-SHJF, Inserm, CNRS, Universite´ Paris-Sud, Universite´ Paris-Saclay, Orsay, France, 3 Department of Head and Neck Surgery, Brest University Hospital, Brest, France, 4 Department of Radiotherapy, Brest University Hospital, Brest, France
*ronan.abgral@chu-brest.fr
Abstract
Aim
Characterizing tumor heterogeneity with textural indices extracted from 18F-fluorodeoxyglu-cose positron emission tomography (FDG PET/CT) is of growing interest in oncology. Sev-eral series showed promising results to predict survival in patients with head and neck squamous cell carcinoma (HNSCC), analyzing various tumor segmentation methods and textural indices. This preliminary study aimed at assessing the inter-observer and inter-seg-mentation method variability of textural indices in HNSCC pre-therapeutic FDG PET/CT.
Materials and methods
Consecutive patients with HNSCC referred in our department for a pre-therapeutic FDG PET/CT from January to March 2016 were retrospectively included. Two nuclear medicine physicians separately segmented all tumors using 3 different segmentation methods: a rela-tive standardized uptake value (SUV) threshold (40%SUVmax), a signal-to-noise adaprela-tive SUV threshold (DAISNE) and an image gradient-based method (PET-EDGE). SUV and metabolic tumor volume were recorded. Thirty-one textural indices were calculated using LIFEx software (www.lifexsoft.org). After correlation analysis, selected indices’ inter-seg-mentation method and inter-observer variability were calculated.
Results
Forty-three patients (mean age 63.8±9.3y) were analyzed. Due to a too small segmented tumor volume of interest, textural analysis could not be performed in 6, 11 and 15 cases with respectively DAISNE, 40%SUVmax and PET-EDGE segmentation methods. Five indepen-dent textural indices were selected (Homogeneity, Correlation, Entropy, Busyness and LZLGE). There was a high inter-contouring method variability for Homogeneity, Correlation,
a1111111111 a1111111111 a1111111111 a1111111111 a1111111111 OPEN ACCESS
Citation: Guezennec C, Bourhis D, Orlhac F, Robin
P, Corre J-B, Delcroix O, et al. (2019) Inter-observer and segmentation method variability of textural analysis in pre-therapeutic FDG PET/CT in head and neck cancer. PLoS ONE 14(3): e0214299.https://doi.org/10.1371/journal. pone.0214299
Editor: Alan D. Hutson, Roswell Park Cancer
Institute, UNITED STATES
Received: September 29, 2018 Accepted: March 11, 2019 Published: March 28, 2019
Copyright:© 2019 Guezennec et al. This is an open access article distributed under the terms of the Creative Commons Attribution License, which permits unrestricted use, distribution, and reproduction in any medium, provided the original author and source are credited.
Data Availability Statement: Data cannot be
shared publicly because of restrictions from our institutional ethics committee. Data are available from the institutional ethics committee of Brest University Hospital. Requests must be sent by email todpo@chu-brest.frstating the article title, its authors and the following reference "ImpactTextORL".
Funding: The authors received no specific funding
Entropy and LZLGE (p<0.0001 for each index). The inter-observer reproducibility analysis revealed an excellent agreement for 3 indices (Homogeneity, Correlation and Entropy) with an intraclass correlation coefficient higher than 0.90 for the 3 methods.
Conclusions
This preliminary study showed a high variability of 4 out of 5 textural indices (Homogeneity, Correlation, Entropy and LZLGE) extracted from pre-therapeutic FDG PET/CT in HNSCC using 3 different contouring methods. However, for each method, there was an excellent agreement between observers for 3 of these textural indices (Homogeneity, Correlation and Entropy).
Introduction
Solid malignancies usually show high levels of biologic heterogeneity, in terms of hypoxic and necrotic regions, variability in cellular proliferation and intra-tumoral angiogenesis. Taking this heterogeneity into account could help improve patients’ therapeutic management, classify-ing patients between different risk subgroups [1][2][3].
This could be particularly useful in head and neck squamous cell carcinoma (HNSCC) which typically presents a high biologic heterogeneity [4][5][6]. HNSCC is the sixth most com-mon malignancy by incidence worldwide and includes cancers of the oral cavity, oropharynx, hypopharynx and larynx [7]. Therapeutic strategies rely on usual prognostic factors, such as the tumour size, nodal involvement and distant metastasis [8][9], the anatomic subsite, or the human papilloma virus (HPV 16, 18) infection status [10]. Despite aggressive treatment strate-gies, it presents a high rate of loco-regional recurrence (up to 40%) [11]. Thus predicting tumor response to therapy remains difficult and could benefit from heterogeneity analysis.
Pre-therapeutic 18F-Fluorodeoxyglucose positron-emission tomography (FDG PET/CT) is recommended in locally advanced HNSCC to assess remote extension and in order to search for synchronous cancer [12]. Several studies already suggested its prognostic significance in selecting patients at risk of recurrence using different standard quantitative parameters, such as static (SUV = Standardized Uptake Value) or volumetric (MTV = metabolic tumor volume; TLG = total lesion glycolysis) parameters [13][14][15]. Some tools have recently been devel-oped to allow radiomics extraction of PET image-derived heterogeneity biomarkers [16]. Therefore, besides standard PET quantitative parameters, textural indices could also have a prognostic value.
There are some challenges to handle with textural analysis. Indeed, various parameters have to be settled when calculating textural indices, such as the segmentation method to delineate a tumor volume of interest, the resampling method, matrix definitions and indices formula. The robustness of these indices towards those parameters should be evaluated [17]. The correlation of textural indices between themselves and with standard PET quantitative parameters should also be considered, since some indices have very similar definitions [18].
Several studies have showed promising results to predict survival in patients with HNSCC, analyzing various cancer anatomic subsites, tumor segmentation methods and textural indices [19][20][21]. However, as in other solid cancers, no consensus has been reached in HNSCC on the best segmentation method to use and on the most adapted textural indices to study.
The objective of this preliminary study was to assess the reproducibility between 2 observers and the variability between 3 contouring methods when calculating different textural indices on HNSCC pre-therapeutic FDG PET/CT.
Competing interests: The authors have declared
Materials and methods
The institutional ethics committee of Brest University hospital (Number 2017.CE25) approved this study and all patient signed a written consent form.
Patients
Consecutive patients referred for FDG PET/CT for the assessment of a Head and Neck cancer to the nuclear medicine department of Brest University Hospital (France) were retrospectively analysed from January 2016 to March 2016. Inclusion criteria were a pre-treatment FDG PET/ CT (at initial staging) and a biopsy proven HNSCC. Patients were excluded if they were less than 18 years old or if they had a history of head and neck malignancy.
Image acquisition
FDG PET/CT images were acquired on two Biograph-mCT systems (Siemens, Erlangen, Ger-many) with the same technical features. Patients were required to fast at least 6 hours before injection so that their serum glucose level would be appropriately low (<7mmol/L for non-diabetic patients and <9mmol/L for non-diabetic patients). Images were performed 60 minutes after injection of approximately 3 MBq/kg of FDG (IBA Molecular Imaging, Saclay, France).
CT scan was obtained first in the craniocaudal direction using a whole-body protocol, 55 seconds after injection of intravenous iodine contrast agent (1.5 mL/kg), without any bolus tracking, unless contraindicated. CT consisted in a 64-slice multidetector-row spiral scanner with the following standard parameters: transverse field of view = 700 mm, collimation = 16 x 1.2 mm, pitch = 1, automatic tube potential modulation (carekV), and automatic tube current modulation (care4D).
PET images were acquired in the craniocaudal direction using a whole-body protocol (2 minutes per step) and were reconstructed using an ordered subset expectation maximization (OSEM) algorithm (True X = point spread function + time of flight compensation ordered subset expectation maximization-3D). The images were corrected for random coincidences, scatter, and attenuation using the CT scan data. PET images were smoothed with a Gaussian filter (full-width at half-maximum = 2 mm). The reconstruction transaxial matrix size was 200 x 200 voxels with voxel size = 4.07 x 4.07 x 2 mm.
Images analysis
All primary tumors were segmented using 3 different contouring methods by two nuclear medicine physicians with oncology expertise, independently, creating volumes of interest (VOI). The 3 different delineation methods consisted in a fixed SUV threshold method, con-taining voxels equal or greater than 40% of SUV maximum value (40%SUVmax) [22][23], a signal-to-noise adaptative SUV threshold method (DAISNE) [24], and an image gradient-based method (PET-EDGE) [25] using MIM software (MIM Software Inc., Cleveland, United-States).
No spatial discretization was used. Texture analysis was performed after applying an abso-lute resampling method to voxels intensities with 64 discrete values and bounds set to 0 and 30 SUV, corresponding to the typical range of tumor SUVs encountered in HNSCC [26].
In each VOI, standard PET quantitative parameters were measured (SUVmax, MTV) and thirty-one textural indices were calculated using LIFEx software (www.lifexsoft.org) [16]
(Table 1). Theses indices were extracted from 4 different matrices which were computed for
each VOI: the Gray-Level Cooccurence Matrix (GLCM), the Gray-Level Run Length Matrix, the Neighborhood Gray-Level Dependence Matrix (NGLDM) and the Gray-Level Zone
Length Matrix (GLZLM). GLCM characterizes how often pairs of voxels with specific SUV val-ues can be found at a specific distance in a specific direction and was computed using a dis-tance of 1 voxel and 13 directions [27]. GLRLM gives the size of homogeneous runs for each gray-level and was computed using 13 directions [28]. NGLDM corresponds to the difference of gray-level between one voxel and its 26 neighbours in 3 directions [29]. GLZLM gives the size of homogeneous zones for each gray-level in 3 dimensions [30]. Textural indices could only be computed by the software for VOI equal or greater than 64 voxels, corresponding to a minimum volume of 2.12ml (voxel size of 4.07x4.07x2mm) and containing only one cluster. For VOI containing more than one cluster, the most representative one was manually selected by the operator based on its uptake intensity and volume.
Statistical analysis
Correlations between textural indices and standard PET quantitative parameters were esti-mated using Pearson coefficients. Pairs of features with a Pearson correlation coefficient higher than 0.8 were considered very highly correlated. Groups of highly correlated parameters were extracted with the same method as Orlhac et al. [18]. One parameter from each indepen-dent group was selected for analysis. Bland Altman plots were used to compare VOI between segmentation methods. Indices variability between contouring methods was analysed for each selected textural index with Friedman and Wilcoxon tests. Inter-observer reproducibility was assessed using an intraclass correlation test. Based on Landis and Koch scale, agreement between operators was considered excellent if the intraclass correlation coefficient (ICC) was superior to 0.8, great for ICC between 0.61 and 0.8, moderate for ICC between 0.41 and 0.6, low for ICC between 0.21 and 0.4 and poor for ICC � 0.2. Significance level of p-value was 0.05. Statistics were realized with XLStat software (Addinsoft, Paris, France).
Results
Patients
Between January and March 2016, 43 patients were included. All patients had a whole-body FDG PET/CT after injection of 3.09± 0.14 MBq/kg of FDG. Glucose level prior to the
Table 1. Textural indices.
Matrix Index
Gray-Level Cooccurence Matrix (GLCM)
Homogeneity, Energy, Contrast_glcm, Correlation, Entropy, Dissimilarity Gray-Level Run Length Matrix
(GLRLM)
SRE (Short-Run Emphasis), LRE (Long-Run Emphasis), LGRE (Low Gray-Level Run Emphasis), HGRE (Hign Gray-Level Run Emphasis), SRLGE (Short-Run Low Gray-Level Emphasis), SRHGE (Short-Run High Gray-Level Emphasis), LRLGE (Long-Run Low Gray-Level Emphasis), LRHGE (Long-Run High Gray-Level Emphasis), GLNUr (Gray-Level Non Uniformity for run), RLNU (Run Length Non Uniformity), RP (Run Percentage)
Neighborhood Gray-Level Dependence Matrix (NGLDM)
Coarseness, Contrast, Busyness Gray-Level Zone Length Matrix
(GLZLM)
SZE (Short-Zone Emphasis), LZE (Long-Zone Emphasis), LGZE (Low Gray-Level Zone Emphasis), HGZE (High Gray-Level Zone Emphasis), SZLGE (Short-Zone Low Gray-Level Emphasis), SZHGE (Short-Zone High Gray-Level Emphasis), LZLGE (Long-Zone Low Gray-Level Emphasis), LZHGE (Long-Zone High Gray-Level Emphasis), GLNUz (Gray-Level Non Uniformity for zone), ZLNU (Zone Length Non Uniformity), ZP (Zone Percentage)
acquisition was 6.4± 1 mmol/L and 29 patients (67%) received iodine contrast agent. Due to a too small segmented tumor VOI (<2.12ml), textural analysis could not be performed in 6, 11 and 15 cases with respectively DAISNE, 40%SUVmax and PET-EDGE segmentation methods. All patients with a too small VOI with either DAISNE or 40%SUVmax also had a too small VOI with PET-EDGE method so that 28 patients (male = 24, female = 4, mean age± SD = 64.8± 9.8 years) had large enough segmented VOI with the 3 segmentation methods to allow all features’ calculation (31 textural indices, SUVmax and MTV). Patients’ characteristics are shown inTable 2.
Correlation analysis
After correlation analysis of each of the 31 textural indices with all the other indices, 9 groups of highly correlated parameters were extracted. Nine independent textural indices were selected: Homogeneity, Correlation, Entropy, Busyness, LZLGE, LZHGE, LGZE, HGZE and GLNUz (Table 3). After correlation analysis of these 9 textural indices with standard PET quantitative parameters, LGZE and HGZE were significantly correlated with SUVmax (r = -0.89, p < 0.0001 and r = 0.97, p < 0.0001 respectively) while GLNUz and LZHGE were signif-icantly correlated with MTV (r = 0.96, p < 0.0001 and r = 0.84, p < 0.0001). Five textural indi-ces were finally selected: Homogeneity, Correlation, Entropy, Busyness and LZLGE.
Correlation coefficients are shown inTable 4.
Inter-contouring method reproducibility
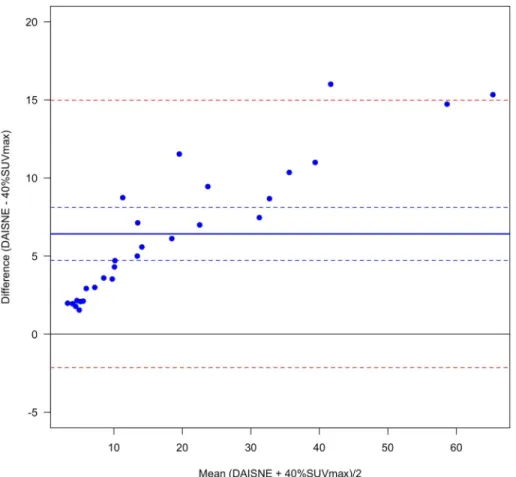
VOI were significantly different between the 3 segmentation methods. VOI were always higher with PET-EDGE or DAISNE when compared to 40%SUVmax (bias = 11.0± 11.7 and
bias = 6.4±, 4.4 respectively for PET-EDGE versus 40%SUVmax and DAISNE versus 40% SUVmax) (Figs1and2). The difference was less pronounced between PET-EDGE and DAISNE methods (bias = 4.6± 9.0) (Fig 3). An example depicting the VOI segmented with the 3 methods is shown inFig 4.
Table 2. Characteristics of patients.
Characteristics Patients (n = 28)
Age, y, mean± SD 64.8± 9.8
Sex, M/F 24/4
Tumor location, no. of patients (%)
Oral cavity 8 (28)
Oropharynx 10 (36)
Hypopharynx 6 (21)
Larynx 1 (4)
Extended (� 2 subsites) 3 (11)
AJCC stage, no. of patients (%)
I 0 (0)
II 3 (11)
III 2 (7)
IV 23 (82)
T classification, no. of patients (%)
T1 0 (0)
T2 7 (25)
T3 5 (18)
T4 16 (57)
Four of the 5 textural indices, Homogeneity, Correlation, Entropy and LZLGE, were signifi-cantly different between the 3 contouring methods (p < 0.0001 for each index). Busyness was not significantly different between the 3 contouring methods (p = 0.52) (Table 5).
The same results were found when comparing separately 40%SUVmax with PET-EDGE and 40%SUVmax with DAISNE. Concerning PET-EDGE with DAISNE comparison, Homo-geneity was not significantly different between the 2 contouring methods; the results remained the same for the 4 other indices (Table 5).
Inter-observer reproducibility
Homogeneity, Entropy and Correlation had an excellent inter-observer reproducibility for the 3 contouring methods with an intraclass correlation coefficient higher than 0.92, 0.90, 0.98 when considering respectively 40%SUVmax, PET-EDGE and DAISNE methods. LZLGE inter-observer reproducibility was excellent when using 40%SUVmax and DAISNE
(ICC = 0.99 for both methods) and poor when using PET-EDGE (ICC = 0.04). Busyness inter-observer reproducibility was poor with the 3 methods (ICC = 0.10, ICC = -0.09 and ICC = -0.003, with respectively 40%SUVmax, PET-EDGE and DAISNE) (Table 6).
Discussion
Evaluating intra-tumoral heterogeneity with textural indices may help thoroughly classifying patients between different risk subgroups. It would be particularly useful in HNSCC, con-jointly with usual prognostic factors, to select patients with poor prognosis who would require intensified therapy [31].
Table 3. Groups of highly correlated indices.
Groups of highly correlated indices Absolute correlation coefficients mean± SD
Homogeneity, Contrast_glcm, Dissimilarity, SRE, LRE, RP, Contrast, SZE, ZP
0.89± 0.08 LGZE, SZLGE, LGRE, SRLGE, LRLGE, Energy 0.93± 0.08
HGZE, SZHGE, HGRE, SRHGE, LRHGE 0.99± 0.01
GLNUz, GLNUr, RLNU 0.94± 0.03
Entropy, Coarseness, ZLNU 0.78± 0.08
LZHGE, LZE 0.85
Correlation
-Busyness
-LZLGE
-https://doi.org/10.1371/journal.pone.0214299.t003
Table 4. Textural indices correlation coefficient between themselves and with PET standard quantitative parameters (Pearson test).
Parameters SUVmax MTV Homogeneity Correlation Entropy Busyness LZLGE
SUVmax 1 -0.25 -0.69 -0.22 0.33 0.23 -0.48 MTV 1 0.69 0.69 0.55 0.17 0.73 Homogeneity 1 0.67 0.24 -0.15 0.69 Correlation 1 0.52 0.07 0.58 Entropy 1 0.21 0.07 Busyness 1 0.03 LZLGE 1 https://doi.org/10.1371/journal.pone.0214299.t004
The calculation of textural indices depends on the definition of several parameters. These parameters include the contouring method and the resampling method. Before analysing the prognostic significance of textural indices, their variability with regard to these parameters needs to be assessed. Indeed in HNSCC, no consensus has been reached on the most appropri-ate indices and parameters to use. The correlation between textural indices and with standard PET quantitative parameters should also be taken into account [26]. In our study, to limit the variability to these quantitative parameters, we chose to focus on only one type of tumors, HNSCC. Then, after correlation analysis, we evaluated the variability of textural indices between three segmentation methods and their reproducibility between two observers.
We chose to evaluate 3 segmentation methods, 40%SUVmax, DAISNE and PET-EDGE to contour tumors. VOI segmented with 40%SUVmax were always lower than VOI segmented with PET-EDGE and DAISNE methods, all the more since the tumor lesion was larger. Fixed threshold methods such as 40%SUVmax tend to underestimate the tumor volume and there-fore may not capture regions of extremely low uptake such as necrotic regions. However a fixed threshold method may also prevent the selection of non-tumor regions close to the tumor. For textural analysis purpose, a more anatomical segmentation method, such as man-ual segmentation on CT, could be more appropriate to include the heterogeneity of the tumor microenvironment. Yet such a method would be less reproducible and much more time-con-suming. Moreover, we retrospectively calculated the signal to background ratio (SBR). In this
Fig 1. Variability between PET-EDGE and 40%SUVmax method. Bland-Altman plot. (Solid blue line) Bias. (Dashed
blue lines) Bias 95% confidence interval. (Dashed red lines) Difference 95% confidence interval. https://doi.org/10.1371/journal.pone.0214299.g001
series, SBR was 23.5± 7.4 confirming that tumors were very well distinguishable from the background.
In our study, no spatial discretization was needed since all the images were acquired with exactly the same technical features, including the voxel size. We chose an absolute resampling method to discretize voxels intensities because it was shown to be more appropriate for inter and intra-patients comparison [32] and to allow both more intuitive indices’ variations to be observed and better tumor discrimination [26].
Our results showed that most textural indices extracted from pre-therapeutic FDG PET/CT were very highly correlated between themselves and with standard PET quantitative parame-ters. After correlation analysis of 33 parameters (31 textural indices, SUVmax and MTV), we identified 5 independent textural indices: Homogeneity, Entropy, Correlation, Busyness and LZLGE. This high correlation between textural parameters and standard PET quantitative parameters was in agreement with previous studies [18]. The high correlation between textural parameters is partly due to their definition. For example GLRLM and GLZLM are constructed based on the same principle taking into account either identical voxels in a given axis
(GLRLM) and calculated an average over every axes or identical voxels in a given volume (GLZLM) [28][30]. The indices extracted from both matrices have identical definitions and therefore a high probability of being highly correlated. Since textural analysis consists in ana-lysing the spatial distribution of voxels intensities in a given volume, there is also a possible correlation of these indices with SUVmax and MTV.
Fig 2. Variability between DAISNE and 40%SUVmax method. Bland-Altman plot. (Solid blue line) Bias. (Dashed
blue lines) Bias 95% confidence interval. (Dashed red lines) Difference 95% confidence interval. https://doi.org/10.1371/journal.pone.0214299.g002
Orlhac et al. showed a high correlation within textural indices and with standard PET quan-titative parameters in patients with metastatic colorectal cancers, small cell lung cancers and breast cancers [18]. They selected 6 independent textural indices (Homogeneity, Entropy, SRE, LRE, LGZE and HGZE). Using the same methodology, we also constructed subgroups of highly correlated parameters and selected 5 independent textural indices of which 2 were iden-tical, Homogeneity and Entropy. We found a high correlation between SRE, LRE and Homo-geneity, and between LGZE, HGZE and SUVmax. These results may be explained by the chosen resampling method [26].
We studied the variability of textural indices between 3 contouring methods, a fixed thresh-old method (40% of SUVmax), an adaptive threshthresh-old method (Daisne) and a method based on gradients (PET-EDGE). Indeed in PET characterisation of HSNCC, no contouring method has reached consensus yet [14][33]. In our series, among the 5 selected textural indices, 4 (Homogeneity, Correlation, Entropy and LZLGE) showed a high inter-contouring method variability, with a significant difference (p<0.0001). Only one index, Busyness, was reproduc-ible between contouring methods (p = 0.52). Previous studies concerning other types of solid cancer showed various behaviours of textural indices with regard to contouring methods, some of them varying greatly. In locally advanced oesophageal cancers, comparing a fixed threshold (42% of SUVmax) with an adaptive threshold method (FLAB), Entropy showed a low to intermediate variability and Homogeneity an intermediate to very high variability [34]. In metastatic colorectal, small cell lung and breast cancers, comparing a fixed threshold (40%
Fig 3. Variability between PET-EDGE and DAISNE method. Bland-Altman plot. (Solid blue line) Bias. (Dashed blue
lines) Bias 95% confidence interval. (Dashed red lines) Difference 95% confidence interval. https://doi.org/10.1371/journal.pone.0214299.g003
of SUVmax) with an adaptive threshold method (Nestle), Entropy was reproducible, Homoge-neity varied moderately and Correlation, Busyness and LZLGE varied a lot between the meth-ods [35][18]. In our study, we found a high variability of 4 out of the 5 selected textural indices, Homogeneity, Correlation, Entropy, and LZLGE, whereas Busyness was reproducible between the 3 contouring methods studied. The divergent result for Entropy could be explained by the chosen resampling method [26]. Regarding Busyness, our different result may be explained by its orders of magnitude, varying between 1012and 1015.
Fig 4. Example of VOI delineating a tumor with the 3 segmentation methods. (Turquoise blue) PET-EDGE
segmentation method. (Sky blue) DAISNE segmentation method. (Dark blue) 40%SUVmax segmentation method. (Top left) FDG PET sagittal slice. (Top right) FDG PET transverse slice. (Bottom left) FDG PET frontal slice. (Bottom right) SUV histograms. With LIFEx software.
https://doi.org/10.1371/journal.pone.0214299.g004
Table 5. Inter-segmentation method variability (Friedman and Wilcoxon test p-values). Friedman test
p-value
Wilcoxon test p-value
Parameters 40%SUVmax vs PET-EDGE vs DAISNE 40%SUVmax vs PET-EDGE 40%SUVmax vs DAISNE PET-EDGE vs DAISNE
SUVmax 1 1 1 1 Volume (mL) p<0.0001 p<0.0001 p<0.0001 0.0004 Homogeneity p<0.0001 0.0003 p<0.0001 0.20 Correlation p<0.0001 p<0.0001 p<0.0001 p<0.0001 Entropy p<0.0001 p<0.0001 p<0.0001 0.0002 Busyness 0.52 0.52 0.43 0.78 LZLGE p<0.0001 p<0.0001 0.016 p<0.0001 https://doi.org/10.1371/journal.pone.0214299.t005
We found an excellent inter-observer reproducibility for 3 selected indices (Homogeneity, Correlation and Entropy) with the 3 contouring methods (ICC>0.9), and for LZLGE (ICC = 0.99) with only 2 contouring methods (40%SUVmax and DAISNE). On the contrary, Busyness was poorly reproducible (-0.09<ICC<0.1) regardless of the contouring method. This result could also be explained by its orders of magnitude. Selecting a robust textural index in terms of inter-observer reproducibility is fundamental before assessing its prognostic value in further studies.
There are several limitations to our study.
Firstly, our study concerned a small number of patients. Indeed, this was a preliminary study to evaluate the robustness of textural indices extracted from FDG PET/CT in HSNCC. Our results should be confirmed on larger cohorts of patients.
Secondly, small tumours were an issue in textural analysis as showed in previous studies [36]. Textural indices could not be calculated in 11 (25%), 15 (34%), and 6 (14%) patients with respectively 40%SUVmax, PET-EDGE and DAISNE contouring method, because of too small delineated VOI. Textural analysis was performed with the 3 methods by the 2 observers in 28 patients (65%). The required minimum volume for analysis was 2.12ml in our study. This is consistent with previous reports focusing on several types of cancers that also fixed a mini-mum volume, varying from 3 to 5ml [37][36][38], thus only slightly higher than ours. Increas-ing the number of voxels contained in a VOI would require the acquisition of high definition images, but this would be more time-consuming and difficult to use in routine.
Thirdly, delineated contours could consist of more than one cluster, when using fixed or adaptive threshold contouring methods. Since texture calculation requires a closed delineated contour, with only one cluster, a manual intervention was then needed, either to close the con-tour with topologic operators or to select the most representative cluster considering its uptake intensity and volume. Thus, with the most heterogeneous tumours, the risk was greater to obtain more than one cluster, resulting in a loss of this heterogeneity information by having to adjust manually the VOI [26]. Gradient-based methods could therefore be preferred in so far as they result in a single contour. Manual segmentation on CT would also eliminate the prob-lems of clusters. However, it would be less reproducible between observers and much more time-consuming. In our study, the inter-observer reproducibility was excellent for 3 out of the 5 selected indices with the 3 contouring methods and the reproducibility was always inferior with PET-EDGE when compared with 40%SUVmax and DAISNE.
Another limitation in our study was the possible influence of dental artifacts on textural analysis. Indeed dental artifacts or hardware were present and in the field of view of the tumor in 8 out of 43 patients (18%). Further studies would need to evaluate this influence specifically.
Finally, in this study, a Gaussian smoothing filter was applied in post-processing. Such post-processing may alter the results of textural analysis. Nevertheless, we wanted to use the
Table 6. Inter-observer reproducibility (intra-class correlation coefficient).
Parameters 40%SUVmax ICC PET-EDGE
ICC DAISNE ICC SUVmax 1 1 1 MTV 0.99 0.88 0.99 Homogeneity 0.99 0.95 0.99 Correlation 0.92 0.90 0.99 Entropy 0.99 0.92 0.98 Busyness 0.10 -0.09 -0.003 LZLGE 0.99 0.04 0.99 https://doi.org/10.1371/journal.pone.0214299.t006
same post-processing generally applied in clinical routine by the majority of centres. However, our results would have to be confirmed with other acquisition protocols and reconstruction tools.
Conclusion
This preliminary study showed a high variability of 4 out of 5 textural indices (Homogeneity, Correlation, Entropy and LZLGE) extracted from pre-therapeutic FDG PET/CT in HNSCC between 3 contouring methods (40%SUVmax, DAISNE, PET-EDGE). However there was an excellent agreement between observers in calculating Homogeneity, Correlation and Entropy indices.
Before integrating texture analysis in overall risk stratification in HNSCC, a consensus should be reached stating which parameters to choose for calculations, particularly the seg-mentation method to apply. Meanwhile, comparing studies with different segseg-mentation meth-ods will remain difficult.
Author Contributions
Conceptualization: Catherine Guezennec, David Bourhis, Fanny Orlhac, Pierre-Yves Salau¨n, Ronan Abgral.
Data curation: Catherine Guezennec, Jean-Baptiste Corre, Olivier Delcroix, Yves Gobel,
Ulrike Schick, Ronan Abgral.
Formal analysis: Catherine Guezennec, David Bourhis, Jean-Baptiste Corre.
Methodology: Catherine Guezennec, David Bourhis, Fanny Orlhac, Philippe Robin, Olivier
Delcroix, Yves Gobel, Pierre-Yves Salau¨n, Ronan Abgral.
Project administration: Catherine Guezennec.
Software: Catherine Guezennec, David Bourhis, Fanny Orlhac, Jean-Baptiste Corre, Ulrike
Schick, Ronan Abgral.
Supervision: David Bourhis, Fanny Orlhac, Philippe Robin, Pierre-Yves Salau¨n, Ronan Abgral.
Validation: Ronan Abgral.
Writing – original draft: Catherine Guezennec.
Writing – review & editing: Catherine Guezennec, David Bourhis, Fanny Orlhac, Philippe
Robin, Jean-Baptiste Corre, Olivier Delcroix, Yves Gobel, Ulrike Schick, Pierre-Yves Sal-au¨n, Ronan Abgral.
References
1. Worsham MJ, Ali H, Dragovic J, Schweitzer VP. Molecular Characterization of Head and Neck Cancer: How Close to Personalized Targeted Therapy? Mol Diagn Ther. 2012 Aug 1; 16(4):209–22.https://doi. org/10.2165/11635330-000000000-00000PMID:22873739
2. Jou A, Hess J. Epidemiology and Molecular Biology of Head and Neck Cancer. Oncol Res Treat. 2017; 40(6):328–32.https://doi.org/10.1159/000477127PMID:28531899
3. De Cecco L, Nicolau M, Giannoccaro M, Daidone MG, Bossi P, Locati L, et al. Head and neck cancer subtypes with biological and clinical relevance: Meta-analysis of gene-expression data. Oncotarget. 2015 Apr 20; 6(11):9627–42.https://doi.org/10.18632/oncotarget.3301PMID:25821127
4. Hasina R, Whipple M, Martin L, Kuo WP, Ohno-Machado L, Lingen MW. Angiogenic Heterogeneity in Head and Neck Squamous Cell Carcinoma: Biologic and Therapeutic Implications. Lab Investig J Tech Methods Pathol. 2008 Apr; 88(4):342–53.
5. Sittel C, Ruiz S, Volling P, Kvasnicka HM, Jungehu¨ lsing M, Eckel HE. Prognostic significance of Ki-67 (MIB1), PCNA and p53 in cancer of the oropharynx and oral cavity. Oral Oncol. 1999 Nov; 35(6):583–9. PMID:10705094
6. Xie S, Liu Y, Qiao X, Hua R-X, Wang K, Shan X-F, et al. What is the Prognostic Significance of Ki-67 Positivity in Oral Squamous Cell Carcinoma? J Cancer. 2016; 7(7):758–67.https://doi.org/10.7150/jca. 14214PMID:27162533
7. Global Burden of Disease Cancer Collaboration, Fitzmaurice C, Allen C, Barber RM, Barregard L, Bhutta ZA, et al. Global, Regional, and National Cancer Incidence, Mortality, Years of Life Lost, Years Lived With Disability, and Disability-Adjusted Life-years for 32 Cancer Groups, 1990 to 2015: A System-atic Analysis for the Global Burden of Disease Study. JAMA Oncol. 2017 Apr 1; 3(4):524–48.https://doi. org/10.1001/jamaoncol.2016.5688PMID:27918777
8. Sobin LH, Gospodarowicz MK, Wittekind C. TNM Classification of Malignant Tumours, 7th Edition. Wiley-Blackwell; 2009.
9. Edge S, Byrd DR, Compton CC, Trotti A. AJCC Cancer Staging Manual. 7th Edition. Springer; 2010.
10. Fakhry C, Westra WH, Li S, Cmelak A, Ridge JA, Pinto H, et al. Improved survival of patients with human papillomavirus-positive head and neck squamous cell carcinoma in a prospective clinical trial. J Natl Cancer Inst. 2008 Feb 20; 100(4):261–9.https://doi.org/10.1093/jnci/djn011PMID:18270337
11. Ang KK, Trotti A, Brown BW, Garden AS, Foote RL, Morrison WH, et al. Randomized trial addressing risk features and time factors of surgery plus radiotherapy in advanced head-and-neck cancer. Int J Radiat Oncol Biol Phys. 2001 Nov 1; 51(3):571–8. PMID:11597795
12. National Comprehensive Cancer Network. NCCN Clinical Practive Guidelines in Oncology: Head and Neck Cancer [Internet]. National Comprehensive Cancer Network website. 2016. Available from:
https://www.nccn.org/professionals/physician_gls/pdf/head-and-neck.pdf.
13. Querellou S, Abgral R, Le Roux P-Y, Nowak E, Valette G, Potard G, et al. Prognostic value of fluorine-18 fluorodeoxyglucose positron-emission tomography imaging in patients with head and neck squa-mous cell carcinoma. Head Neck. 2012 Apr; 34(4):462–8.https://doi.org/10.1002/hed.21765PMID:
21604320
14. Abgral R, Keromnes N, Robin P, Le Roux P-Y, Bourhis D, Palard X, et al. Prognostic value of volumetric parameters measured by 18F-FDG PET/CT in patients with head and neck squamous cell carcinoma. Eur J Nucl Med Mol Imaging. 2014 Apr; 41(4):659–67.https://doi.org/10.1007/s00259-013-2618-1
PMID:24196922
15. Abgral R, Valette G, Robin P, Rousset J, Keromnes N, Le Roux P-Y, et al. Prognostic evaluation of per-centage variation of metabolic tumor burden calculated by dual-phase (18) FDG PET-CT imaging in patients with head and neck cancer. Head Neck. 2016 Apr; 38 Suppl 1:E600–606.
16. Nioche C, Orlhac F, Boughdad S, Reuze´ S, Goya-Outi J, Robert C, et al. LIFEx: A Freeware for Radio-mic Feature Calculation in Multimodality Imaging to Accelerate Advances in the Characterization of Tumor Heterogeneity. Cancer Res. 2018 Aug 15; 78(16):4786–9.https://doi.org/10.1158/0008-5472. CAN-18-0125PMID:29959149
17. Vallières M, Zwanenburg A, Badic B, Rest CCL, Visvikis D, Hatt M. Responsible Radiomics Research for Faster Clinical Translation. J Nucl Med. 2018 Jan 2; 59(2):189–93.https://doi.org/10.2967/jnumed. 117.200501PMID:29175982
18. Orlhac F, Soussan M, Maisonobe J-A, Garcia CA, Vanderlinden B, Buvat I. Tumor texture analysis in 18F-FDG PET: relationships between texture parameters, histogram indices, standardized uptake val-ues, metabolic volumes, and total lesion glycolysis. J Nucl Med Off Publ Soc Nucl Med. 2014 Mar; 55 (3):414–22.
19. Cheng N-M, Fang Y-HD, Chang JT-C, Huang C-G, Tsan D-L, Ng S-H, et al. Textural features of pre-treatment 18F-FDG PET/CT images: prognostic significance in patients with advanced T-stage oropha-ryngeal squamous cell carcinoma. J Nucl Med Off Publ Soc Nucl Med. 2013 Oct; 54(10):1703–9.
20. Cheng N-M, Fang Y-HD, Lee L, Chang JT-C, Tsan D-L, Ng S-H, et al. Zone-size nonuniformity of 18F-FDG PET regional textural features predicts survival in patients with oropharyngeal cancer. Eur J Nucl Med Mol Imaging. 2015 Mar; 42(3):419–28.https://doi.org/10.1007/s00259-014-2933-1PMID:
25339524
21. Oh JS, Kang BC, Roh J-L, Kim JS, Cho K-J, Lee S-W, et al. Intratumor Textural Heterogeneity on Pre-treatment (18)F-FDG PET Images Predicts Response and Survival After Chemoradiotherapy for Hypo-pharyngeal Cancer. Ann Surg Oncol. 2015 Aug; 22(8):2746–54. https://doi.org/10.1245/s10434-014-4284-3PMID:25487968
22. Dibble EH, Alvarez ACL, Truong M-T, Mercier G, Cook EF, Subramaniam RM. 18F-FDG metabolic tumor volume and total glycolytic activity of oral cavity and oropharyngeal squamous cell cancer: adding value to clinical staging. J Nucl Med Off Publ Soc Nucl Med. 2012 May; 53(5):709–15.
23. Kao C-H, Lin S-C, Hsieh T-C, Yen K-Y, Yang S-N, Wang Y-C, et al. Use of pretreatment metabolic tumour volumes to predict the outcome of pharyngeal cancer treated by definitive radiotherapy. Eur J Nucl Med Mol Imaging. 2012 Aug; 39(8):1297–305.https://doi.org/10.1007/s00259-012-2127-7PMID:
22532254
24. Daisne J-F, Duprez T, Weynand B, Lonneux M, Hamoir M, Reychler H, et al. Tumor volume in pharyn-golaryngeal squamous cell carcinoma: comparison at CT, MR imaging, and FDG PET and validation with surgical specimen. Radiology. 2004 Oct; 233(1):93–100.https://doi.org/10.1148/radiol. 2331030660PMID:15317953
25. Geets X, Lee JA, Bol A, Lonneux M, Gre´goire V. A gradient-based method for segmenting FDG-PET images: methodology and validation. Eur J Nucl Med Mol Imaging. 2007 Sep; 34(9):1427–38.https:// doi.org/10.1007/s00259-006-0363-4PMID:17431616
26. Orlhac F, Soussan M, Chouahnia K, Martinod E, Buvat I. 18F-FDG PET-Derived Textural Indices Reflect Tissue-Specific Uptake Pattern in Non-Small Cell Lung Cancer. PloS One. 2015; 10(12): e0145063.https://doi.org/10.1371/journal.pone.0145063PMID:26669541
27. Haralick R. M., Shanmugam K., Its’hak Dinstein. Textural features for image classification. IEEE Trans Syst Man Cybern. 1973 Nov; 3(6):610–21.
28. Xu D-H, Kurani AS, Furst JD, Raicu DS. Run-length encoding for volumetric texture. In: ResearchGate [Internet]. Marbella, Spain; 2004. Available from:https://www.researchgate.net/publication/
228982395_Run-length_encoding_for_volumetric_texture
29. Amadasun M, King R. Textural features corresponding to textural properties. IEEE Trans Syst Man Cybern. 1989 Sep; 19(5):1264–74.
30. Thibault G, Fertil B, Navarro C, Fetil B, Pereira HS, Cau P, et al. Texture indexes and gray level size zone matrix. Application to cell nuclei classification. In Minsk, Belarus; 2009. p. 140–5. Available from:
https://www.scienceopen.com/document?vid=2c91747d-b5c9-4a39-8751-9e17e9776f22
31. Guezennec C, Robin P, Orlhac F, Bourhis D, Delcroix O, Gobel Y, et al. Prognostic value of textural indi-ces extracted from pretherapeutic 18-F FDG-PET/CT in head and neck squamous cell carcinoma. Head Neck. 2019 Feb; 41(2):495–502.https://doi.org/10.1002/hed.25433PMID:30549149
32. Leijenaar RTH, Nalbantov G, Carvalho S, van Elmpt WJC, Troost EGC, Boellaard R, et al. The effect of SUV discretization in quantitative FDG-PET Radiomics: the need for standardized methodology in tumor texture analysis. Sci Rep. 2015 Aug 5; 5:11075.https://doi.org/10.1038/srep11075PMID:
26242464
33. Pak K, Cheon GJ, Nam H-Y, Kim S-J, Kang KW, Chung J-K, et al. Prognostic value of metabolic tumor volume and total lesion glycolysis in head and neck cancer: a systematic review and meta-analysis. J Nucl Med Off Publ Soc Nucl Med. 2014 Jun; 55(6):884–90.
34. Hatt M, Tixier F, Cheze Le Rest C, Pradier O, Visvikis D. Robustness of intratumour18F-FDG PET uptake heterogeneity quantification for therapy response prediction in oesophageal carcinoma. Eur J Nucl Med Mol Imaging. 2013 Oct; 40(11):1662–71.https://doi.org/10.1007/s00259-013-2486-8PMID:
23857457
35. Nestle U, Kremp S, Schaefer-Schuler A, Sebastian-Welsch C, Hellwig D, Ru¨be C, et al. Comparison of different methods for delineation of 18F-FDG PET-positive tissue for target volume definition in radio-therapy of patients with non-Small cell lung cancer. J Nucl Med Off Publ Soc Nucl Med. 2005 Aug; 46 (8):1342–8.
36. Brooks FJ, Grigsby PW. The effect of small tumor volumes on studies of intratumoral heterogeneity of tracer uptake. J Nucl Med Off Publ Soc Nucl Med. 2014 Jan; 55(1):37–42.
37. Hatt M, Majdoub M, Vallières M, Tixier F, Le Rest CC, Groheux D, et al. 18F-FDG PET uptake charac-terization through texture analysis: investigating the complementary nature of heterogeneity and func-tional tumor volume in a multi-cancer site patient cohort. J Nucl Med Off Publ Soc Nucl Med. 2015 Jan; 56(1):38–44.
38. Brooks FJ, Grigsby PW. Low-order non-spatial effects dominate second-order spatial effects in the tex-ture quantifier analysis of 18F-FDG-PET images. PloS One. 2015; 10(2):e0116574.https://doi.org/10. 1371/journal.pone.0116574PMID:25714472