HAL Id: hal-01713277
https://hal-univ-rennes1.archives-ouvertes.fr/hal-01713277
Submitted on 27 Apr 2018HAL is a multi-disciplinary open access
archive for the deposit and dissemination of sci-entific research documents, whether they are pub-lished or not. The documents may come from teaching and research institutions in France or abroad, or from public or private research centers.
L’archive ouverte pluridisciplinaire HAL, est destinée au dépôt et à la diffusion de documents scientifiques de niveau recherche, publiés ou non, émanant des établissements d’enseignement et de recherche français ou étrangers, des laboratoires publics ou privés.
Katrien van Petegem, Felix Moerman, Maxime Dahirel, Emanuel A Fronhofer,
Martijn L. Vandegehuchte, Thomas van Leeuwen, Nicky Wybouw, Robby
Stoks, Dries Bonte
To cite this version:
Katrien van Petegem, Felix Moerman, Maxime Dahirel, Emanuel A Fronhofer, Martijn L. Vandege-huchte, et al.. Kin competition accelerates experimental range expansion in an arthropod herbivore. Ecology Letters, Wiley, 2018, 21 (2), pp.225-234. �10.1111/ele.12887�. �hal-01713277�
Title: Kin competition as driver of range expansions
Authors:
K. Van Petegem1,*, Felix Moerman2,*, Maxime Dahirel3, Emanuel A. Fronhofer2, Martijn L.
Vandegehuchte1, Thomas Van Leeuwen4, Nicky Wybouw5, Robby Stoks6, Dries Bonte1
Author affiliations:
K. Van Petegem, M. Vandegehuchte, D. Bonte – Ghent University, Dept. Biology, K.L. Ledeganckstraat 35, 9000 Ghent, Belgium (corresponding author: D. Bonte)
F. Moerman, E.A. Fronhofer – Eawag: Swiss Federal Institute of Aquatic Science and Technology, Department of Aquatic Ecology, Überlanderstrasse 133, CH-8600 Dübendorf, Switzerland; University of Zürich, Department of Evolutionary Biology and Environmental Studies, Winterthurerstrasse 190, CH-8057 Zürich, Switzerland
M. Dahirel – Université de Rennes 1, UMR CNRS EcoBio, 263 avenue du Général Leclerc, 35042 Rennes, France
N. Wybouw – Evolutionary Biology, IBED, University of Amsterdam, Science Park 904 1098 XH Amsterdam, The Netherlands
T. Van Leeuwen – Ghent University, Department of Crop Protection, Faculty of Bioscience Engineering, B-9000, Ghent, Belgium
R. Stoks – University of Leuven, Dept. Biology, Deberiotstraat 32, 3000 Leuven, Belgium * contributed equally to the work
Corresponinding author: Dries Bonte, Ghent Universiy, K.L. Ledeganckstraat 35, B-9000 Ghent, Belgium – [email protected]
Abstract:
With ongoing global change, life is continuously forced to move to novel areas, imposing rapid changes in biotic communities and ecosystem functioning[1].As dispersal is central to range dynamics, factors promoting fast and distant dispersal are key to understanding and predicting range expansions. As the range expands, genetic variation is strongly depleted and genetic homogenisation increases[2–4]. Such conditions should reduce evolutionary potential, but also impose severe kin competition. Although kin competition in turn drives dispersal[5], we lack insights into its contribution to range expansions, relative to other causal processes. To separate evolutionary dynamics from kin competition, we combined simulation modelling and experimental range expansion using the spider mite Tetranychus urticae. Both modelling and experimental evolution demonstrated that plastic responses to kin structure increased range expansion speed by about 20%, while the effects of evolution and spatial sorting were marginal. This insight resolves an important paradox between the loss of genetic variation and earlier observed evolutionary dynamics facilitating range expansions. Kin competition may thus provide a social rescue mechanism in populations that are forced to keep up with fast climate change.
Introduction
Cooperation and conflict are central to understanding organismal interactions and their impact on population and community dynamics[3, 6]. In group-living species, related individuals may profit from collective behaviour, but competition among kin may eventually outweigh the potential benefits[7]. Dispersal provides a prominent means to avoid competition with kin and conflict more generally. Even when dispersal entails high costs, dispersers may be released from local competition, thereby increasing their inclusive fitness[5]. This effect is even stronger when dispersal is not a fixed genetic trait, but a conditional response[8, 9], for instance conditional on kin structure where individuals plastically adapt their dispersal strategy to current levels of relatedness[10]. Dispersal has been recognized as a central and independent trait in life history, known to have a strong impact on spatial dynamics in fragmented landscapes or during range expansions [9, 11–13]. Nonetheless, we surprisingly lack knowledge about the consequences of the interaction between kin structure and conditional dispersal for ecological patterns at large spatial scales, such as range expansions.
The speed and extent of range expansions and biological invasions have traditionally been regarded as consequences of human introductions or ecological factors such as enemy release[14]
.
Recently, a booming field of theory has demonstrated the importance of evolutionary dynamics through spatial selection of dispersal and/or reproduction at the expanding range front[15]. The process of genetic assortment at expanding range borders results in the evolution of increased dispersal because highly dispersive genotypes colonize vacant habitat first. In addition, systematic low densities at the leading edge select for increased reproductive performance. Emerging assortative mating from spatial sorting then accelerates these evolutionary dynamics at the range front (i.e. the Olympic village effect [16]), speed up range expansions and make biological invasions even more challenging to contain [17]. Although mechanisms behind spatial selection and spatial sorting are different, we refer here to both as spatial sorting for the ease of communication.Paradoxically, evolutionary change should be slow during range expansions as genetic variation already gets depleted early-on due to subsequent founder effects, rendering drift important, and thus potentially constraining further evolutionary change[18]. Simultaneously, high levels of local genetic relatedness emerge due to reduced population sizes[2–4]. In many arthropods, for instance, single female colonisers found highly related populations[19]. Kin competition in combination with an appropriate conditional dispersal response may thus be a key driver of fast range expansions and could potentially explain the paradox of fast expansions despite severe genetic diversity loss [20]. Unfortunately, conditional dispersal related to kin interactions have to date been neglected in the context of range expansions and biological invasions (but see one study on the evolution of unconditional dispersal and kin structure during range expansions[4]).
We tested the relative effect of kin competition and spatial sorting on range expansion dynamics by means of in silico simulations and experimental range expansions, using the two-spotted spider mite
Tetranychus urticae Koch (Acari, Tetranychidae) as a model organism. This mite species allows us to
assess quantitative life history traits in detail[21–24]. Spider mite life history traits, including dispersal, are documented to be heritable but highly plastic in response to inter- and intra-generational environmental and social conditions[25–27]. The effect of genetic relatedness on both dispersal distance and emigration rate is, for instance, as strong as that of density dependence[10].
Material and Methods
General model algorithm
The model is individual-based and object-oriented and simulates demographic and evolutionary processes along a one-dimensional array of patches. Patches contain resources, which are consumed by individuals at different rates depending on their life stage (juvenile or adult). Resources are refreshed weekly. Individuals start out with a limited reserve of resources, which they will need to replenish in order to survive. A detailed model description and additional results on in silico trait evolution are available in supplementary material 1.
Males and females of Tetranychus urticae differ in a number of aspects. Firstly, males are much smaller when reaching the adult life stage, and hence contribute little to resource consumption (males hardly feed when becoming adult). Secondly, dispersal behaviour differs between the two sexes, with adult females being the dominant dispersers, whereas juveniles and males disperse very little. Lastly, the species is characterized by a haplodiploid life cycle, where non-mated females only produce haploid male offspring, and mated females can produce both haploid male and diploid female eggs. The sex ratio of spider mites is female-biased, with approximately 0.66 males to females. For these reasons and for the sake of simplicity, we designed the model to only include female mites, where the genotype of the individual is passed on from mother to daughter. Individuals carry the following genetic traits: age at maturity, fecundity, longevity, and a categorical neutral genotype (one unique allele per individual) which defines relatedness. Mean relatedness of an individual A in a patch X can be calculated as the number of individuals in patch X carrying the same relatedness genotype as individual A, divided by the total number of individuals, and hence ranges from 0 (no related individuals present) to 1 (all individuals are related to individual A). After 80 steps, concurring with 80 days in our experimental range expansions, both the length of the metapopulation (i.e. the total number of patches in the metapopulation) and the mean life history trait values at the core and edge were recorded. To this end, individuals present in the first patch of the metapopulation (core) or in the last three occupied patches (edge) were tracked (cf. the experimental part of the study) and the mean value of every life history trait was calculated and recorded.
The following scenarios were tested:
A. A treatment where dynamics include putative kin competition and evolution. In this scenario, females pass their allele values to the offspring. Mutations occur at a rate of 0.001 and change the trait value to a randomly assigned one as during the initialisation phase. The genotype ID remains unchanged (relatedness is unaffected by trait value mutation).
B. A treatment where dynamics do not allow evolution, by changing trait values during reproduction at a mutational rate of 1. In this scenario, all trait values are reset according to the initialisation procedure. Only genotype is maintained, and therefore kin structure and possible kin competition.
C. A treatment representing a reshuffling of females. Under this scenario, and as in the experimental procedure, adult females are replaced each week by random females from the stock population. Thus, both trait values and relatedness genotype are re-initialised, eliminating both kin competition and evolution.
The model was entirely programmed in Python 3.3. Syntax of the code is publically available on Github: [email protected]:dbonte/Python-code-Van-Petegem-et-al.-2017.git
Experimental range expansions
T. urticae strains
Several different strains of T. urticae were used within the current study: LS-VL, MR-VP, SR-VP, JPS, LONDON, and MIX. The LS-VL strain was originally collected in 2000 on rose plants in Ghent (Belgium) and since then maintained on common bean (Phaseolus vulgaris, variety Prélude) in a laboratory environment [40]. This strain is known to harbour sufficient genetic diversity for studies of experimental evolution [23, 41]. The MR-VP, SR-VP, JPS, ALBINO and LONDON strains, in contrast, were collected from different greenhouses and completely devoid of any genetic variation by consistently inbreeding mothers with sons over seven generations (see Díaz-Riquelme et al. 2016 for the followed procedure) . By crossing these five different isofemale strains, a strain containing substantial genetic variation was created: the MIX strain. This was done by reciprocally crossing males and females of each of the isofemale strains: for each combination of strains, one female (last moulting stage) of strain X/Y was put together on a bean patch with three males of strain Y/X, allowing fertilisation (in case a fertilisation was unsuccessful, this
step was repeated). The resulting F1, F2, and F3 generations were again mixed in such a manner that, eventually, we obtained one mixed strain (MIX) that comprised a mixture of all isofemale strains. Stock populations of the LS-VL and MIX strain were maintained on whole common bean plants in a climate-controlled room (28.1°C ± 2.1°C) with a light regime of 16:8 LD, while stock populations of the ISO strains were maintained on bean leaf rectangles in separate, isolated incubators (28°C, 16:8 LD). Before eventually using the mite strains to initialise the experimental metapopulations, they were first synchronised. For each strain, sixty adult females were collected from the respective stock populations, placed individually on a leaf rectangle of 3.5 4.5 cm2, and put in an incubator (30°C, 16:8 LD). The females were subsequently allowed to lay eggs during 24 hours, after which they were removed and their eggs were left to develop. Freshly mated females that has reached the adult stage on day prior to mating of the F1 generation were then used to initialise the experimental metapopulations (see below). As all mites were kept under common conditions during this one generation of synchronisation, direct environmental and maternally-induced environmental effects [24] of the stock-conditions were removed.
Experimental range expansion
An experimental range expansion consisted of a linear system of populations: bean leaf squares (2 2 cm2) connected by parafilm bridges[81 cm2–cfr. [10]], placed on top of moist cotton. A metapopulation was initialised by placing ten freshly mated one-day-old adult females on the first patch (population) of this system. At this point, the metapopulation comprised only four patches. The initial population of ten females was subsequently left to settle, grow, and progressively colonise the next patch(es) in line through ambulatory dispersal. Three times a week, all patches were checked and one/two new patches were added to the system when mites had reached the second-to-last/last patch. Mites were therefore not hindered in their dispersal attempts, allowing a continuous expansion of the range. A regular food supply was secured for all populations by renewing all leaf squares in the metapopulation once every week; all one week old leaf squares were shifted aside, replacing the two-week-old squares that were put there the week before, and in their turn replaced by fresh patches. As the old patches slightly overlapped the new, mites could freely move to these new patches. Mites were left in this experimental metapopulation for approximately ten generations (80 days) during which they could gradually expand their range.
Treatments
We performed two experiments, in each of which experimental metapopulations were each time assigned to one out of t o diffe e t t eat e ts. I the fi st e pe i e t, the e e assig ed to eithe NMP o RF“ . I the NMP t eat e t efe i g to o - a ipulated populatio , e pe i e tal etapopulatio s e e i itialised using mites from the LS-VL strain. The metapopulations within this treatment thus started with a high enough amount of standing genetic variation for evolution to act on. Kin structure was not manipulated in this treatment and kin competition was therefore expected to increase towards the range edge (see introduction). In the RFS treatment sta di g fo Repla e e t F o “to k , e pe i e tal etapopulatio s e e also i itialised ith ites f o the LS-VL strain, but all adult females in the metapopulations were replaced on a weekly basis by randomly chosen, but similarly aged, females from the LS-VL stock. As a result, any spatial sorting of phenotypes was nullified and kin structure randomized and hence no longer expected to increase towards the range edge. The spatial structure (local densities) of the metapopulations within this treatment was however maintained (i.e., if x females were on a patch before the replacement, they were replaced by x females from the stock). In this first experiment, we thus compared unmanipulated, genetically diverse metapopulations (NMP treatment) with regularly reshuffled metapopulations where only effects of density-dependent dispersal remained (RFS treatment) (cf. [29]). Both treatments were replicated six times.
I the se o d e pe i e t, e pe i e tal etapopulatio s e e assig ed to eithe MIX o I“O . I the MIX t eat e t fo i tu e of i ed li es –see above), experimental metapopulations were initialised using mites from the MIX strain. This strain harboured standing genetic variation on which evolution could act. No a ipulatio s of ki st u tu e e e pe fo ed. I the I“O t eat e t fo I“Ofe ale li e , e pe i e tal metapopulations were initialised using mites from the SR-VP, JPS or LONDON isofemale strain (originally, there were also metapopulations for the MR-VP and ALBINO strain, but these experimental metapopulations collapsed very early within the experiment). These metapopulations therefore harboured no standing genetic variation for evolution to act on. As in the MIX treatment, kin structure was not manipulated. In this second experiment, we thus compared unmanipulated metapopulations (MIX treatment) with metapopulations where only condition dependency (density-dependent dispersal and kin competition) played a role (ISO treatment) [cf. [30]]. Both treatments were replicated six times (in case of ISO, two replicates (i.e., experimental range expansions) per isofemale strain were set up).
In addition to monitoring range expansions along the linear system, we quantified life history trait variation genetic variation in gene expression between core and edge populations (details in SUPPLEMENTARY MATERIAL 3, 4)
Results
First, we formalized our hypotheses by means of a highly parameterized, but simple simulation model based on spider mite life histories and relatedness-dependent dispersal reaction norms. We simulated one-dimensional range expansion during over 8-10 generations (80 days, SUPPLEMENTARY MATERIAL 1). Despite the incorporation of uncertainties regarding condition-dependent dispersal thresholds, the model predicted range expansion to proceed at a 25.9% slower mean rate when signatures of both kin competition and spatial sorting were removed, while expansion rates were only 7.4% slower when spatial sorting was prevented, but kin competition was present (Fig. 1). Thus, range expansion speed increased in our model with 21% by kin competition, but only by 1% due to spatial sorting
Fig 1. Predicted range size (last patch occupied in the linear gradient) by a highly parameterised, stochastic model simulating expansion dynamics in the experimental setup over a period of 80 days (see supplementary material 1). Overall, range expansions proceed slower when kin competition is excluded (B). Median values (indicated by the red lines) under the scenario with kin competition and spatial sorting (A) are similar to those for scenarios with kin competition but where spatial sorting is prevented (C). The s e ario No ki o petitio a d spatial sorti g ould either e odelled in the individual based models nor experimentally validated.
Second, to test this prediction we ran two parallel experiments where we started experimental range expansions with a limited amount of founders (10 females), thereby mimicking ongoing range expansion of T. urticae along a linear patchy landscape. Each replicated population invaded its respective landscape for ten generations (spanning 80 days). Two parallel experiments were conducted in which genetic diversity and relatedness were manipulated to infer the relative importance of spatial sorting and kin competition for range expansion dynamics. To specifically test for evolution during range expansion, we determined quantitative genetic differences in life-history traits between core and edge populations and measured patterns of gene expression.
Fig. 2. The four treatments of the two parallel experimental range expansion experiments. In the first experiment (upper panels), microcosms were either assigned to NMP (non-manipulated) or to RFS (reshuffling). Both these treatments harboured a relatively high amount of standing genetic variation (mites from LS-VL strain), but in RFS all adult females were regularly replaced (red crosses) by females fro the LS‐VL sto k while this was ot the ase for NMP. I the se o d experi e t lower pa els , microcosms were either assigned to MIX or to ISO. The former harboured standing genetic variation (mites from MIX strain; different isofemale lines represented by a single mite colour), but the latter did not (here only one setup with a single isofemale line represented). No reshuffling was performed in this second experiment. By the termination of the experiment, the final range size was measured as the number of occupied patches ((dashed line thus denotes variable number of patches between the fixed core and emerging edge patch).
In a first experiment, we compared the dynamics of range expansion and relevant life history traits between six replicated non-manipulated experimental range expansions (NMP) and six replicates where single adult females were randomly replaced by similar-aged females from the same stock population
(further abbreviated as RFS - Repla e e t F o “to k . The latter treatment maintains age and population structure but prevents genetic sorting, and destroys local relatedness, thus preventing both spatial sorting and kin competition. In a second parallel experiment, six replicated experimental range expansions with either depleted or substantial standing genetic variation were contrasted[28–30]. Single, different isofemale lines were used for the experiments with strongly depleted genetic variation (further abbreviated as ISO), and recombined isofemale lines were used for the genetically enriched experimental expansions (further abbreviated as MIX). The enriched populations maintain density, genetic, and phenotypic structure. In the genetically depleted lines, spatial sorting is impossible but relatedness patterns are left intact. Quantitative genetic trait variation as determined in common garden experiments did not differ among any of the lines, likely due to the dominance of plasticity [see
SUPPLEMENTARY MATERIAL 2]. Starting from the same levels of trait variation, MIX and NMP thus represent treatments where range expansions are determined by spatial sorting and putative kin interactions, ISO represents the treatment where kin structure is high but where spatial sorting is restricted, and RFS a treatment with both kin competition and spatial sorting constrained.
For each replicate, we measured range expansion dynamics and genotypic trait structure at an unprecedented level of detail. By counting the number of adult females three times per week on each of the occupied patches during the experimental range expansion, we detected a 28% lower rate of range expansion in the RFS scenario, in which kin competition and spatial sorting were constrained, versus the unconstrained NMP scenario (day × treatment interaction, F1,54.8=7.62; P=0.007; Fig. 3).
However, no statistically significant differences were found between the unconstrained MIX treatment and the ISO treatment, which inhibited spatial sorting but left kin competition intact (day × treatment interaction, F1,71.1=0.71; P=0.40). Differences in slopes were respectively 0.082 ± 0.026 SE and 0.030 ±
0.036 SE patches/day, with eventual range size matching the average model predictions. In contrast to other studies finding evolution leading to either increased[18, 29] or reduced variation among replicates[30, 31] no significant differences in the variation in spread rate were present among any of the treatments (coefficients of variation in the reached distance with 95% CI based on bootstrapping: NMP: 0.246 [0.147-0.276]; RFS: 0.2424 [0.133-0.279]; MIX: 0.279 [0.207-0.314]; INBRED: 0.220 [0.198-0.248]).
Fig 3: Observed range expansion averaged (±STDEV: coloured belt) over the six replicates per treatment,
population densities are shown along the gradient from core to edge (distance). From generation to generation, the populations advance their range (densities along the linear metapopulation).
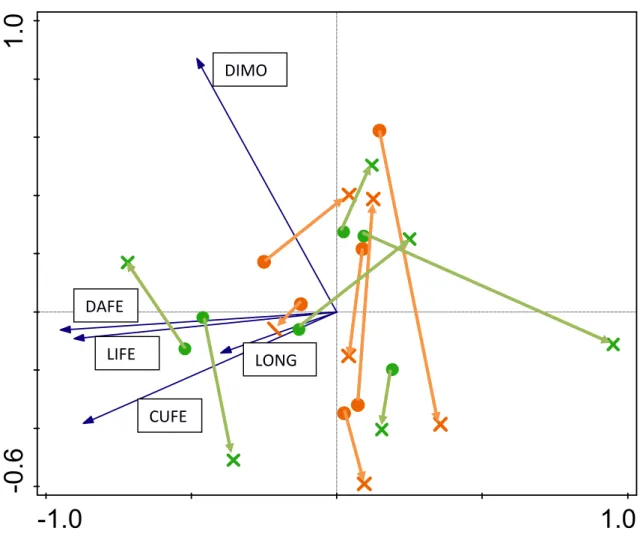
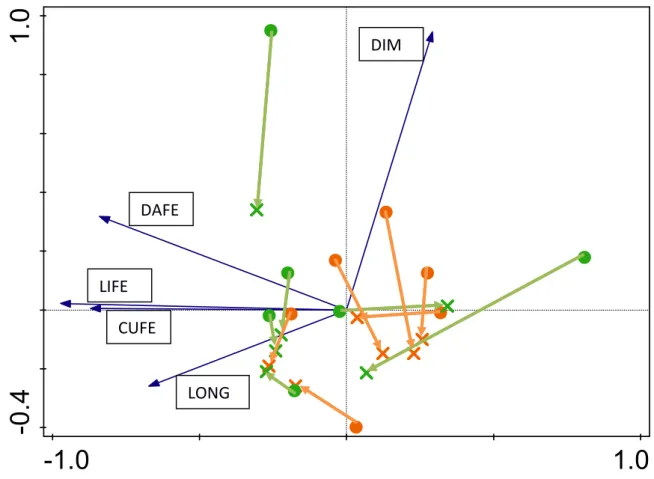
We subsequently tested whether increased range expansion resulted from evolved trait differences between edge and core populations [see SUPPLEMENTARY MATERIAL 3]. No significantly higher dispersal
rates were detected in individuals from the expanding front, relative to the ones collected from the core patches. Therefore, the accelerated range advance in the treatments with unconstrained evolutionary dynamics was achieved independently of evolutionary changes in dispersiveness. Consistent with predictions of enhanced intrinsic growth rates leading to faster range expansions and sorting of traits at the expansion front[32], we found evolved differentiation in the intrinsic growth rate. Intrinsic growth rates were systematically higher in edge relative to core populations in experiments that allowed evolutionary dynamics (NMP: F1,153=5.32, p=0.0225; MIX: F1,235=6.46, p=0.0117; See Fig. 4), but not in those where evolution was experimentally inhibited.
Fig. 4. Observed intrinsic growth rate (averaged over 6 replicates) in the two parallel range expansion
experiments. The increase in population size over time is shown for populations that were initialised with a female mite collected after 80 days originating from the core versus edge of the experimental range expansions.
Discussion
The destruction of spatial genetic structure, and thus of both kin competition and spatial sorting, resulted in a lower expansion rate than just the inhibition of spatial sorting by depleted genetic variation. In all treatments except RFS, kin competition was high due to serial founder effects following small population sizes at the initiation of the experiments. Spatial selection was not pronounced in the experimental range expansions that allowed evolution. The impact of evolved differences in growth rates on range expansions were therefore only marginal relative to the impact of eliminating the potential for kin competition. The stronger inhibition of range expansion in the RFS treatment did not result from lower levels of trait variation and can therefore only be attributed to the elimination of kin competition, and not by different evolutionary trajectories. Such phenotypic variation despite genetic depletion is probably widespread in wild populations and typically maintained by individual differences in development[33], but we can neither exclude long term intergenerational plasticity [26].
Evolved increased growth rates at the leading expansion front accord with processes of spatial selection at the expanding front and are in line with recent studies based on field observations [15, 16, 37, 38].
Systematically low densities at the range front select for increased reproduction, and such strategies are known to advance range expansion substantially[15, 16, 22, 39]. Surprisingly, we found no indications of variation in any single fitness-related trait among the different treatments. We observed significant replica*location variation in traits during experimental evolution, eventually resulting in divergent trait covariances among replicates (see SUPPLEMENTARY MATERIAL 3). Under such conditions, different life history strategies encompassing multivariate trait correlations but leading to similar high population growth rates might eventually be spatially sorted. Bootstrapping of the vital rates within replicates could however, not confirm the empirically determined higher growth rates at the leading edges (see SUPPLEMENTARY MATERIAL 3). We therefore attribute this opposing evidence from simulated
relative to observed intrinsic growth rates to the fact simulated one systematically assume invariant life trait expression during population growth, so neglecting density effects and other individual interactions. Because the interpretation of fitness should be tested under relevant, and varying realistic demographic conditions [39], our empirical assessment thus approaches realistic conditions better than theoretically composed ones.
We here can exclude heterosis as a driving mechanism leadi g to a atapult effe t and subsequent faster range expansions in the MIX treatment [32] since metapopulations were initialised with an already mixed strain instead of with separate strains that would hybridise after initialization. We neither did find differences in quantitative genetic (SUPPLEMENTARY MATERIAL 3) and transcriptomic (SUPPLEMENTARY MATERIAL 4) trait variation between the inbred, mixed, and highly diverse stock population, or between core and edge populations, again indicating the dominance of plasticity over evolution for life history trait expression in our model system. Ambulatory dispersal in mites has a
genetic basis [40] but is simultaneously highly dependent on differences in density, also those experienced in earlier generations by parents and grandparents [26] . We assessed the ites’ dispe sal behaviour under conditions that reflect the low-density conditions in Bitume’s o k [26] for which grandparental environmental conditions did not affect dispersal behaviour. The accelerated range expansion does not result from elevated densities at the front, and thus density dependency in dispersal, neither did we find evolution of increased competitive abilities through enhanced foraging efficiency or increased long-distance dispersal at the range front (SUPPLEMENTARY MATERIAL 3).
With exception of the RFS treatment, kin competition is expected to be high due to serial founder effects following small population sizes at the initiation of all experiments. Kin competition causes more [41, 42] and further dispersal [10], and is hence predicted to speed-up range expansion. Kin recognition is not restricted to animals, and has been demonstrated in several plant species as well [34–38]. Evidence for kin recognition is specifically accumulating in Arabidopsis [45], the model system used for experimental range expansions by Williams et al. [48]). They only performed a reshuffling experiment and were not able to control for potential local kin interactions. Because kin recognition is widespread and not restricted to animals, is may be a highly important but neglected driver of range expansions for a wide variety of life forms. I o t ast to Willia s et al’s o k he e so ti g a o ed a ia e i spread rate and parallel but independent experiments [18, 31] that reports higher spread rate variance, we did not detect any changes in spread rate variation. No general conclusions on the impact of spatial sorting on spread predictability can thus be made as they will likely depend on many joint ecological, evolutionary and social factors.
The obliteration of spatial genetic structure, and thus both kin competition and spatial sorting, resulted consequently in a lower expansion rate relative to experiments were only spatial sorting was prohibited
by depleting genetic variation. Our results provide the first evidence of kin competition as an overlooked but quantitatively highly significant driver of range expansions compared to spatial sorting. Emerging genetic structure and high relatedness per se along a range expansion front can thus be responsible for fast range expansions, even in the absence of substantial sorting of individual life history traits. The loss of genetic variation during range expansions and biological invasions is typically considered to be a limiting factor because it constraints the potential for local adaptation. We here show that, on the contrary, that it may actually lead to faster range expansions, impose social rescue and therefore allow population to keep pace with high rates of climate change.
Acknowledgements
This project was funded by the Fund for Scientific Research–Flanders (FWO; project G.0610.11 and G.018017N). D.B. and R.S. were supported by the FWO research network EVENET; RS by the KU Leuven Excellence Center Financing PF/2010/07. Services used in this work were provided by the Flemish Supercomputer Center (VSC), funded by Ghent University, the Hercules Foundation, and the Flemish government (Department of Economy, Science, and Innovation).
References
1. Pecl GT, Araújo MB, Bell JD, et al (2017) Biodiversity redistribution under climate change: Impacts on ecosystems and human well-being. Science (80-. ). 355:
2. Newman D, Pilson D (1997) Increased Probability of Extinction Due to Decreased Genetic Effective Population Size: Experimental Populations of Clarkia pulchella. Evolution (N Y) 51:354. doi: 10.2307/2411107
3. Nadell CD, Drescher K, Foster KR (2016) Spatial structure, cooperation and competition in biofilms. Nat Rev Microbiol 14:589–600. doi: 10.1038/nrmicro.2016.84
4. Kubisch A, Fronhofer EA, Poethke HJ, Hovestadt T (2013) Kin competition as a major driving force for invasions. Am Nat 181:700–706. doi: 10.1086/670008
5. Hamilton WD, May RM (1977) Dispersal in stable habitats. Nature 269:578–581. doi: 10.1038/269578a0 6. West SA, Pen I, Griffin AS (2002) Cooperation and competition between relatives. Science (80- ) 296:72–
75. doi: 10.1126/science.1065507
7. West SA, Griffin AS, Gardner A (2007) Evolutionary Explanations for Cooperation. Curr Biol. doi: 10.1016/j.cub.2007.06.004
8. Clobert J, Le Galliard J-F, Cote J, et al (2009) Informed dispersal, heterogeneity in animal dispersal syndromes and the dynamics of spatially structured populations. Ecol Lett 12:197–209. doi: 10.1111/j.1461-0248.2008.01267.x
9. Bonte D, Dahirel M (2017) Dispersal: A central and independent trait in life history. Oikos. doi: 10.1111/oik.03801
10. Bitume EV V., Bonte D, Ronce O, et al (2013) Density and genetic relatedness increase dispersal distance in a subsocial organism. Ecol Lett 16:430–437. doi: 10.1111/ele.12057
11. Kubisch A, Holt RD, Poethke HJ, Fronhofer EA (2014) Where am I and why? Synthesizing range biology and the eco-evolutionary dynamics of dispersal. Oikos 123:5–22. doi: 10.1111/j.1600-0706.2013.00706.x 12. Cheptou PO, Hargreaves AL, Bonte D, Jacquemyn H (2017) Adaptation to fragmentation:
Evolutionarydynamics driven by human influences. Philos Trans R Soc B Biol Sci. doi: 10.1098/rstb.2016.0037
13. Legrand D, Cote J, Fronhofer EA, et al (2017) Eco‐evolutionary dynamics in fragmented landscapes. Ecography (Cop) 40:9–25. doi: 10.1111/ecog.02537
14. Keane R, Smith LA (2002) Exotic plant invasions and the enemy release hypothesis. Trends Ecol Evol 17:164–170. doi: 10.1016/S0169-5347(02)02499-0
15. Shine R, Brown GP, Phillips BL (2011) An evolutionary process that assembles phenotypes through space rather than through time. Proc Natl Acad Sci U S A 108:5708–11. doi: 10.1073/pnas.1018989108 16. Phillips BL, Brown GP, Shine R (2010) Life-history evolution in range-shifting populations. Ecology
17. Phillips BL (2015) Evolutionary processes make invasion speed difficult to predict. Biol Invasions 17:1949–1960. doi: 10.1101/013680
18. Weiss-Lehman C, Hufbauer RA, Melbourne BA, et al (2017) Rapid trait evolution drives increased speed and variance in experimental range expansions. Nat Commun 8:14303. doi: 10.1038/ncomms14303 19. Dingle H (1978) Evolution of Insect Migration and Diapause. doi: 10.1007/978-1-4615-6941-1
20. Estoup A, Ravign V, Hufbauer R, et al (2016) Is There A Genetic Paradox of Biological Invasion? Annu Rev Ecol Evol Syst 47:51–72. doi: 10.1146/annurev-ecolsys-121415
21. Fronhofer EA, Stelz JMJM, Lutz E, et al (2014) SPATIALLY CORRELATED EXTINCTIONS SELECT FOR LESS EMIGRATION BUT LARGER DISPERSAL DISTANCES IN THE SPIDER MITE TETRANYCHUS URTICAE. Evolution (N Y) 68:1838–1844. doi: 10.1111/evo.12339
22. Van Petegem KHP, Boeye J, Stoks R, Bonte D (2016) Spatial Selection and Local Adaptation Jointly Shape Life-History Evolution during Range Expansion. Am Nat 000–000. doi: 10.1086/688666
23. De Roissart A, Wybouw N, Renault D, et al (2016) Life history evolution in response to changes in metapopulation structure in an arthropod herbivore. Funct Ecol 30:1408–1417. doi: 10.1111/1365-2435.12612
24. Macke E, Magalhaes S, Bach F, Olivieri I (2011) Experimental Evolution of Reduced Sex Ratio Adjustment Under Local Mate Competition. Science (80- ) 334:1127–1129. doi: 10.1126/science.1212177
25. Magalhães S, Fayard J, Janssen A, et al (2007) Adaptation in a spider mite population after long-term evolution on a single host plant. J Evol Biol 20:2016–2027. doi: 10.1111/j.1420-9101.2007.01365.x 26. Bitume EV V, Bonte D, Ronce O, et al (2014) Dispersal distance is influenced by parental and
grand-parental density. Proc Biol Sci 281:20141061-. doi: 10.1098/rspb.2014.1061
27. Van Petegem KHP, Pétillon J, Renault D, et al (2015) Empirically simulated spatial sorting points at fast epigenetic changes in dispersal behaviour. Evol Ecol 29:in press. doi: 10.1007/s10682-015-9756-9 28. Van Leeuwen T, Stillatus V, Tirry L (2004) Genetic analysis and cross-resistance spectrum of a
laboratory-selected chlorfenapyr resistant strain of two-spotted spider mite (Acari: Tetranychidae). Exp Appl Acarol 32:249–261. doi: 10.1023/B:APPA.0000023240.01937.6d
29. Van Leeuwen T, Vanholme B, Van Pottelberge S, et al (2008) Mitochondrial heteroplasmy and the evolution of insecticide resistance: non-Mendelian inheritance in action. Proc Natl Acad Sci U S A 105:5980–5. doi: 10.1073/pnas.0802224105
30. Díaz-Riquelme J, Zhurov V, Rioja C, et al (2016) Comparative genome-wide transcriptome analysis of Vitis vinifera responses to adapted and non-adapted strains of two-spotted spider mite, Tetranyhus urticae. BMC Genomics 17:74. doi: 10.1186/s12864-016-2401-3
31. Ochocki BM, Miller TEX, Bolker B, et al (2017) Rapid evolution of dispersal ability makes biological invasions faster and more variable. Nat Commun 8:14315. doi: 10.1038/ncomms14315
32. Wagner NK, Ochocki BM, Crawford KM, et al (2017) Genetic mixture of multiple source populations accelerates invasive range expansion. J Anim Ecol 86:21–34. doi: 10.1111/1365-2656.12567
33. Turcotte MM, Reznick DN, Hare JD (2011) The impact of rapid evolution on population dynamics in the wild: Experimental test of eco-evolutionary dynamics. Ecol Lett 14:1084–1092. doi: 10.1111/j.1461-0248.2011.01676.x
34. Williams JL, Snyder RE, Levine JM (2016) The Influence of Evolution on Population Spread through Patchy Landscapes. Am Nat 000–000. doi: 10.1086/686685
35. Burton OJ, Phillips BL, Travis JMJ (2010) Trade-offs and the evolution of life-histories during range expansion. Ecol Lett 13:1210–20. doi: 10.1111/j.1461-0248.2010.01505.x
36. Cressler CE, Bengtson S, Nelson WA (2017) Unexpected Nongenetic Individual Heterogeneity and Trait Covariance in Daphnia and Its Consequences for Ecological and Evolutionary Dynamics. Am Nat E000– E000. doi: 10.1086/691779
37. Alex Perkins T, Phillips BL, Baskett ML, Hastings A (2013) Evolution of dispersal and life history interact to drive accelerating spread of an invasive species. Ecol Lett 16:1079–1087. doi: 10.1111/ele.12136 38. Van Petegem K, Boeye J, Stoks R, Bonte D (2016) Spatial selection and local adaptation jointly shape
life-history evolution during range expansion. Am Nat. doi: 10.1101/031922
39. Bonte D, De Roissart A, Wybouw N, Van Leeuwen T (2014) Fitness maximization by dispersal: evidence from an invasion experiment. Ecology 95:3104–3111.
40. Yano S, Takafuji A (2002) Variation in the Life History Pattern of Tetranychus Urticae (Acari:
Tetranychidae) after Selection for Dispersal. Exp Appl Acarol 27:1–10. doi: 10.1023/A:1021518221031 41. Bowler DE, Benton TG (2005) Causes and consequences of animal dispersal strategies: relating individual
behaviour to spatial dynamics. Biol Rev 80:205–225. doi: 10.1017/S1464793104006645
syndromes and the dynamics of spatially structured populations. Ecol Lett 12:197–209. doi: 10.1111/j.1461-0248.2008.01267.x
43. Dudley SA, Murphy GP, File AL (2013) Kin recognition and competition in plants. Funct Ecol 27:898–906. doi: 10.1111/1365-2435.12121
44. Murphy GP, Dudley SA (2009) Kin recognition: Competition and cooperation in Impatiens (Balsaminaceae). Am J Bot 96:1990–6. doi: 10.3732/ajb.0900006
45. Biedrzycki ML, Jilany TA, Dudley SA, Bais HP (2010) Root exudates mediate kin recognition in plants. Commun Integr Biol 3:28–35. doi: 10.4161/cib.3.1.10118
46. Dudley SA, File AL (2007) Kin recognition in an annual plant. Biol Lett 3:435–8. doi: 10.1098/rsbl.2007.0232
47. Crepy MA, Casal JJ (2015) Photoreceptor-mediated kin recognition in plants. New Phytol 205:329–338. doi: 10.1111/nph.13040
48. Williams JL, Kendall BE, Levine JM (2016) Rapid evolution accelerates plant population spread in fragmented experimental landscapes. Science (80- ) 353:482 LP-485.
49. Barati R, Hejazi MJ (2015) Reproductive parameters of Tetranychus urticae (Acari: Tetranychidae) affected by neonicotinoid insecticides. Exp Appl Acarol 66:481–489. doi: 10.1007/s10493-015-9910-7 50. Cameron TC, O’Sullivan D, Reynolds A, et al (2013) Eco-evolutionary dynamics in response to selection
on life-history. Ecol Lett 16:754–763. doi: 10.1111/ele.12107
Appendices
Supplementary material 1: Details of the simulation model
Supplementary material 2: Quantitative trait variation at the onset of the experimental evolution
Supplementary material 3: Contrasting quantitative trait (co)variation between core and edge populations Supplementary material 4: Methods and results transcriptomics
Supplementary material 1: details of the model
Model parameterization and time step
At initialization, a metapopulation is created with 4 patches, each with 400 resources available. Within the first patch, 10 founding female adults are created with trait values for age of maturity, fecundity intercept, and longevity. Trait values are assigned based on earlier experimental work [22, 23] and this study. Life history trait values are sampled from Gaussian distributions at initialisation, and passed on to offspring conditional on a mutation threshold.The following trait values were assigned:
Age at maturity ~N(7.5, 0.98); Fecundity_intercept ~ N(7, 0.4); Longevity ~N(13, 1).
The basic time step in the model corresponds with a single day in the experiment and consists of a series of operations executed in the following chronological order:
1) Dispersal: adult females have the possibility to disperse one or two patches in the setup, or to remain in their current patch. Dispersal is dependent on relatedness according to earlier data reported in [10], pilot experiments in preparation of the model, and stochastically implemented as the probability of moving either one (P1) or two (P2) patches (no dispersal mortality is
implemented), where:
If relatedness <=0.38 then P1=0.12 and P2=0
If relatedness>0.38 then P1= 0.56*relatedness; P2= 0.8369–P1+ 0.33*relatedness
2) Feeding: Individuals consume resources (when resources are available in their current patch). The amount of resources consumed is drawn from a distribution following ~N(8, 0.4). The order in which individuals feed is randomized each time step.
3) Death: Individuals die under three different conditions: a) If they lack any resource reserves (starvation)
b) If they have reached an age equal to their longevity trait (natural death)
c) For juveniles, if they do not reach the age of maturity, because they fail to develop properly. To determine juvenile survival, a number is drawn from a binomial distribution following ~Bin(1, 0.95) with either the individual dying (0) or living (1).
4) Reproduction: females produce offspring based on fecundity trait and age. The number of produced offspring decreases with aging according to the linear function from [49]: Offspring~max(0, fecundity_intercept-0.45*age_as_adult).
5) Energy loss: individuals use up part of their resource reserves, depending on their current life stage. Juveniles lose a daily amount of 3.5 from their resource reserves, adults a daily amount of 7. 6) Resource dynamics forcing: In order for the dynamics to match the empirical experimental
evolution (see suppl. material 2), the metapopulation is extended every two days with new patches so that two empty patches are present at the range expansion front. The model keeps track of the entire length of the metapopulation and is built to track the dynamics as
experimentally implemented (see suppl. material 2). Replenishment of resources: Weekly renewal of available resources in patch. The total amount of resources in each patch is replenished by 400 at the end of every 7 days.
After initialization of the model, this time step was run 80 times (cf. the approximately 80-day period of the experimental part of the study).
Models were run in two phases:
One run to gain general insights into the relative impact of the treatments on changes in range
expansion. Here, we randomly assigned values for reserve-dependent dispersal and reproduction from the range 2-5.
One run with optimised reserve-dependent dispersal to fit observed data on range expansion under the control (evolutionary scenario A). The threshold for dispersal and reproduction was found to be 3, which matches empirical observations that dispersal is highly dependent on body condition. A value of 3 corresponds with the availability of reserves to survive three days of starvation. Subsequently, the optimised reserve-dependent dispersal model was run for 10 000 iterations for scenarios A-C to get output on range expansion rate and life history trait evolution. After 80 days, both the length of the metapopulation (i.e. the total number of patches in the metapopulation) and the mean life history trait values at the core and edge were recorded. To this end, individuals present in the first patch of the metapopulation (core) or in the last three occupied patches (edge) were tracked (cf. the experimental part of the study) and the mean value of every life history trait was calculated and recorded.
Detailed description of the results
Range expansion rate
The rate at which range expansion occurred was highest under the scenario A, where both relatedness and trait values where passed on to the offspring (mean expansionscenA=27.37 patches), followed by
scenario C, where only relatedness is maintained, but trait values are not (mean expansionscenC=25.16).
Slowest range expansion happened under scenario B where both relatedness and trait values were reset (mean expansionscenB = 19.76). Compared to scenario C, range expansion was accelerated by
approx. 38.5% for scenario A and approx. 27.3% for scenario B. Thus, this output suggests that the relative importance of relatedness (and associated kin avoidance) can impact range expansion more strongly than spatial selection/sorting of life history traits (rel. effect relatedness =
accele a i ce C accele a i ce A=
. %
Life history trait evolution
Differences in all recorded life history traits (fecundity, longevity, and age of maturity, see figure 2) showed very little differences under all 3 scenarios. This again corresponds with the experimental part of this study, where we found significant changes in population-level population growth rate, but where distinct evolution of individual level life history traits could not be detected. The most apparent trend in the model output is the difference in spread in trait values between scenario A and B on the one hand, and scenario C on the other hand. Given that scenario C is the only scenario where trait values are consistently reset for all offspring, this seems to indicate that significant drift occurs in scenario A and B. Strikingly, the effect of drift does not appear to differ strongly between the edge and the core, whereas it is usually argued that drift should act much stronger on populations at the edge, due to low population sizes.
References
1. Pecl GT, Araújo MB, Bell JD, et al (2017) Biodiversity redistribution under climate change: Impacts on ecosystems and human well-being. Science (80-. ). 355:
2. Newman D, Pilson D (1997) Increased Probability of Extinction Due to Decreased Genetic Effective Population Size: Experimental Populations of Clarkia pulchella. Evolution (N Y) 51:354. doi: 10.2307/2411107
3. Nadell CD, Drescher K, Foster KR (2016) Spatial structure, cooperation and competition in biofilms. Nat Rev Microbiol 14:589–600. doi: 10.1038/nrmicro.2016.84
4. Kubisch A, Fronhofer EA, Poethke HJ, Hovestadt T (2013) Kin competition as a major driving force for invasions. Am Nat 181:700–706. doi: 10.1086/670008
5. Hamilton WD, May RM (1977) Dispersal in stable habitats. Nature 269:578–581. doi: 10.1038/269578a0
6. West SA, Pen I, Griffin AS (2002) Cooperation and competition between relatives. Science (80- ) 296:72–75. doi: 10.1126/science.1065507
7. West SA, Griffin AS, Gardner A (2007) Evolutionary Explanations for Cooperation. Curr Biol. doi: 10.1016/j.cub.2007.06.004
8. Clobert J, Le Galliard J-F, Cote J, et al (2009) Informed dispersal, heterogeneity in animal dispersal syndromes and the dynamics of spatially structured populations. Ecol Lett 12:197– 209. doi: 10.1111/j.1461-0248.2008.01267.x
9. Bonte D, Dahirel M (2017) Dispersal: A central and independent trait in life history. Oikos. doi: 10.1111/oik.03801
10. Bitume EV V., Bonte D, Ronce O, et al (2013) Density and genetic relatedness increase dispersal distance in a subsocial organism. Ecol Lett 16:430–437. doi: 10.1111/ele.12057
11. Kubisch A, Holt RD, Poethke HJ, Fronhofer EA (2014) Where am I and why? Synthesizing range biology and the eco-evolutionary dynamics of dispersal. Oikos 123:5–22. doi: 10.1111/j.1600-0706.2013.00706.x
12. Cheptou PO, Hargreaves AL, Bonte D, Jacquemyn H (2017) Adaptation to fragmentation: Evolutionarydynamics driven by human influences. Philos Trans R Soc B Biol Sci. doi: 10.1098/rstb.2016.0037
13. Legrand D, Cote J, Fronhofer EA, et al (2017) Eco‐evolutionary dynamics in fragmented landscapes. Ecography (Cop) 40:9–25. doi: 10.1111/ecog.02537
14. Keane R, Smith LA (2002) Exotic plant invasions and the enemy release hypothesis. Trends Ecol Evol 17:164–170. doi: 10.1016/S0169-5347(02)02499-0
15. Shine R, Brown GP, Phillips BL (2011) An evolutionary process that assembles phenotypes through space rather than through time. Proc Natl Acad Sci U S A 108:5708–11. doi: 10.1073/pnas.1018989108
16. Phillips BL, Brown GP, Shine R (2010) Life-history evolution in range-shifting populations. Ecology 91:1617–1627. doi: 10.1890/09-0910.1
17. Phillips BL (2015) Evolutionary processes make invasion speed difficult to predict. Biol Invasions 17:1949–1960. doi: 10.1101/013680
18. Weiss-Lehman C, Hufbauer RA, Melbourne BA, et al (2017) Rapid trait evolution drives increased speed and variance in experimental range expansions. Nat Commun 8:14303. doi: 10.1038/ncomms14303
19. Dingle H (1978) Evolution of Insect Migration and Diapause. doi: 10.1007/978-1-4615-6941-1 20. Estoup A, Ravign V, Hufbauer R, et al (2016) Is There A Genetic Paradox of Biological Invasion?
Annu Rev Ecol Evol Syst 47:51–72. doi: 10.1146/annurev-ecolsys-121415
21. Fronhofer EA, Stelz JMJM, Lutz E, et al (2014) SPATIALLY CORRELATED EXTINCTIONS SELECT FOR LESS EMIGRATION BUT LARGER DISPERSAL DISTANCES IN THE SPIDER MITE TETRANYCHUS URTICAE. Evolution (N Y) 68:1838–1844. doi: 10.1111/evo.12339
22. Van Petegem KHP, Boeye J, Stoks R, Bonte D (2016) Spatial Selection and Local Adaptation Jointly Shape Life-History Evolution during Range Expansion. Am Nat 000–000. doi: 10.1086/688666
23. De Roissart A, Wybouw N, Renault D, et al (2016) Life history evolution in response to changes in metapopulation structure in an arthropod herbivore. Funct Ecol 30:1408–1417. doi:
10.1111/1365-2435.12612
24. Macke E, Magalhaes S, Bach F, Olivieri I (2011) Experimental Evolution of Reduced Sex Ratio Adjustment Under Local Mate Competition. Science (80- ) 334:1127–1129. doi:
10.1126/science.1212177
25. Magalhães S, Fayard J, Janssen A, et al (2007) Adaptation in a spider mite population after long-term evolution on a single host plant. J Evol Biol 20:2016–2027. doi:
10.1111/j.1420-9101.2007.01365.x
26. Bitume EV V, Bonte D, Ronce O, et al (2014) Dispersal distance is influenced by parental and grand-parental density. Proc Biol Sci 281:20141061-. doi: 10.1098/rspb.2014.1061
27. Van Petegem KHP, Pétillon J, Renault D, et al (2015) Empirically simulated spatial sorting points at fast epigenetic changes in dispersal behaviour. Evol Ecol 29:in press. doi: 10.1007/s10682-015-9756-9
28. Van Leeuwen T, Stillatus V, Tirry L (2004) Genetic analysis and cross-resistance spectrum of a laboratory-selected chlorfenapyr resistant strain of two-spotted spider mite (Acari:
Tetranychidae). Exp Appl Acarol 32:249–261. doi: 10.1023/B:APPA.0000023240.01937.6d 29. Van Leeuwen T, Vanholme B, Van Pottelberge S, et al (2008) Mitochondrial heteroplasmy and
the evolution of insecticide resistance: non-Mendelian inheritance in action. Proc Natl Acad Sci U S A 105:5980–5. doi: 10.1073/pnas.0802224105
analysis of Vitis vinifera responses to adapted and non-adapted strains of two-spotted spider mite, Tetranyhus urticae. BMC Genomics 17:74. doi: 10.1186/s12864-016-2401-3
31. Ochocki BM, Miller TEX, Bolker B, et al (2017) Rapid evolution of dispersal ability makes biological invasions faster and more variable. Nat Commun 8:14315. doi:
10.1038/ncomms14315
32. Wagner NK, Ochocki BM, Crawford KM, et al (2017) Genetic mixture of multiple source populations accelerates invasive range expansion. J Anim Ecol 86:21–34. doi: 10.1111/1365-2656.12567
33. Turcotte MM, Reznick DN, Hare JD (2011) The impact of rapid evolution on population
dynamics in the wild: Experimental test of eco-evolutionary dynamics. Ecol Lett 14:1084–1092. doi: 10.1111/j.1461-0248.2011.01676.x
34. Williams JL, Snyder RE, Levine JM (2016) The Influence of Evolution on Population Spread through Patchy Landscapes. Am Nat 000–000. doi: 10.1086/686685
35. Burton OJ, Phillips BL, Travis JMJ (2010) Trade-offs and the evolution of life-histories during range expansion. Ecol Lett 13:1210–20. doi: 10.1111/j.1461-0248.2010.01505.x
36. Cressler CE, Bengtson S, Nelson WA (2017) Unexpected Nongenetic Individual Heterogeneity and Trait Covariance in Daphnia and Its Consequences for Ecological and Evolutionary Dynamics. Am Nat E000–E000. doi: 10.1086/691779
37. Alex Perkins T, Phillips BL, Baskett ML, Hastings A (2013) Evolution of dispersal and life history interact to drive accelerating spread of an invasive species. Ecol Lett 16:1079–1087. doi: 10.1111/ele.12136
38. Van Petegem K, Boeye J, Stoks R, Bonte D (2016) Spatial selection and local adaptation jointly shape life-history evolution during range expansion. Am Nat. doi: 10.1101/031922
39. Bonte D, De Roissart A, Wybouw N, Van Leeuwen T (2014) Fitness maximization by dispersal: evidence from an invasion experiment. Ecology 95:3104–3111.
40. Yano S, Takafuji A (2002) Variation in the Life History Pattern of Tetranychus Urticae (Acari: Tetranychidae) after Selection for Dispersal. Exp Appl Acarol 27:1–10. doi:
10.1023/A:1021518221031
41. Bowler DE, Benton TG (2005) Causes and consequences of animal dispersal strategies: relating individual behaviour to spatial dynamics. Biol Rev 80:205–225. doi:
10.1017/S1464793104006645
42. Clobert J, Le Galliard J-F, Cote J, et al (2009) Informed dispersal, heterogeneity in animal dispersal syndromes and the dynamics of spatially structured populations. Ecol Lett 12:197– 209. doi: 10.1111/j.1461-0248.2008.01267.x
43. Dudley SA, Murphy GP, File AL (2013) Kin recognition and competition in plants. Funct Ecol 27:898–906. doi: 10.1111/1365-2435.12121
44. Murphy GP, Dudley SA (2009) Kin recognition: Competition and cooperation in Impatiens (Balsaminaceae). Am J Bot 96:1990–6. doi: 10.3732/ajb.0900006
45. Biedrzycki ML, Jilany TA, Dudley SA, Bais HP (2010) Root exudates mediate kin recognition in plants. Commun Integr Biol 3:28–35. doi: 10.4161/cib.3.1.10118
46. Dudley SA, File AL (2007) Kin recognition in an annual plant. Biol Lett 3:435–8. doi: 10.1098/rsbl.2007.0232
47. Crepy MA, Casal JJ (2015) Photoreceptor-mediated kin recognition in plants. New Phytol 205:329–338. doi: 10.1111/nph.13040
48. Williams JL, Kendall BE, Levine JM (2016) Rapid evolution accelerates plant population spread in fragmented experimental landscapes. Science (80- ) 353:482 LP-485.
49. Barati R, Hejazi MJ (2015) Reproductive parameters of Tetranychus urticae (Acari: Tetranychidae) affected by neonicotinoid insecticides. Exp Appl Acarol 66:481–489. doi: 10.1007/s10493-015-9910-7
50. Cameron TC, O’Sullivan D, Reynolds A, et al (2013) Eco-evolutionary dynamics in response to selection on life-history. Ecol Lett 16:754–763. doi: 10.1111/ele.12107
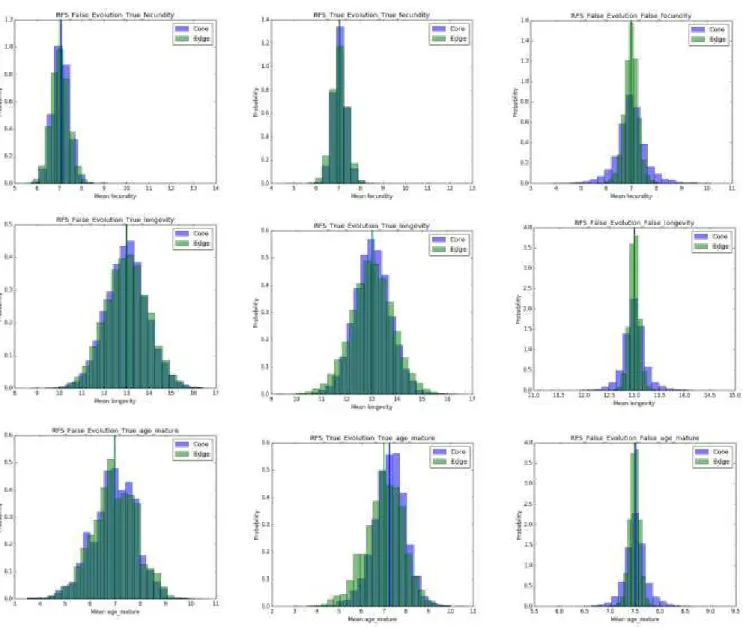
Figure S1.1: Model output of life history trait evolution (as histograms of mean trait values at core and edge). First row = Mean fecundity, Second row = mean longevity and third row = mean age of maturity. Left column = scenario A, middle column = scenario B, right column = scenario C. Blue bins represent population from core, green bins from the edge of the metapopulation. Full blue and green lines represent mean values over all 10000 simulations for core and edge respectively.
Supplementary material 2: Quantitative trait variation at the onset of
the experimental evolution
Methods: We collected mites, in the same way as for the the experimental metapopulations,
from the inbred (
ISOF,
ISOJ,
ISOS), mixed (
MIX), and stock lines (
STOCKLSVL). Mites were placed
in groups of five on a bean leaf square of 3.5 4.5 cm
2and put in an incubator (30°C, 16:8 LD).
The females were subsequently allowed to lay eggs during 24 hours, after which they were
removed and their eggs were left to develop. The resulting synchronised freshly (inbred) mated
one-day-old adult females of the F1 generation were used for the quantification of the
following traits for single females: mean ambulatory dispersal distance, intrinsic rate of increase
(r), egg survival, juvenile survival, development time, sex ratio, adult size, and lifetime fecundity.
Since all mites were reared under common conditions during this one generation of
synchronisation, direct environmental and environmentally-induced maternal effects are
removed. For longevity and fecundity, dam components of the overall variation could be
estimated through mixed modelling. We quantified coefficients of variation (CV) for all traits
and interpreted this as the level of standing phenotypic trait variation.
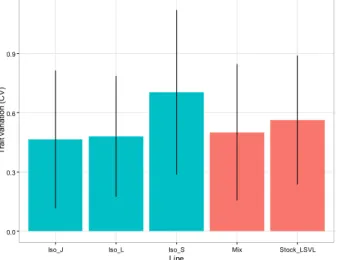
Results: No differences in CV for trait variation could be detected across traits for each of the
used lines (see figure X.1; ANOVA: F
4,43=0.71; P=0.59). For the separate traits, consistent
variation was not detected either (Table X.1). Overall, isofemale line S was characterised by the
highest level of standing phenotypic variation prior to the experimental evolution. Egg survival,
juvenile survival, development time, and lifetime fecundity we measured at the individual level
for multiple offspring from a single dam and variance could be partitioned among and within
dams. Using a full-sib design, we estimated the dam component of the explained variation of
lifetime fecundity as 0.15 in the stock-
LSVL, 0.45 in the mix, and 0 in all isofemale lines. The dam
component of longevity was lower with 0.18 in the stock-
LSVL,
0.03
in the
MIX,
and 0 in all
isofemale lines. According to our expectations, phenotypic variation among relative to within
dams was thus highly reduced in the isofemale lines.
Figure S3.1: Genetic trait variation averaged
across all traits for the different used lines.
Table S3.1: overview of mean values,
standard deviation (SD) and coefficient of variation (CV) for each of the measured traits in the
different lines.
Trait Line Mean SD CV
Adult female size (contour) MIX 117228.8 9063.099 0.077311 ISO_J 97173.38 11826.55 0.121706 ISO_L 102027.6 7826.355 0.076708 ISO_S 94045.09 14011.69 0.148989 0.0 0.3 0.6 0.9
Iso_J Iso_L Iso_S Mix Stock_LSVL
Line T ra it var ia ti o n ( C V )
Stock LSVL 125620.5 11207.21 0.089215 Mean distance MIX 1.5 1.322876 0.881917 ISO_J 0.402778 0.21606 0.536426 ISO_L 1.5 0.707107 0.471405 ISO_S 1.033333 0.895669 0.866776 Stock LSVL 1.146032 0.853232 0.681274 Egg survival MIX 0.6889 0.457761 0.66448
ISO_J 0.9452 0.408383 0.43206 ISO_L 0.8966 0.500515 0.558237 ISO_S 0.8077 0.684012 0.846863 Stock LSVL 0.8807 0.4534 0.514818 Juvenile survival MIX 0.8387 0.361826 0.431412 ISO_J 0.942 0.40472 0.429639 ISO_L 0.8846 0.520396 0.588284 ISO_S 0.8413 0.6624 0.787353 Stock LSVL 0.9533 0.410599 0.430713 Female development (days) MIX 18.0714 2.404182 0.133038 ISO_J 20.0889 3.05207 0.151928 ISO_L 17.9744 3.279309 0.182443 ISO_S 18.3333 4.468021 0.243711 Stock LSVL 16.422 2.0766 0.126452 Male development (days) MIX 16.4167 1.187352 0.072326 ISO_J 18.2 3.511726 0.192952 ISO_L 17.1333 2.867332 0.167354 ISO_S 17.5 2.776672 0.158667 Stock LSVL 15.7053 2.653 0.168924 Lifetime fecundity MIX 39.1667 26.791 0.684025 ISO_J 43.8333 37.8885 0.864377 ISO_L 43.5 37.8885 0.871 ISO_S 41.4 41.5045 1.002524 Stock LSVL 41.2167 34.58428 0.839084 Intrinsic growth rate MIX 44.33333 25.59427 0.577314 ISO_J 35.25 10.27538 0.2915 ISO_L 56.25 25.34265 0.450536 ISO_S 32.66667 32.25937 0.987532 Stock LSVL 35.42857 25.38654 0.716555 Sex ratio (proportion males) MIX 0.3333 0.33 0.990099 ISO_J 0.3077 0.357526 1.161931 ISO_L 0.4167 0.397494 0.95391 ISO_S 0.4 0.517148 1.292871 Stock LSVL 0.3909 0.45 1.15119