HAL Id: hal-02091016
https://hal-amu.archives-ouvertes.fr/hal-02091016
Submitted on 5 Apr 2019
HAL is a multi-disciplinary open access archive for the deposit and dissemination of sci-entific research documents, whether they are pub-lished or not. The documents may come from teaching and research institutions in France or abroad, or from public or private research centers.
L’archive ouverte pluridisciplinaire HAL, est destinée au dépôt et à la diffusion de documents scientifiques de niveau recherche, publiés ou non, émanant des établissements d’enseignement et de recherche français ou étrangers, des laboratoires publics ou privés.
Compositional turnover and variation in Eemian pollen
sequences in Europe
Vivian Felde, Suzette Flantua, Cathy Jenks, Blas Benito, Jacques-Louis de
Beaulieu, Petr Kuneš, Donatella Magri, Dorota Nalepka, Bjørg
Risebrobakken, Cajo ter Braak, et al.
To cite this version:
Vivian Felde, Suzette Flantua, Cathy Jenks, Blas Benito, Jacques-Louis de Beaulieu, et al.. Compo-sitional turnover and variation in Eemian pollen sequences in Europe. Vegetation History and Ar-chaeobotany, Springer Verlag, 2020, 29 (1), pp.101-109. �10.1007/s00334-019-00726-5�. �hal-02091016�
10.1007/s00334-019-00726-5
Compositional turnover and variation in Eemian pollen sequences
in Europe
Vivian A. Felde1,22 · Suzette G. A. Flantua1 · Cathy R. Jenks1 · Blas M. Benito1 · Jacques‑Louis de Beaulieu2 ·
Petr Kuneš3 · Donatella Magri4 · Dorota Nalepka5 · Bjørg Risebrobakken6 · Cajo J. F. ter Braak7 ·
Judy R. M. Allen8 · Wojciech Granoszewski9 · Karin F. Helmens10 · Brian Huntley8 · Ona Kondratienė11 ·
Laimdota Kalniņa12 · Mirosława Kupryjanowicz13 · Małgorzata Malkiewicz14 · Alice M. Milner15 ·
Małgorzata Nita16 · Bożena Noryśkiewicz17 · Irena A. Pidek18 · Maurice Reille2 · J. Sakari Salonen19 ·
Vaida Šeirienė11 · Hanna Winter20 · Polychronis C. Tzedakis21 · H. John B. Birks1,21,22
Abstract
The Eemian interglacial represents a natural experiment on how past vegetation with negligible human impact responded to amplified temperature changes compared to the Holocene. Here, we assemble 47 carefully selected Eemian pollen sequences from Europe to explore geographical patterns of (1) total compositional turnover and total variation for each sequence and (2) stratigraphical turnover between samples within each sequence using detrended canonical correspondence analysis, multivariate regression trees, and principal curves. Our synthesis shows that turnover and variation are highest in central Europe (47–55°N), low in southern Europe (south of 45°N), and lowest in the north (above 60°N). These results provide a basis for developing hypotheses about causes of vegetation change during the Eemian and their possible drivers.
Keywords Detrended canonical correspondence analysis · Extrinsic and intrinsic processes · Inertia · Last interglacial
dataset · Multivariate regression trees · Neutral processes · Principal curves
Introduction
The last interglacial (Eemian, c. 129–116 ka ago) is the most extensively studied pre-Holocene stage of the Quaternary (Tzedakis 2007a). It is characterised during its early part by a strong summer insolation anomaly, peak global mean sur-face air temperatures of ~ 1 °C above pre-industrial values, reaching 3–11 °C in the Arctic (Fischer et al. 2018), and by a peak sea-level of 6–9 m above present (Dutton et al. 2015).
The duration of the last interglacial represents the interval of reduced ice volume, demarcated at its onset by degla-ciation and at its close by glacial inception (Tzedakis et al.
2012) and is broadly equivalent to Marine Isotope sub-Stage 5e (~ 132–116 ka) and the Eemian interglacial of north-west Europe (Kukla et al. 2002). The term Eemian was intro-duced by Harting (1874) to describe a subsoil characterised by warm marine molluscs in the Eem valley near Amers-foort in The Netherlands (Tzedakis 2007a). Integrated palaeoceanographic and pollen analyses from the Portuguese margin show that the marine isotopic and terrestrial stage boundaries are not synchronous, with the interval of tem-perate forest conditions extending from ~ 129 to ~ 111 ka (Shackleton et al. 2003; Tzedakis et al. 2018). Here we use the term ‘Eemian’ informally to refer to the forested interval (protocratic, mesocratic, and oligocratic/telocratic phases—see Fig. 1a) in last interglacial pollen sequences across Europe. While the long duration (~ 18,000 years) of the forest interval in southern Europe is supported by inde-pendent chronologies (Brauer et al. 2007), a shorter duration (~ 11,000 years) has generally been applied to north-central European pollen sequences on the basis of a partially annu-ally laminated record at Bispingen, Germany at 53°N (Mül-ler 1974). However, recent joint palaeoceanographic pollen
Communicated by F. Bittmann.
Electronic supplementary material
https ://doi.org/10.1007/s0033 4-019-00726 -5
* Vivian A. Felde [email protected]
analyses from the Bay of Biscay (Sánchez Goñi et al. 2012) and comparisons with pollen sequences in southern France and southern Germany indicate a long Eemian duration (~ 18,000 years) at least as far north as 48°N. It is possible that the unlaminated upper part of the Bispingen sequence represents a longer time interval than presently assumed and that the duration of the forested interval in northern Germany was approximately as long as farther south. In the absence of any independent chronology and duration esti-mates, the length of the Eemian in Fennoscandia remains unclear.
Ever since the pioneering studies in Denmark and Ger-many by Jessen and Milthers (1928), many Eemian pollen sequences have been analysed, focussing mainly on sedi-mentary settings, stratigraphies, pollen assemblages, vegeta-tion histories, dating, and climate (e.g. Zagwijn 1996; Kühl
2003; Tzedakis 2007a). Eemian pollen records present a val-uable opportunity to study vegetation patterns across broad spatial and temporal scales without extensive human impact
(Kühl 2003; Tzedakis 2007a; Milner et al. 2013). Ecologi-cal questions abound about the Eemian. For example, are Eemian inferred vegetation patterns similar to Holocene patterns prior to human influence? How similar are Eemian pollen stratigraphies across Europe? Are there consistent temporal patterns in the appearance, expansion, and decline of major arboreal taxa across Europe? What are the spatial variations in pollen compositional change (“turnover”) and total variation across Europe?
To answer such questions and to study vegetation pat-terns and trends during the Eemian in Europe, we compile an Eemian dataset based on 47 representative pollen sequences. Here, we consider what the spatial patterns are in pollen turnover and total variation across Europe. We use compo-sitional turnover and variation to estimate change in pollen-assemblage composition over time and space (Andersen
1994; Birks and Birks 2004; Birks 2007). With these explor-ative analyses presented here, we address the following two questions. (Q1) How does compositional turnover change within Eemian pollen sequences? (Q2) What are the spatial variations in total pollen compositional turnover and total variation across Europe?
As the concept of turnover is rarely used in pollen analy-sis (see Birks 2007), we summarise what this concept is. In community ecology, turnover is used to describe and pos-sibly to quantify the replacement of one species by another in an assemblage in space or time or both. In pollen analy-sis, turnover is used to refer to the amount of compositional change of all pollen taxa within a stratigraphical sequence, namely along a temporal gradient (Birks 2007). Although the concept of turnover is widely used in ecology (e.g. Baselga 2010; Descombes et al. 2017) and biogeography (e.g. Buckley and Jetz 2008), little appears to be known about how turnover within an assemblage changes with time (e.g. Jarzyna et al. 2014). Pollen sequences provide a means of studying biotic turnover over long time peri-ods. We use compositional turnover (one type of β-diversity
sensu Anderson et al. 2011) as estimates of change in pollen-assemblage composition along the temporal gradient in a pollen sequence. This is “directional turnover” (Anderson et al. 2011) or “compositional gradient length” (Tuomisto
2010). We avoid referring to β-diversity because it now has so many meanings (e.g. Tuomisto 2010; Anderson et al.
2011) in ecology, biogeography, and palaeoecology. Variation in pollen-stratigraphical data is simply the total amount of variation in a sequence. In the case of linear-based methods of data-analysis (ter Braak and Prentice
1988), it is estimated by the classical variance statistic. In non-linear unimodal-based methods (ter Braak and Prentice
1988), as here, it is estimated as total inertia (Šmilauer and Lepš 2014). There are many causes of variation in a pol-len sequence, for example stratigraphical changes, inherent statistical variation in pollen counts, and differential pollen
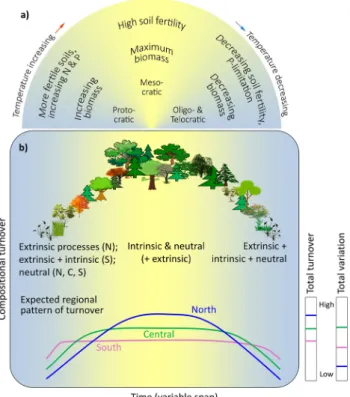
Fig. 1 Hypothetical responses of an ecosystem in the last interglacial (Eemian) in terms of biomass and fertility (modified from Birks and Birks 2004). a The three phases of Eemian vegetation history, namely protocratic, mesocratic, and oligocratic plus telocratic, in response to changing temperature (outer arc). b Hypothetical model of com-positional change (turnover) within an Eemian pollen sequence with expected patterns of turnover in each geographical region and an indi-cation of total palynological turnover and total palynological varia-tion expected in north (above 60°N), central (45–60°N), and south (below 45°N) Europe. The turnover axis can be, for example, an ordi-nation axis
preservation in different sediment types within sequences (see Maher et al. 2012).
Based on previous studies of vegetation development during interglacials spanning part of one precession cycle (e.g. Andersen 1994; Birks and Birks 2004; Tzedakis 2007b; Helmens 2014), we expect all sequences to show a gener-ally unimodal pattern of compositional change or turnover within the Eemian reflecting the protocratic, mesocratic, and oligocratic plus telocratic phases (Q1, Fig. 1a). Additionally, we predict the total amount of turnover to have been high-est in northern Europe, intermediate in central, and low-est in southern Europe, whereas total variation may have been highest in central Europe and lowest in the north (Q2, Fig. 1b). These hypotheses are based on the assumption that a different mix of extrinsic, intrinsic, and neutral processes play out in the different regions. At the beginning of the Eemian, most taxa would have already been present in the south and compositional change was likely driven primarily by extrinsic and/or intrinsic processes (sensu Williams et al.
2011a), such as climatic shifts, competition, and facilitation, along with neutral processes such as historical legacies and location of glacial-stage refugia (Jackson and Blois 2015). In the north, turnover may reflect species spread as driven by extrinsic and neutral processes. In the mesocratic phase, changes in all regions may have been a result primarily of intrinsic and neutral processes (e.g. Iversen 1960; Birks
1986) with some extrinsic processes, whereas changes in the oligocratic/telocratic phase may have been driven by an interaction of extrinsic, intrinsic, and neutral processes (e.g. Wardle et al. 2008).
Dataset and methods
Answering the two questions above (Q1, Q2) requires three major components—(1) representative Eemian pollen data across Europe, (2) critical screening to ensure they lack pre- or post-Eemian pollen spectra or hiatuses, are of comparable analytical standard, and have a consistent pollen nomencla-ture, and (3) robust numerical tools for consistent data analy-sis. Here we describe the methodology followed to address these components. See Electronic Supplementary Materials (ESM) 1 for details of the numerical methods and software.
Compiling a European Eemian pollen
dataset
We implemented four criteria to select Eemian pollen sequences from different sources, including Pangaea, the European Pollen Database, and the Polish Pleistocene Pol-len Database (Kupryjanowicz et al. 2018) (see ESM 2 for details). These criteria are (1) they must cover the entire
Eemian and display signals of protocratic, mesocratic, and oligocratic/telocratic phases of an interglacial, allowing for differences in how these phases are reflected in different parts of Europe (Birks 1986); (2) the sequences must have at least 15 analysed samples; (3) there must be no clear evi-dence for any major hiatuses; and (4) the sequences should have consistent pollen identifications of reasonable analyti-cal standard. For sequences in geographianalyti-cally critianalyti-cal areas with few complete Eemian sequences and the primary data no longer available, published Eemian diagrams were dig-itised. Pollen values are expressed as percentages of total pollen excluding pollen of aquatics and all spores.
Because samples in sequences are in stratigraphical order, numerical analysis should, when appropriate, take account of this data-property and be constrained by sample order. Ideally, this constraint should be sample age but age esti-mates are not available for almost all Eemian sequences. In the absence of age estimates, we have used depth which reflects sample order within a sequence. Birks (2007) dis-cusses using either age or depth as an external constraint in the ordination of Holocene sequences and obtains almost identical results irrespective of the type of constraint imposed.
As in any quantitative pollen-analytical study, there are palynological and numerical assumptions behind our study. There are nine major assumptions: five are palynological and four are numerical. The palynological assumptions are: 1. all the sequences are Eemian, are complete with no dis-cernible hiatuses, and have roughly constant or at least monotonic sediment accumulation rates.
2. a minimum number of 15 samples in a sequence is ade-quate to assess variability and turnover (our numbers of samples range from 16 to 213; mean = 60; median = 52). 3. pollen taxonomy is of a comparable and consistent standard for all sequences, with all major non-arboreal taxa identified and recorded for each sequence (our taxa range from 13 to 99; mean = 48; median = 47).
4. in the absence of independent chronologies from north-ern Europe, we assume that the duration of the forested interval across Europe was approximately similar. The numerical assumptions are:
1. detrended canonical correspondence analysis (DCCA) provides robust estimates of turnover and variation (see also ESM 1)
2. multivariate regression trees (MRT) and associated cross-validation are robust in identifying the optimal partition tree, even with small numbers of samples (Simpson and Birks 2012) and hence in accessing the amount of palynological variation in a sequence (see ESM 1)
3. the numerical results are not overly affected by pollen-count size and hence number of taxa.
4. the numerical results are not overly affected by the num-ber of samples in a sequence.
These assumptions are discussed and assessed more fully in ESM 3.
Estimating compositional turnover
within each sequence and total turnover
for each pollen sequence
Compositional turnover is estimated using DCCA con-strained by depth (or order) plus depth2 (Birks 2007; ter
Braak and Šmilauer 2012) and principal curves (PCs) (Simp-son and Birks 2012). DCCA directly scales variables’ (in our case pollen taxa) ordination scores such that their average
within-sample standard deviation is unity along the ordina-tion axes which are here constrained by sample depth or order. The change in weighted average (WA) sample scores (CaseR sensu ter Braak and Šmilauer 2012) reflects com-positional change or turnover in standard deviation (SD) units. PCs are more “neutral” than DCCA in that they make fewer assumptions of the data than DCCA does. In the PC approach, a PC is fitted to the entire Eemian dataset of 2,840 samples. Sample locations along the final PC are determined and scaled to 0–1. Maximum difference of sample scores within a sequence is a relative turnover measure (Simpson and Birks 2012). For each sequence, total compositional turnover is estimated and within each sequence we explore patterns of turnover. Emphasis here is placed on the DCCA results for both total turnover and changes within a sequence because they are expressed in ecologically interpretable SD units of taxon turnover (Figs. 2, 3; ESM 4). The PC results for total turnover are summarised in Fig. 3b.
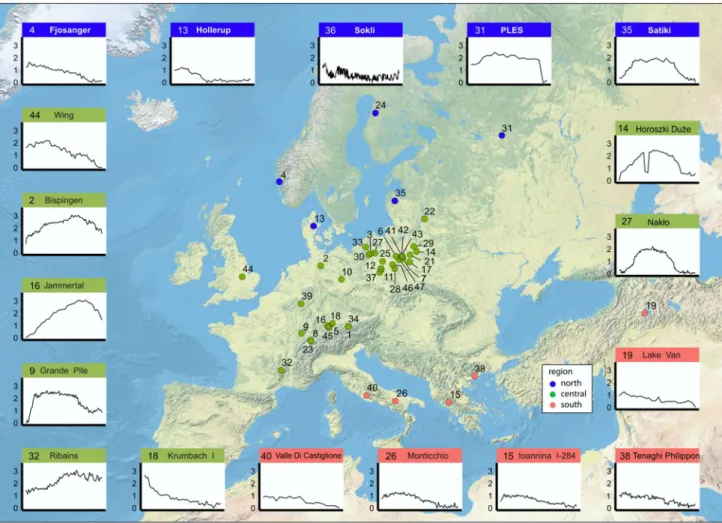
Fig. 2 Map of the 47 analysed Eemian pollen sequences and indi-vidual sample scores (standard deviation units) of selected detrended canonical correspondence analysis (DCCA) axis 1 plots for 18 sequences (the remaining 29 sequences are in ESM 8). Colours of locations indicate assigned region (blue = north; green = central;
salmon = south). The number at each location corresponds with sequence numbers in ESM 2. The sample scores are plotted with the oldest (bottom) at the far left and the youngest (top) at the far right. The individual sample scores are weighted averages of the response (pollen taxa) variable scores (also applies to ESM 8)
Estimating total variation for a sequence
Two contrasting numerical approaches are used to esti-mate total variation for each sequence: (1) total inertia (= weighted variance) estimated by correspondence analysis for each sequence in the absence of any external constraints (ter Braak and Šmilauer 2012) and (2) sequence partition-ing uspartition-ing multivariate regression trees (MRTs) (Simpson and Birks 2012) and cross-validation to estimate the optimal number of partitions (“zone boundaries”). Optimal partition number depends on the number of samples in a sequence. We thus express the number of optimal partitions as a pro-portion of the number of samples. This reflects the amount of palynological variation within a sequence. Estimates of variation are summarised in Fig. 3c, d and ESM 4.Results
We assemble 47 suitable sequences from 14 countries grouped into three regions (above 60°N, 45–60°N, below 45°N; Fig. 2; ESM 2). Full analytical results are given in ESM 4–7. The sequences range from 16 to 213 samples and 13–99 pollen taxa after basic taxonomic harmonisation. The dataset is chosen to cover as much of Europe as possible and to contain representative (but not all) Eemian sequences from Europe. Some areas, however, have many more Eemian
sequences than others (e.g. N Germany and Poland com-pared with Scandinavia).
There is a distinct temporal pattern of compositional change within each sequence over geographical space dis-played by the individual sample scores (SD units) on DCCA axis 1 (Figs. 2, 3; ESM 8). The observed patterns naturally reflect site-specific changes, but it is possible to identify two general patterns where the DCCA sample values show either a gradually changing linear trend or a unimodal pat-tern where it reaches a peak and then slowly declines. Of the 31 sequences with a unimodal pattern, 27 occur in cen-tral Europe. Four northern sequences show a unimodal pat-tern and no southern sequence shows such a patpat-tern. Linear trends are found in all regions (3 in northern, 8 in central, 5 in southern Europe) (Fig. 2; ESM 8, 9).
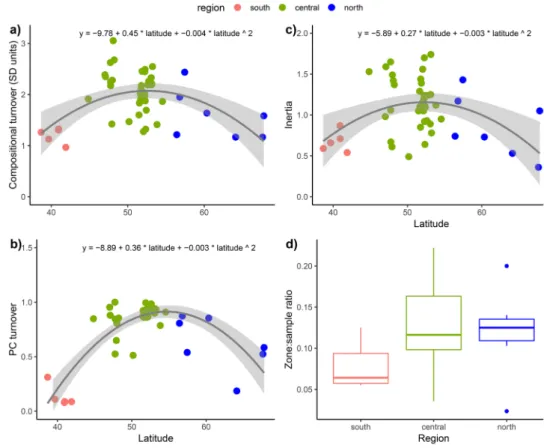
The greatest Eemian turnover and variation are in central Europe, whereas the southern and northern regions show less change (Fig. 3; ESM 8, 9). Total compositional turnover (DCCA, Fig. 3a; PC, Fig. 3b) and inertia (weighted vari-ance) (Fig. 3c) have peaks between 47 and 55°N. Lowest values are above 60°N and are low south of 45°N. In con-trast, the proportion of optimal partitions has highest values in central and north Europe (Fig. 3d). The null hypothesis that the mean change in optimal partitions does not differ between regions is not rejected. An analysis of variance indicates a probability > 0.05 that the null hypothesis is true (F = 2.575, p = 0.088).
Fig. 3 Total compositional turnover in each sequence plot-ted against latitude estimaplot-ted by
a detrended canonical
cor-respondence analysis (DCCA; in standard deviation units) and b principal curves (PC; proportional distance); c total inertia or variation for each sequence estimated by DCCA; and d the proportions of optimal partitions to total number of samples in a sequence for each region. The fitted lines in a, b, and c are a fitted generalised linear model with a Gaussian distribution with a second-order polynomial (grey shading is the 95% confidence interval). The DCCA-based turnover for each sequence is estimated as the range in sample scores (weighted averages of the taxon scores) within the sequence
Discussion
We compiled an Eemian pollen sequence dataset from across Europe, based on a set of predefined criteria and assumptions, to explore the magnitude of compositional turnover and total variation in Eemian pollen sequences. We show that there is substantial spatial variation in both variables, presumably reflecting responsiveness to vari-ous degrees of extrinsic, intrinsic, and neutral processes at local and regional scales during the Eemian (Birks 1986; Williams et al. 2011a; Jackson and Blois 2015).
Our Eemian dataset shows that there are important geo-graphical voids of complete Eemian pollen sequences— none in Ireland and Iberia, few in Britain and France, and, not surprisingly, very few in much of Scandinavia that was heavily glaciated after the Eemian. Studies focussing on interglacial dynamics in comparison to the Holocene would benefit from a better geographical coverage of Eemian sequences to assess all vegetation types and cli-mate conditions of the continent.
Pollen sequences in central Europe display the expected unimodal pattern (Fig. 2), but surprisingly, several sequences from across Europe, especially in the north and the south, show a gradually changing linear trend (cf. Fig. 1b). Less palynological change in the south and the north (Fig. 3) could imply that the taxa are shifting abun-dances between a few equally abundant taxa, thereby dis-playing a gradual changing pattern of turnover instead of a unimodal pattern (Q1).
We show that the greatest Eemian variation and turno-ver are in central Europe (Fig. 3), whereas there are fewer compositional changes in the southern and the northern regions (Q2). This is only partly consistent with the prior expectation of a unimodal trend in turnover during the entire Eemian (Fig. 1b). One possible explanation for the greatest change in central Europe is that during the Eemian there was a great variety and replacement of forest trees and shrubs (e.g. Carpinus, Corylus, Quercus, Taxus, Tilia,
Ulmus) contributing to the regional pollen deposition,
thereby providing a greater potential for palynological compositional turnover to be detected by a technique such as DCCA. Such pollen taxa have high N2 values where N2 (ter Braak and Verdonschot 1995) is the effective num-ber of occurrences of a given taxon. DCCA is based on weighted averages, and N2 is effectively determined by taxa with high abundances (ter Braak and Verdonschot
1995).
An alternative and more convincing hypothesis to explain differences between the predicted (Fig. 1b) and observed (Figs. 2, 3; ESM 8, 9) patterns is that in south-ern Europe many taxa were already present at the onset of the Eemian (Bennett et al. 1991; Tzedakis et al. 2013).
The observed pollen-stratigraphical changes there may be mostly a result of intrinsic processes such as facilitation and competition between species and of neutral processes leading to a gradual shift from a landscape dominated by evergreen sclerophyll and deciduous-Quercus and Ulmus to a vegetation with later expansion of Carpinus, Ostrya, and Abies into locally favourable habitats. Such changes may be recorded palynologically as relatively low turnover (Fig. 3).
An additional related hypothesis for the observed con-trasting patterns in southern and central Europe (Fig. 3; ESM 8, 9) involves a detailed consideration of the pol-len records. While a number of southern European polpol-len sequences show a pattern of early, middle, and late expand-ing taxa not dissimilar to that of central Europe (Tzedakis et al. 2001), the main taxa (e.g. deciduous-Quercus, Ulmus) tend to persist through most of the Eemian with later expan-sions of Carpinus, Ostrya, and Abies superimposed on the existing assemblages. In central Europe, by comparison, there is a replacement of the early dominant taxa by later arrivals (similar to a relay), leading to a more accentuated and greater turnover. These patterns (relay vs expansion plus persistence of early taxa) may reflect climate differences. As climate shifted towards cooler temperatures during the course of the Eemian (Fig. 1a), the early thermophilous taxa may have declined in central Europe, while in the south, temperature (and precipitation) may not have become limit-ing, allowing the persistence of these taxa (e.g. Bennett et al.
1991), resulting in reduced turnover and variation.
The low palynological turnover and variation in northern Europe (Fig. 3) may reflect the relatively low pollen richness with few abundant taxa of restricted competitive abilities, especially trees, in the Eemian. The restricted arboreal flora may simply have been a result of climatic limitations. The detailed study at Sokli in northern Finland (Salonen et al.
2018) suggests, however, that thermophilous taxa such as
Corylus were present and persisted in the north until the
close of the Eemian, perhaps because of a major decrease in seasonality in the late Eemian with increase in winter insolation.
An alternative, more general and simpler hypothesis (and hence more attractive) for the observed patterns in turnover is ‘silent palynological turnover’. North of the Alps today there are only two native Quercus species, one native Pinus species, one native Abies species, and one native Juniperus species. In contrast, in southern Europe all of these genera comprise several, if not many (e.g.
Quercus), species. The pollen, however, of the various
species within these genera cannot generally be distin-guished. This pollen species-morphological limitation may result in compositional turnover at the species level not being detected palynologically. In central and north-ern Europe with only one or two species in these genera,
turnover is at or near the species level and is thus more visible palynologically. Such silent turnover could thus contribute, at least in part, to the observed patterns within Europe as a whole (Fig. 3; ESM 8, 9). It also suggests that the apparent persistence of some genera in southern European sequences may result in a potentially misleading record of the amount of ecological turnover that actually took place during the Eemian.
The hypothetical model of turnover and variation (Fig. 1b) is largely refuted by the patterns detected in this study (Fig. 3; ESM 8, 9). The contrasting hypotheses as explanations for the observed patterns highlight how much there is to be discovered about the palaeoecology and veg-etation dynamics of the Eemian.
The DCCA compositional turnover for the Eemian is higher than for the Holocene (11 ka) in over 40 sites in Scandinavia and Britain (Birks, unpublished data; Birks
2007). Future studies include extending the geographical coverage of Holocene turnover estimates into central and southern Europe so as to compare Eemian and Holocene turnover for nearby sites.
Conclusions
We have compiled a dataset of 47 representative Eemian pollen sequences from across Europe. We have consist-ently analysed the sequences using multivariate numeri-cal methods to estimate total pollen compositional change (turnover) and total variation for each sequence and to explore how turnover changes within each sequence and between sequences. The turnover and variation estimates show coherent but unexpected geographical and temporal patterns. They provide a basis for developing hypotheses about palynological changes during the Eemian and their possible causes. This demonstration that numerical analy-sis of our Eemian dataset produces robust and ecologi-cally interpretable patterns gives confidence in our dataset. Further questions about Eemian vegetation dynamics and history will be explored using this dataset in subsequent studies.
Acknowledgements We thank Konrad Wolowski for granting us access to the Polish Pleistocene Pollen Database. We are also very grateful to the European Pollen Database (http://www.europ eanpo llend ataba se.net/) and the invaluable work of the EPD data contributors and the EPD community for making EPD data publicly available. HJBB is indebted to Hilary Birks for many valuable discussions. HJBB, SGAF, and CRJ are supported by the ERC Advanced Grant 741413 Humans on Planet Earth (HOPE). VAF is supported by IGNEX-eco (6166) funded by VISTA—a basic research program in collaboration between The Norwegian Academy of Science and Letters, and Equinor; BB and BR are supported by NFR project IGNEX (249894). This paper is a contribution to the IGNEX and IGNEX-eco projects.
References
Andersen ST (1994) History of the terrestrial environment in the Quaternary of Denmark. Bull Geol Soc Denmark 41:219–228 Anderson MJ, Crist TO, Chase JM et al (2011) Navigating the
multiple meanings of β diversity: a roadmap for the practic-ing ecologist. Ecol Lett 14:19–28. https ://doi.org/10.111 1/j.1461-0248.2010.01552 .x
Baselga A (2010) Partitioning the turnover and nestedness compo-nents of beta diversity. Glob Ecol Biogeogr 19:134–143. https ://doi.org/10.1111/j.1466-8238.2009.00490 .x
Bennett KD, Tzedakis PC, Willis KJ (1991) Quaternary refugia of north European trees. J Biogeogr 18:103–115
Birks HJB (1986) Late Quaternary biotic changes in terrestrial and limnic environments, with particular reference to north west Europe. In: Berglund BE (ed) Handbook of Holocene palaeo-ecology and palaeohydrology. Wiley, Chichester, pp 3–65 Birks HJB (2007) Estimating the amount of compositional change in
late-Quaternary pollen-stratigraphical data. Veget Hist Archaeo-bot 16:197–202. https ://doi.org/10.1007/s0033 4-006-0079-1
Birks HJB, Birks HH (2004) The rise and fall of forests. Science 305(5683):484–485. https ://doi.org/10.1126/scien ce.11013 57
Brauer A, Allen JRM, Mingram J, Dulski P, Wulf S, Huntley B (2007) Evidence for last interglacial chronology and environ-mental change from southern Europe. Proc Natl Acad Sci USA 104:450–455. https ://doi.org/10.1073/pnas.06033 21104
Buckley LB, Jetz W (2008) Linking global turnover of species and environments. Proc Natl Acad Sci USA 105:17,836–17,841.
https ://doi.org/10.1073/pnas.08035 24105
Descombes P, Vittoz P, Guisan A, Pellissier L (2017) Uneven rate of plant turnover along elevation in grasslands. Alp Bot 127:53– 63.https ://doi.org/10.1007/s0003 5-016-0173-7
Dutton A, Carlson AE, Long AJ et al (2015) Sea-level rise due to polar ice-sheet mass loss during past warm periods. Science 349(6244):1–9. https ://doi.org/10.1126/scien ce.aaa40 19
Fischer H, Meissner KJ, Mix AC et al (2018) Palaeoclimate con-straints on the impact of 2 °C anthropogenic warming and beyond. Nat Geosci 11:474–485. https ://doi.org/10.1038/s4156 1-018-0146-0
Harting P (1874) De bodem van het Eemdal. Verslagen en Med-edelingen van de Koninklijke Academie van Wetenschappen. Afdeling Naturkunde II 8:282–290
Helmens KF (2014) The Last Interglacial-Glacial cycle (MIS 5-2) re-examined based on long proxy records from central and north-ern Europe. Quat Sci Rev 86:115–143. https ://doi.org/10.1016/j. quasc irev.2013.12.012
Iversen J (1960) Problems of the early post-glacial forest devel-opment in Denmark. Danmarks Geologiske Undersøgelse 4. række, 4, nr. 3. Reitzel, København
Jackson ST, Blois JL (2015) Community ecology in a changing envi-ronment: perspectives from the Quaternary. Proc Natl Acad Sci USA 112:4,915-4,921. https ://doi.org/10.1073/pnas.14036 64111
Jarzyna MA, Finley AO, Porter WF, Maurer BA, Beier CM, Zuck-erberg B (2014) Accounting for the space-varying nature of the relationships between temporal community turnover and the environment. Ecography 37:1,073–1,083. https ://doi. org/10.1111/ecog.00747
Jessen K, Milthers V (1928) Stratigraphical and paleontological stud-ies of interglacial fresh-water deposits in Jutland and northwest Germany. In: Danmarks Geologiske Undersøgelse 2. Raekke, nr. 48. Reitzel, København
Kühl N (2003) Die Bestimmung botanisch-klimatologischer Trans-ferfunktionen und die Rekonstruktion des bodennahen Klima-zustandes in Europa während der Eem-Warmzeit. Dissertationes Botanicæ 375. Borntraeger, Stuttgart
Kukla GJ, Bender ML, de Beaulieu J-L, Bond G, Broecker WS, Clev-eringa P, Gavin JE, Herbert TD, Imbrie J, Jouzel J, Keigwin LD, Knudsen K-L, McManus JF, Merkt J, Muhs DR, Müller H, Poore RZ, Porter SC, Seret G, Shackleton NJ, Turner C, Tzedakis PC, Winograd IJ (2002) Last interglacial climates. Quat Res 58:2–13.
https ://doi.org/10.1006/qres.2001.2316
Kupryjanowicz M, Nalepka D, Pidek IA et al (2018) The east-west migration of trees during the Eemian Interglacial registered on isopollen maps of Poland. Quat Int 467:178–191. https ://doi. org/10.1016/j.quain t.2017.08.034
Maher LJ, Heiri O, Lotter AF (2012) Assessment of uncertainties asso-ciated with palaeolimnological laboratory methods and microfos-sil analysis. In: Birks HJB, Lotter AF, Juggins S, Smol JP (eds) Tracking environmental change using lake sediments, vol 5. Data handling and numerical techniques. Springer, Dordrecht, pp 143– 166. https ://doi.org/10.1007/978-94-007-2745-8_6
Milner AM, Müller UC, Roucoux KH et al (2013) Environmental vari-ability during the Last Interglacial: a new high-resolution pollen record from Tenaghi Philippon, Greece. J Quat Sci 28:113–117.
https ://doi.org/10.1002/jqs.2617
Müller H (1974) Pollenanalytische Untersuchungen und Jahress-chichtenzählungen an der holsteinzeitlichen Kieselgur von Mun-ster-Breloh. Geol Jb A21:107–140
Salonen JS, Helmens KF, Brendryen J et al (2018) Abrupt high-latitude climate events and decoupled seasonal trends during the Eemian. Nat Commun 9:2851. https ://doi.org/10.1038/s4146 7-018-05314 -1
Sánchez Goñi MF, Bakker P, Desprat S et al (2012) European climate optimum and enhanced Greenland melt during the Last Intergla-cial. Geology 40:627–630. https ://doi.org/10.1130/G3290 8.1
Shackleton NJ, Sánchez Goñi MF, Pailler D, Lancelot Y (2003) Marine Isotope Substage 5e and the Eemian interglacial. Glob Planet Chang 36:151–155. https ://doi.org/10.1016/S0921 -8181(02)00181 -9
Simpson GL, Birks HJB (2012) Statistical learning in palaeolimnol-ogy. In: Birks HJB, Lotter AF, Juggins S, Smol JP (eds) Tracking environmental change using lake sediments, vol 5. Data handling and numerical techniques. Springer, Dordrecht, pp 249–327. https ://doi.org/10.1007/978-94-007-2745-8_9
Šmilauer P, Lepš J (2014) Multivariate analysis of ecological data using Canoco 5. Cambridge University Press, Cambridge
ter Braak CJF, Prentice IC (1988) A theory of gradient analysis. Adv Ecol Res 18:271–317
ter Braak CJF, Šmilauer P (2012) Canoco Reference Manual and User’s Guide: software for ordination (version 5.0). Microcomputer Power, Ithaca
ter Braak CJF, Verdonschot PFM (1995) Canonical correspondence analysis and related multivariate methods in aquatic ecology. Aquat Sci 57:255–289
Tuomisto H (2010) A diversity of beta diversities: straightening up a concept gone awry, part 2: quantifying beta diversity and related phenomena. Ecography 33:23–45. https ://doi.org/10.111 1/j.1600-0587.2009.06148 .x
Tzedakis PC (2007a) Pollen records, last interglacial of Europe. In: Elias SA (ed) Encyclopedia of Quaternary science, vol 3. Elsevier, Amsterdam pp 2597–2605
Tzedakis PC (2007b) Seven ambiguities in the Mediterranean pal-aeoenvironmental narrative. Quat Sci Rev 26:2,042–2,066. https ://doi.org/10.1016/j.quasc irev.2007.03.014
Tzedakis PC, Andrieu V, de Beaulieu JL et al (2001) Establishing a terrestrial chronological framework as a basis for biostratigraphi-cal comparisons. Quat Sci Rev 20:1,583–1,592
Tzedakis PC, Channell JET, Hodell DA, Kleiven HF, Skinner LC (2012) Determining the natural length of the current interglacial. Nat Geosci 5:138–141. https ://doi.org/10.1038/ngeo1 358
Tzedakis PC, Emerson BC, Hewitt GM (2013) Cryptic or mystic? Gla-cial tree refugia in northern Europe. Trends Ecol Evol 28:696– 704. https ://doi.org/10.1016/j.tree.2013.09.001
Tzedakis PC, Drysdale RN, Margari V et al (2018) Enhanced climate instability in the North Atlantic and southern Europe during the Last Interglacial. Nat Commun 9:4235. https ://doi.org/10.1038/ s4146 7-018-06683 -3
Wardle DA, Bardgett RD, Walker LR, Peltzer DA, Lagerström A (2008) The response of plant diversity to ecosystem retrogression: evidence from contrasting long-term chronosequences. Oikos 117:93–103. https ://doi.org/10.1111/j.2007.0030-1299.16130 .x
Williams JW, Blois JL, Shuman BN (2011a) Extrinsic and intrin-sic forcing of abrupt ecological change: case studies from the late Quaternary. J Ecol 99:664–677. https ://doi.org/10.111 1/j.1365-2745.2011.01810 .x
Zagwijn WH (1996) An analysis of Eemian climate in western and central Europe. Quat Sci Rev 15:451–469
Publisher’s Note Springer Nature remains neutral with regard to jurisdictional claims in published maps and institutional affiliations.
Affiliations
Vivian A. Felde1,22 · Suzette G. A. Flantua1 · Cathy R. Jenks1 · Blas M. Benito1 · Jacques‑Louis de Beaulieu2 ·
Petr Kuneš3 · Donatella Magri4 · Dorota Nalepka5 · Bjørg Risebrobakken6 · Cajo J. F. ter Braak7 ·
Judy R. M. Allen8 · Wojciech Granoszewski9 · Karin F. Helmens10 · Brian Huntley8 · Ona Kondratienė11 ·
Laimdota Kalniņa12 · Mirosława Kupryjanowicz13 · Małgorzata Malkiewicz14 · Alice M. Milner15 ·
Małgorzata Nita16 · Bożena Noryśkiewicz17 · Irena A. Pidek18 · Maurice Reille2 · J. Sakari Salonen19 ·
Vaida Šeirienė11 · Hanna Winter20 · Polychronis C. Tzedakis21 · H. John B. Birks1,21,22
1 Department of Biological Sciences, University of Bergen,
PO Box 7803, 5020 Bergen, Norway
2 Aix Marseille Université, Avignon Université, CNRS, IRD,
IMBE, Aix-en-Provence, France
3 Department of Botany, Faculty of Science, Charles
University, Prague, Czech Republic
4 Department of Environmental Biology, Sapienza University
of Rome, Rome, Italy
5 Department of Palaeobotany, W. Szafer Institute of Botany,
Polish Academy of Sciences, Lubicz 46, 31-512 Kraków, Poland
6 NORCE Norwegian Research Centre, Bjerknes Centre
7 Biometris, Wageningen University and Research,
Wageningen, The Netherlands
8 Department of Biosciences, Durham University,
Durham DH1 3LE, UK
9 Polish Geological Institute, National Research Institute,
Carpathian Branch, Skrzatów 1, 31-560 Kraków, Poland
10 Department of Physical Geography and the Bolin
Centre for Climate Research, Stockholm University, 106 91 Stockholm, Sweden
11 Nature Research Centre, Institute of Geology and Geography,
Akademijos 2, 08412 Vilnius, Lithuania
12 Faculty of Geography and Earth Sciences, University
of Latvia, Rainis Boulevard 19, 1586 Riga, Latvia
13 Department of Palaeobotany, Institute of Biology, University
of Białystok, Ciołkowskiego 1J, 15-425 Białystok, Poland
14 Laboratory of Paleobotany, Department of Stratigraphical
Geology, Institute of Geological Sciences, University of Wrocław, Cybulskiego 34, 50-205 Wrocław, Poland
15 Department of Geography, Royal Holloway, University
of London, Egham TW20 0EX, UK
16 Department of Fundamental Geology, Faculty
of Earth Sciences, University of Silesia, Będzińska 60, 41-200 Sosnowiec, Poland
17 Faculty of Earth Sciences, Nicolaus Copernicus University
in Toruń, Lwowska 1, 87-100 Toruń, Poland
18 Faculty of Earth Sciences and Spatial Management, M. Curie
Skłodowska University, al. Krasnicka 2cd, 20-718 Lublin, Poland
19 Department of Geosciences and Geography, University
of Helsinki, PO Box 64, 00014 Helsinki, Finland
20 Polish Geological Institute and National Research Institute,
Rakowiecka 4, 00-975 Warszawa, Poland
21 Environmental Change Research Centre, Department
of Geography, University College London, London WC1E 6BT, UK
22 Bjerknes Centre for Climate Research, University of Bergen,