HAL Id: halshs-01582478
https://halshs.archives-ouvertes.fr/halshs-01582478
Preprint submitted on 6 Sep 2017
HAL is a multi-disciplinary open access
archive for the deposit and dissemination of sci-entific research documents, whether they are pub-lished or not. The documents may come from
L’archive ouverte pluridisciplinaire HAL, est destinée au dépôt et à la diffusion de documents scientifiques de niveau recherche, publiés ou non, émanant des établissements d’enseignement et de
To cite this version:
Tiangboho Sanogo. Does fiscal decentralization enhance citizens’ access to public services and reduce poverty? Evidence from a conflict setting. 2017. �halshs-01582478�
SÉRIE ÉTUDES ET DOCUMENTS
Does fiscal decentralization enhance citizens’ access to public
services and reduce poverty? Evidence from a conflict setting
Tiangboho Sanogo
Études et Documents n° 15
August 2017
To cite this document:
Sanogo T. (2017) “Does fiscal decentralization enhance citizens’ access to public services and reduce poverty? Evidence from a conflict setting”, Études et Documents, n° 15, CERDI.
http://cerdi.org/production/show/id/1887/type_production_id/1
CERDI
65 BD. F. MITTERRAND
63000 CLERMONT FERRAND – FRANCE TEL.+33473177400
2
PhD Student in Economics - École d’économie - Cerdi, Université Clermont Auvergne - CNRS, Clermont-Ferrand, France.
E-mail: tiangboho.sanogo@uca.fr
This work was supported by the LABEX IDGM+ (ANR-10-LABX-14-01) within the program “Investissements d’Avenir” operated by the French National Research Agency (ANR).
Études et Documents are available online at: http://www.cerdi.org/ed
Director of Publication: Grégoire Rota-Graziosi Editor: Catherine Araujo Bonjean
Publisher: Mariannick Cornec ISSN: 2114 - 7957
Disclaimer:
Études et Documents is a working papers series. Working Papers are not refereed, they constitute research in progress. Responsibility for the contents and opinions expressed in the working papers rests solely with the authors. Comments and suggestions are welcome and should be addressed to the authors.
3
to municipalities enhances access to public services and contributes to reducing poverty in Côte d’Ivoire. The analysis uses a local government’ revenue and expenditure dataset from 2001 to 2011 for 115 municipalities in 35 departments. An adjusted multidimensional poverty index and a headcount poverty index are calculated at the local level using the Household Living Standard Survey. The empirical analysis uses a grouped fixed effect approach, combined with a two-stage least squares methodology with panel corrected standard errors clustered by department, to address both time-varying heterogeneity and local revenue endogeneity.
The results suggest that increased local revenue positively affects access to public services and reduces poverty. However, there is evidence that fiscal decentralization has a more robust effect on access to public service, than on poverty. This effect seems to work mainly through enhancing access to education more than access to health, water, and sanitation services. Contrary to existing literature, our results indicate that municipalities are more likely to improve access to public services in less ethnically diverse localities and in rural zones. The study provides evidence that the effect of the conflict experienced by the country has been limited statistically.
Keywords: Fiscal decentralization, Local development, Multidimensional poverty, Local
government revenue,Municipalities, Côte d’Ivoire.
JEL Codes: H71; H75; I32.
Acknowledgment:
I would like to thank Jean-François Brun (the University of Clermont Auvergne) and Antonio Savoia (the University of Manchester) for helpful comments. This paper has also benefited from discussions at the Centre for European Economic Research (ZEW) Conference on Public Finance and Development (Germany, Mannheim, May 2017).
1. Introduction
In recent decades, both researchers and policy-makers have paid increasing attention to the relationship between fiscal decentralization and p overty al-leviation. Whether local government revenue autonomy improves citizens’ access to public service, and reduces poverty, has become an important pol-icy issue in sub-Saharan Africa.
It has been argued that devolving decision making and revenue mobilization responsibilities to local government makes local authorities more accountable and thereby increases their effectiveness in delivery of public services (Hayek,
1945, Oates, 1993). Fiscal decentralization has been pursued in developing countries as a main policy reform. Almost all African countries have em-barked on ambitious fiscal decentralization programs (de Mello,2 000). Many studies have tried to investigate the effect of fiscal decentralization on access to public services and poverty reduction. For example, Gonçalves (2014) finds that local citizens’ participation in service provision contributes to im-proving infant mortality and reducing poverty in Brazilian municipalities. By shaping inclusive and equitable development policies, local institutions decision making accounts for cultural values and therefore helps to reduce rural poverty in Burkina Faso (Donnelly-Roark et al., 2001). The literature has developed several arguments for expecting fiscal d ecentralization t o be relevant to public services delivery and poverty reduction.
First, decentralization enhances accountability in the service delivery process of local governments more than for a distant central government, because the local governments are assumed to be subject to electoral pressures from local citizens (Bartolucci et al., 2015). Second, local authorities by being
closer to their constituencies may have better access to local information which allows them to provide local goods and services that better match demand (Hayek, 1945). These expectations of efficiency gain from fiscal decentralization are based on many assumptions (Oates, 1993). The local democracy must function effectively, since there is accurate information for voters to evaluate the fiscal d ecisions o f t heir l ocal a uthorities. Moreover, local governments must have substantial revenue autonomy and discretion in allocating resources.
In developing countries, there are strong reasons to believe that such pre-sumptions are violated (Smoke, 2001). As Bardhan and Mookherjee (2000) point out, local authorities are likely to be under pressure from local elites and thus divert resources away from poverty reduction programs. The level of literacy and political awareness among citizens may be too limited to apply sufficient political pressure (Bardhan and Mookherjee, 2005).
After three decades of fiscal decentralization, the high levels of p overty and the poor access of citizens to better services have not disappeared in most de-veloping countries. Although several poverty reduction programs are based on devolving responsibilities to local governments, Sub-Saharan Africa ac-counts for a quarter of the world’s 1.2 billion people living on less than US 1 dollar (World Bank,2016). A large proportion of citizens suffer from limited access to basic services such as education, health and drinking water.
While the effect of fiscal decentralization on public services seems to be con-text specific, f ew s tudies u sing c ountry-level d ata h ave a nalyzed t his effect, especially in sub-Saharan Africa. One problem with the existing literature is that the evidence draws on cross country data, thus ignoring the institutional
arrangements that govern the design and implementation of decentralization, rendering the issue of country specific e ffects p roblematic (von B raun and Grote, 2000). In addition, there is no systematic empirical evidence about whether more local heterogeneity increases local governments’ efficiency in terms of improvements in the provision of education, health, drinking water, and sanitation services.
This paper sets out to shed light on the relationship between fiscal decentral-ization and access to public services and income poverty. More precisely, the study analyzes the extent to which fiscal d ecentralization, m easured a s the share of local own revenue, affects access to basic public services and poverty in Côte d’Ivoire. This paper investigates also whether the effects of fiscal decentralization vary between local governments according to their internal heterogeneity, defined as the degree of ethnic fractionalization and polariza-tion.The empirical analysis uses a local revenue dataset spanning 11 years (2001-2011) for 115 municipalities in 35 départements. An adjusted multi-dimensional poverty index (MPIa) and a headcount poverty index (HPIn) are calculated at département level using the 2002 and 2008 Household Liv-ing Standard Surveys (HLSS). The Grouped Fixed Effect (GFE) method is used for estimations. This approach allows controlling for unobserved hetero-geneity, which may vary or not over time. A two-stage least squares (2SLS) method is combined with the GFE to properly address the potential endo-geneity of local revenue. The results suggest that increased local revenue positively affects access to public services, than on poverty. However, there is evidence that fiscal decentralization has a more robust effect on access to public service, rather than poverty. This effect seems to work mainly by
increasing access to education more than to health, water, and sanitation services. Contrary to the existing literature, our results indicate that munic-ipalities are more likely to improve access to public services in less ethnically diverse localities and in rural zones. This study provides evidence that effect of the conflict experienced by the country has been statistically limited. The remainder of the paper is organized as follows. Section 2 reviews the literature and analyzes the channels through which fiscal decentralization af-fects citizens’ access to public goods and poverty. Section 3 describes the fiscal decentralization p rocess, and the p overty in Côte d’Ivoire with its re-gional distribution. Section 4 presents the data and the estimation strategy. The main results and the robustness checks are discussed in section 5. Section 6 concludes and provides some policy implications.
2. Literature review
2.1. Fiscal decentralization increases citizens’ access to public services and reduces poverty
This section provides an overview of the theoretical predictions and empirical findings by describing the different channels by which fiscal decentralization might affect citizens’ access to public services and reduce poverty.
The existing literature on decentralization has shown the potential effect of fiscal decentralization on p overty r eduction. The first and classic argument is that fiscal d ecentralization c an p rovide p opulations w ith i mproved eco-nomic efficiency in local public services delivery (Hayek, 1945, Oates,1993). As Oates (1993) argues “the provision of local outputs that are differenti-ated according to local tastes and circumstances results in higher levels of
social welfare than centrally determined”. In this regard, by moving decision-making closer to the people, local authorities may have better access to local information and local needs, which may allow them to provide local goods and services that match local demand. This may improve human welfare and thus reduce poverty. For example, Behrman et al. (2002) find t hat active involvement of local governments in the provision of transport for medical emergencies and supply of contraceptives at health centers improves access to health facilities in India. Many studies reveal that the quality of delivery of public services improves more when provided by local governments. Local governments in Kerala (India) improved the efficiency of delivery of public services by better identifying the beneficiaries f or p overty e radication pro-grams (Heller et al., 2007). The literature also stresses the important role of the accountability of local authorities in the relationship between fiscal decentralization and poverty reduction. Gonçalves (2014) provides a good investigation of the impact of fiscal decentralization on local living conditions by addressing the question of accountability and service provision resulting from “Participatory Budgeting” in Brasilia. She finds that the participatory budgeting, through which the ordinary citizen is given the ability to interact with elected politicians in the planning of local budget, contributes to a re-duction in infant mortality rates for those municipalities which adopted it. Consistent with the theory of fiscal federalism, this research shows that the participatory budgeting operates through two channels. First, it improves information flows between citizens and policy-makers and therefore increases the probability that services delivered satisfy local needs. Second, it strength-ens politicians’ accountability to their constituents because the politicians’
promises become more visible. Sow and Razafimahefa (2015) investigates the relationship between fiscal d ecentralization a nd t he e fficiency o f p ublic ex-penditures by using a panel data of advanced and developing countries over the two last decades. They conclude that devolving more responsibilities has a noticeable impact on public expenditure efficiency. Their investigation goes further by showing that this efficiency reduces poverty. Another channel is that fiscal d ecentralization c an r educe p olitical i nstability. B y devolving power and resources to lower levels of government, fiscal decentralization re-lieves political tensions, reduces the risk of violence or secession, and thus improves citizens’ well-being. Jean-Paul (2014) examines this relationship through the effects of decentralization on governance. He argues that in the particular context of a country with heterogeneous ethnic or regional identities, local government’ autonomy can relieve potential grievances or vi-olence by being more responsive to the demands of such groups. This reduces poverty and creates good conditions for local development. These benefits of fiscal d ecentralization s how c learly h ow i nvolving l ocal g overnments in decision making and revenue raising might positively affect access to basic services and reduce poverty.
2.2. Fiscal decentralization increases poverty and worsens delivery of public services
Against the arguments of efficiency gains resulting from involving local gov-ernments in decision making, Prud’homme (1995) and Treisman (2000), among others, argue that fiscal d ecentralization w orsens d elivery o f public services, and as a result increases poverty. The literature has highlighted several mechanisms through which this might operate. First, Prud’homme
(1995) argues that releasing considerable tax raising responsibilities might increase inequality among regions due to the different tax potential of differ-ent regions. Regions with large tax bases will collect more taxes at a lower tax rate, and provide more local public services than poorer regions, leading to a concentration of economic growth in urban areas. Another argument de-veloped by Prud’homme(1995) is that fiscal decentralization has an indirect impact on the living standards of citizens through the competition between municipalities, which reduce the tax rates to attract investments. For him, by lowering tax rates in the absence of central government regulation, local governments’ tax autonomy will result in loss of efficiency in delivery of pub-lic services. Local authorities’ tax responsibility can worsen macroeconomic stability. As they have few incentives to undertake economic stabilization policies, releasing larger tax bases to local governments prevents central gov-ernment from using tax revenue and/or tax rate to stabilize macroeconomic policy (Bird and Vaillancourt,2006). The negative effects of fiscal decentral-ization on poverty can be extremely important because of corruption, which is more likely to prevail at local level than central government. Prud’homme
(1995) notes “Local politicians and bureaucrats are likely to be more subject to pressing demands from local interest groups”. By this argument, fiscal decentralization induces efficiency loss due to corruption, and increases the aggregate level of corruption in the country. For example, authors have ex-plained that local institutions can formally introduce some exemptions in a tax structure that favor interests groups (Martinez-Vazquez and McNab,
2003, Treisman, 2000). These groups also avoid tax by paying bribes, or kickbacks, to tax assessors who are more vulnerable at the local level. Thus,
fiscal decentralization worsens the population’s living conditions through cor-ruption that reduces income, because citizens must pay bribes to receive pub-lic services for which they have already paid taxes (Martinez-Vazquez and McNab, 2003, Treisman,2000). This increases income inequality since local revenue collection favors a minority which consists of high-income individuals (Martinez-Vazquez and McNab, 2003, Treisman, 2000). Local government’ taxation can also induce a lack of aggregate fiscal discipline and affect eco-nomic growth. Zhang and Zou (1998) argue that devolving more responsibil-ities to local governments is negatively correlated to economic growth in de-veloping countries, but remains positively correlated in advanced economies. For these authors, the limited administrative capacity of local governments explains this unexpected result. They also find s imilar r esults i n a country level study focusing on the 28 provinces in China during the period 1986 to 1992. They conclude that fiscal decentralization contributes to lowering re-gional economic growth in China. Prud’homme(1995) has developed an idea closely related the specific characteristics of developing c ountries. He argues that the heterogeneity of the population in developing countries is based on income, and that there is not a substantial difference between different kinds of local government as predicted by the theory of fiscal f ederalism. The pri-orities are therefore to satisfy the population’s basic needs, which are better managed by central government. However, many studies find l ocal hetero-geneity of the population has the potential to reduce the efficiency of public service delivery (Conyers, 2007). Alesina et al. (1999) conclude that ethnic diversity in American cities reduces the performance of a city government in delivering public services. Regarding developing countries, a major problem
with the exiting literature is that there is no systematic empirical evidence on whether higher local heterogeneity increases local government efficiency in terms of improvements in the provision of education, health, drinking water, and sanitation services. The available evidence draws either on cross coun-try data or ignores the institutional arrangements that govern the design and implementation of decentralization, making the issues of specific country ef-fects problematic (von Braun and Grote,2000). In short, decentralization can undermine the efficiency gain predicted by Hayek (1945), because in many countries, and especially in developing economies, the hypothesis governing the predictions of fiscal f ederalism a re l ikely t o b e v iolated (Smoke,2001). In summary, both the empirical and the theoretical literature is inconclusive as to whether fiscal decentralization p ositively or negatively affects poverty. The link between poverty reduction and fiscal decentralization is particularly ambiguous in a fragile state such as Côte d’Ivoire. Using country level data, as in this paper, allows the capture of these particularities, contrary to exist-ing studies that used cross country data. Furthermore, the existing problems of access to public services may be compounded by conflict. In order to con-sistently estimate the impact of fiscal decentralization on p overty reduction in such a fragile country, it appears important to analyze its specificities in terms of fiscal decentralization and the poverty trend.
3. Background
3.1. Fiscal decentralization in Côte d’Ivoire
This section briefly describes the Côte d’Ivoire fiscal decentralization system by focusing on the revenue assignment and local revenue autonomy (LRA)
over the last three decades. The revenue structure of local government in Côte d’Ivoire is largely inherited from the colonial period. The implementa-tion started with law No. 55-1489 of 18 November 1955 which established municipalities in Abidjan, Bouaké and Grand Bassam. These local author-ities did not have financial a utonomy. T he r eal c ommitment o f t he central government to implement decentralization especially the financial autonomy of municipalities, started with Law No. 80-1162 of 17 October 1980. This law defined a specific status and electoral regime for municipalities and cre-ated 37 municipality councils in addition to Abidjan. The government has spread the reform to other regions by transferring expenditure and revenue raising responsibilities to local authorities with the aim of improving effec-tiveness and efficiency in delivery of public services. In 2000, the government adopted a new constitution, which lays out the principle of administration and financial a utonomy o f l ocal a uthorities. T his C onstitution subdivides the country into a multi-tiered system with 19 regions sub-divided into 58 départements governed by départements councils, and 197 municipalities at the lowest level. Since 2011, although the number of municipalities has re-mained unchanged, the central government has reorganized the country into 14 districts (with full autonomy for Abidjan and Yamoussoukro), 31 regions, 58 départements, and 197 municipalities, each with an elected mayor. How-ever, tax-raising responsibilities are devolved only to the municipality level. The Ministry of Interior manages the decentralization process through the Directorate in charge of decentralization and local development (DDLD). The Ministry of Economy and Finance collaborates with the DDLD to define the amounts of transfers from central to local governments and their allocation.
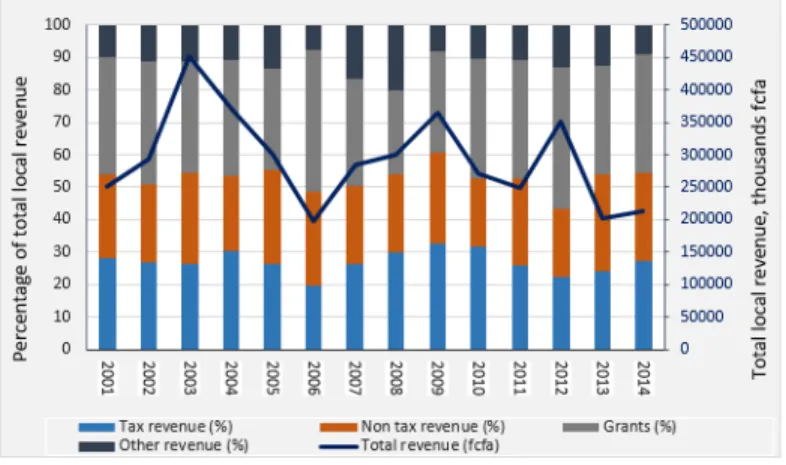
These administrations interact with municipalities organized in the associa-tion the Union of Côte d’Ivoire for cities and municipalities (UVICOCI). The relationship between central and local governments is organized through a trusteeship system with two levels, by which the central administration ap-proves decisions and provides assistance to municipalities. In the process of strengthening the fiscal a utonomy o f m unicipalities a nd g rassroots partici-pation in the decision-making process, more than 35 legislative decrees and laws have been passed to assign expenditure execution responsibilities, and revenue raising functions to municipalities. These responsibilities are often related to the provision of important public services such as health and ed-ucation facilities, water and sanitation, local urbanization, and include large sources of revenue. According to the constitution, local own revenue has two main components: non-tax revenue collected exclusively by local tax admin-istration, and tax revenue collected on behalf of local governments by central government through the General Tax Directorate (GTD). Although this lo-cal non-tax revenue is smaller than local tax revenue—only 0.13 percent of GDP in 2005 according to the DDLD—this revenue remains a key element for increasing accountability and tax compliance at the local level, and so improves the population’s well-being. The local authorities have full auton-omy in managing this revenue, in contrast to local tax revenue which is often earmarked. Figure 1 shows the composition of total municipality revenue over the period 2001-2014, and the trend of total local revenue. Over this period, transfers from the central government contributed on average more than 35 percent of total municipal revenue. This share decreased slightly in
the three-year period leading up to the 2010 national election 1. During the same period, municipalities collected a small part of their total revenue, on average less than 20 percent. However, tax revenue represents on average 25 percent of total municipality revenue, and remained relatively constant in absolute terms up to 2014. Combining these two components, local own revenue contributed 45 percent of total revenue. This is relatively low com-pared to other developing countries such as Benin, where municipalities’ own revenue contributed 69 percent of total revenue over the period 2003 to 2008 (Caldeira and Rota-Graziosi, 2014).
Figure 1: Composition of municipality revenue in Côte d’Ivoire 2001-2014
Figure 2 presents the structure of local own revenue. Its principal sources are (i) residential tax, (ii) licenses and various charges (for business, market, construction permit, bars, shows, advertising, hotels, etc.) (iii) service fees (water, sanitation, waste collection, etc.) and (iv) vehicle tax (often shared
1This trend suggests a possible reassignment of resources to election expenditure since
the allocation criteria of these transfers remain mostly at the discretion of central govern-ment
with the center). The tax on small local businesses and licenses contributes the highest share of local own revenue at more than 26 percent, and lease fees account for less than 6 percent. Figure 2 shows that market fees combined with flat tax represent more than 50 percent of municipality own revenue. As noted above, municipalities are supposed to use their own revenues to improve access to public services and thus reduce poverty since they are involved in the provision of diverse public services such as health and education facilities, water and sanitation, local urbanization, and construction.
3.2. Public service delivery and poverty trend in Côte d’Ivoire
In this sub-section, poverty trends are analyzed through both the poverty and the access to public services using respectively the poverty headcount ratio and the multidimensional poverty index (MPI) recently developed by (Alkire and Santos, 2010). Three decades after starting its decentralization process, Côte d’Ivoire remains one of the poorest countries in the world, ranked 171 out of 188 countries according to the 2016 Human Development Index. Following its independence from France in 1960, the country enjoyed a period of economic growth and political stability driven by agriculture ex-ports, mainly coffee and cocoa. At end of the 1970s, the country experienced an economic downturn due to an unexpected drop in the world prices of these export goods. This economic crisis increased the incidence of poverty up to the 1990s (Bargain et al., 2014). In order to improve the population access to basic public services, especially in rural areas and thereby reduce regional disparities, the Ivorian government has undertook a huge process of fiscal de-centralization by involving municipalities in tax raising responsibilities and public services delivery. This shift of responsibilities was followed by a fall in poverty by 3.2 percent over the period 1995-1998. Unfortunately, the ex-pected results from fiscal d ecentralization h ave b een l imited, d ue, t o three main reasons. First, like in many developing countries, the central govern-ment has been reluctant to provide municipalities with considerable respon-sibilities of tax raising. Second, the administrative capacity of municipalities is very limited in some areas. The third reason is that the country experi-enced several episodes of conflict, which compounded the existing problems
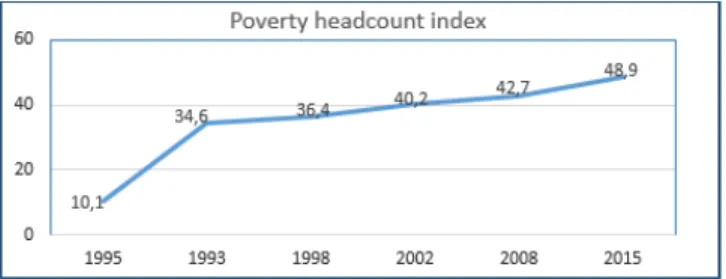
of access to public services and of poverty2. As a consequence, since 1998, the share of the population living under the poverty line with no access to basic services has increased significantly. The multidimensional poverty rate increased from 31.8 percent in 2008 to 34.4 percent in 2011, while income poverty increased from 48.9 percent to 51.3 percent over the same period (Alkire and Santos, 2010). Figure 3 shows the poverty trends from 1985 to 2015. Income poverty, defined as the percentage of population living with less than US dollar 1 a day, increased from 10 percent in 1985 to 36.4 per-cent in 1995. From 1999, the income poverty ratio has been increasing ,and exceeded 46 percent in 2015 (HLSS, 2015). Access to public services also remains a concern in Côte d’Ivoire and there is considerable disparities be-tween municipalities. There is a widespread geographical variation in access to public services (graph a), and local revenue autonomy (graph b). In urban area, on average 75 percent of the population has access to education, heath, and sanitation, while this figure is only 30 percent in rural areas. The water distribution, education, and health services are poor, especially in the north-ern and westnorth-ern regions. A possible explanation is a significant populations displacement across the country, as highlighted by (Furst et al., 2010). In particular, the conflict-ridden areas in the north and the west, such as the re-gion of Tonpki (Man) and the Savannah, remain the poorest areas (Figure 4).
Minoiu and Shemyakina (2014) report that 70 percent of professional health workers and 80 percent of government-paid teachers abandoned their post in
2Since 1999, Côte d’Ivoire has experienced the 1999 coup d’etat, the 2002 political
conflict a nd t he p ost-electoral c onflict of 20 10/2011. Th is pe riod wa s ch aracterized by sporadic events with different intensity and location (Dabalen et al.,2012).
the north during the 2002-2007 conflict. Figures 4 shows the distribution of multidimensional poverty and local revenue autonomy by département, the darker shades denote lower multidimensional poverty rate and higher rev-enue autonomy. Interestingly, most of the poorer areas in the country are in the north and west of the country and coincide with the areas of lower local revenue autonomy.
Figure 3: Poverty Headcount Ratio at national poverty line (percentage of population)
Note: Graph (a), the Adjusted Multidimensional Poverty Index (MPIa) is calculated by multiplying the incidence of poverty by the average intensity of poverty across the poor (MPI = H x A); as a result, it reflects both the share of people in poverty and the degree by which they are deprived. See more details in the following section. Darker shades indicate a lower poverty index reported as a ratio of the number of multidimensional poor to the total local population. Graph (b): The local own revenue is calculated as the share of revenue collected by local governments over the total local revenue (It is the mean of four years after conflict, 2010, 2011, 2012 and 2 013). Darker shades indicate a higher autonomy of internal revenue collection.
(a) MPIa (b) Local Own Revenue
Figure 4: The adjusted Multidimensional Poverty Index (MPIa) and the Local Own Rev-enue distribution pattern (As percentage of Total Local RevRev-enue), 2010-2013
4. Empirical analysis
This section describes the data and the methodology used in this paper. 4.1. Data
Two sets of variables are particularly important for this study: measures of access to public services / poverty, and fiscal d ecentralization measures. To this end, the data are collected using three sources of information. In sub-Saharan Africa, one of the biggest challenges of doing research on fis-cal decentralization is the scarcity of reliable and long term data. The first source used here is the local government revenue and expenditures dataset constructed from the administrative account of municipalities provided by the Ministry of Interior and the Ministry of Economy and Finances. This
dataset provides information on own revenue, transfers from central govern-ment, and local expenditure for 115 municipalities over the period 2001-2011. The analysis follows (Lessmann, 2012) in using the degree of revenue (tax and/or non-tax) decentralization, defined as the per capita revenue collected by local tax administrations. This measure reflects local revenue autonomy and allows an approximation of municipalities’ autonomy in decision-making. A high value for this measure indicates a high degree of fiscal decentraliza-tion, since local authorities have decision making autonomy in using this revenue according to the constitution as noted above.3 The second source is the 2002 and 2008 Household Living Standard Surveys for Côte d’Ivoire from which the social and demographic indicators are calculated. The HLSS 4 is a national survey which provides information on different dimensions of household living conditions. Its design ensures representativeness for the 57 Côte d’Ivoire départements. Approximately 10,800 households in 2002 and 13,657 households in 2008 were surveyed in the country (HLSS, 2002,2008). Based on this information, a number of control variables are assumed to ac-count for the effects that socioeconomic factors might have on access to public services and poverty. Additionally, information relative to the geographical distribution of the population from the National Statistical Institute is used to calculate the density of population and the share of urban population.
3Another measure of fiscal decentralization is “vertical i mbalance” which represents the
transfer dependence of local governments. It is the degree to which the local government expenditure depends on transfers from central government. It is worth noting that a high value on this measure indicates little local financial autonomy.
4The surveys provide information on household access to several facilities like running
water, electricity, health, and education infrastructures. They contain data about whether households own certain durable goods such as fridge, computer, car, etc.
Third, conflicts indicators are calculated using data from the Armed Conflict Location and Event Dataset (ACLED) (Raleigh et al., 2010). ACLED con-tains information on the exact dates and locations of political violence and type of events weighted with a fatality index 5 The fatality index measures the intensity of events and represents the number of deaths due to each event. The fatality index varies from one to ten, with ten for the highest incidence of violence, and one for the lowest. These three data sources are combined and aggregated at the département level to construct a panel spanning 11 years (2001-2011) for 35 départements of the 57 départements in Côte d’Ivoire.6
How are the dependent variables computed?
As an indicator to measure poverty, the headcount poverty index is calcu-lated as the percentage of the population living with less than US dollar 1 a day in each département7. Access to public services is measured using the multidimensional poverty index (MPI) method developed by (Alkire and Santos, 2010), which captures a set of direct deprivations experienced by a person at the same time. In order to capture the dimensions for which local
5The conflict events selected in this data are of three types (violence against civilians,
re-mote violence, and rioting), protests (non-violent demonstrations), and non-violent events. As the interest period is characterized by political instability and sporadic conflict events, it is reasonable to think that this context may have compounded the existing problems of access to public services.
6The data are aggregated at département level because the 2008 HLSS is not available
at the municipal level like the first data s ource. The 2002 HLSS is used for the sub-periods 2001-2008 while the 2008 HLSS is used for the sub-period 2009-2014.
7The data are corrected for inflation u sing t he n ational p rices d eflator in dex an d the
poverty index is computed following the national poverty line calculation method (Per-centage of total local population of each locality).
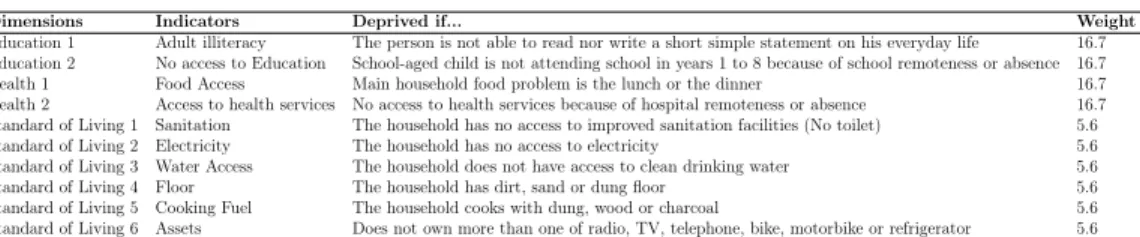
governments intervene in terms of public service delivery, different indicators for each dimension are used in this analysis. I, therefore, adjust the MPI measure, hereafter MPIa, by using indicators for each dimension in which local governments intervene. This indicator allows testing of at the same time wealth/poverty and access to basic services. As argued by (Alkire and Santos,2010), “the MPI is the product of two numbers: the Headcount H or percentage of people who are poor, and the Average Intensity of deprivation A – which reflects the proportion of dimensions in which households are de-prived.” Following this method, the MPIa has three dimensions composed of 10 indicators: two each for education and health, and six for living standards (Table 1). I take advantage of the HLSS survey and use both the person and the household as units of the analysis, which makes the index more accurate than indices which use only households as units of observation8. Table 1 presents the dimensions, indicators, and weights used to compute the MPIa. There are several reasons for the choice of the dimensions used to calculate MPIa in this analysis. First, local fiscal policies can significantly influence the access to public services for local citizens. Since the 2001 law on decentral-ization, there has been an ongoing shift of responsibility for education, water, and sanitation, and health management, to local governments. Second, it is easier to interpret, and is well suited for analyzing the access to basic services at local level. The limited number of dimensions simplifies comparison with the HPIn. Third, the HLSS surveys in Côte d’Ivoire are well documented for the chosen indicators. This measure is calculated for each département
8For some questions, the responses from households are used while for other the
reflecting the percentage of people who are deprived of public services. A cutoff of 30 percent is used to define a poor person. Thus, a person is poor if the weighted indicators for which he or she is deprived add up to 30 per-cent (i.e. deprived in some combination of two to six indicators). Table A1 provides descriptive statistics for all variables (north and south), and Table A3 shows more information on the sources and definitions of these data.
Table 1: Dimensions and indicators used for the MPIa
Dimensions Indicators Deprived if... Weight
Education 1 Adult illiteracy The person is not able to read nor write a short simple statement on his everyday life 16.7 Education 2 No access to Education School-aged child is not attending school in years 1 to 8 because of school remoteness or absence 16.7 Health 1 Food Access Main household food problem is the lunch or the dinner 16.7 Health 2 Access to health services No access to health services because of hospital remoteness or absence 16.7 Standard of Living 1 Sanitation The household has no access to improved sanitation facilities (No toilet) 5.6 Standard of Living 2 Electricity The household has no access to electricity 5.6 Standard of Living 3 Water Access The household does not have access to clean drinking water 5.6 Standard of Living 4 Floor The household has dirt, sand or dung floor 5.6 Standard of Living 5 Cooking Fuel The household cooks with dung, wood or charcoal 5.6 Standard of Living 6 Assets Does not own more than one of radio, TV, telephone, bike, motorbike or refrigerator 5.6 Note:The selected weighting between the dimensions follows the UNDP’s MPI convention
4.2. Model specification
The previous studies commonly use cross-country data and also consider the heterogeneous characteristics as time invariant by using a fixed effect approach. One drawback of this method is that the estimates of parame-ters may be subject to substantial bias in the context that unobserved het-erogeneity is not constant over time (Knight, 2002) 9. To deal with this problem and account for both varying and unvarying heterogeneity between départements, this analysis uses the Grouped Fixed Effect (GFE) approach
9Knight (2002), by analyzing the impact of Federal Grants on US State Government
Spending, argues that some aspects of US states’ demands, such as attitudes towards public transport, are unobservable. He finds t hat a fi xed eff ect ma y mi tigate, bu t not eliminate this problem, since the demand for highway construction varied significantly over time.
proposed by Bonhomme and Manresa (2015), which was characterized by a series of events with different intensity and location, as shown by Dabalen et al. (2012). As the départements are affected differently by conflict and have different revenue potential, their revenue performance trends could fol-low different paths based on their specific unobserved characteristics. Such shocks may induce time-varying unobservable individual characteristics that cannot be accounted by the standard fixed effects approach (Bartolucci et al.,
2015). More evidence about the consistency of this method and the presence of time-varying effects is given in Appendix. The empirical model has the following form:
Ln(P ovM P Ia)it= λ + θ1Ln(F D)it + θ2Heteroit + θ3Ln(F D)∗Heteroit + θ4xit + αgit + ηi + εit + (1)
Ln(PovMPIa) is the dependent variables Ln(Poverty) or the Ln(MPIa) rep-resenting respectively the log of the poverty headcount ratio and the adjusted multidimensional poverty index of département i at time t. The contribution of education and health in MPI is also used as a dependent variables. It rep-resents the number of habitants who do not have sufficient income or food to meet some defined m inimum l iving c onditions over t he t otal population of département i at time t. The interest variable Ln(FD) is measured by the log of per capita internally generated funds of département i at time t. Hetero represents the local heterogeneity of preference (local demand
het-erogeneity). This heterogeneity is approximated by two variables: Ethnic fractionalization and ethnic polarization as they measure the extent of cul-tural diversity and thus local taste 10. These variables are assumed to play a key role in the effect of local revenue autonomy on access to basic services and poverty since the literature has shown that heterogeneity of demand matters in the analysis of the effect of fiscal decentralization on delivery of services (Bird and Vaillancourt, 2006). The literature is inconclusive as to whether these indicators positively or negatively affect access to public ser-vices and poverty. As noted above, the analysis follows the literature by identifying control variables including transfers from central government and economic, demographic and social characteristics, represented by xit. The group-specific unobservable effects αgit is modified to take into account the
département -specific fixed effect ηi as well11. εit represents an idiosyncratic disturbance.
The conflict effects are measured through the number of conflict events in each département and these numbers are weighted by the fatality index. Conflict variables are expected to negatively affect the dependent variables. Before discussing the empirical results, it is necessary to address some issues concerning the estimation strategy. First, there are reasons to consider local own revenue as an endogenous variable that can induce a bias in estima-tions. Départements with a high access to services or a low income poverty
10Ethnic fractionalization measures the probability that two randomly selected
individ-uals in a département (in the context of this study) will not belong to the same ethnic group. Ethnic Polarization measures how far the distribution of the ethnic groups is from a bipolar distribution. The higher these indices, the stronger the heterogeneity of local demand.
rate may have higher potential to increase their revenue collection. The re-sulting reverse causality from this relation may bias the estimation results. Moreover, the internal effectiveness of each département in terms of imple-menting programs and technical staff training are unobservable in the models. This unobservable heterogeneity may be correlated with both the variables of interest and the dependent variables. To address these issues, equation (1) is estimated using a two-stage least squares (2SLS) methodology with panel corrected standard errors clustered by département. An instrumental vari-able for local revenue autonomy is constructed following a method proposed byMartinez-Vasquez et al. (2011). The value of the local revenue autonomy ratio instrumental variable is, calculated as:
LRA ∗ IVit = 1 Pn j−1 1 dj n X j−1 1 dj Ownrevjt (2)
Where LRA*IV is the value of the instrumental variable for département i in year t. d is the distance between the largest cities in département i and départemens j, and Ownrev is the per capita own revenue of département j in year t. This instrument is the weighted average of the own revenue ratio for all other départements in the corresponding year, and the weights are the inverse of the distance between the two départements.
There are two principles hypotheses holding the use of this instrument as argued by Martinez-Vasquez et al. (2011). First, the poverty rate or access to basic services in one département relative to others generally should not have an effect on the local revenue mobilization of other , so the dependent variable should not be correlated with the instrument. Second, the design
of the own revenue raising system in a département should be affected by the design of the own revenue raising system in a neighboring département. The lagged variables of Local Revenue Autonomy (LRA) are also used as instruments under the hypothesis of an inter-temporal dependence of local revenue mobilization.
5. Empirical results and implications
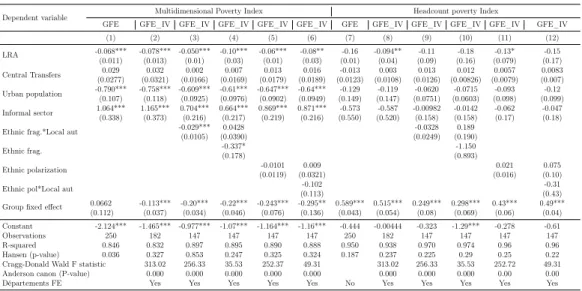
This section presents the econometric results for the relationship between fis-cal decentralization and access to basic services and poverty. Table 3 shows the estimation results of equations 1 concerning the effect of municipal rev-enue autonomy on MPIa or HPIn. As defined a bove, a n egative (positive) sign of a coefficient suggests a positive (negative) impact of the correspond-ing exogenous variable. All standard errors are clustered at the département level. In columns 1 and 7, the results show a positive effect of local rev-enue autonomy on MPIa and HPIn respectively. This effect is statistically significant for MPIa and insignificant for HP In. These results underline the importance of considering poverty as a multidimensional phenomenon which reflects d eprivations i n m ultiple d imensions a s h ighlighted b y W orld Bank
(2016) sucha as education, health, and living standards. The difference be-tween the MPIa and HPIn results suggests that municipalities can help re-duce deprivations in some dimensions without having significant e ffects on individuals’ income. For example, an individual living under the poverty line and deprived in four dimensions could become deprived in three dimensions
due to local government action, but could remain under the poverty line 12. Columns 2 and 8 report the GFE estimation results controlling for potential endogeneity of municipal revenue autonomy. The results show a significant effect of municipal revenue autonomy on access to basic services (column 2, table 3). A 10 percent increase in revenue collected by municipalities induces a 0.78 percent decrease in the share of citizens deprived in at least 30 percent of the selected dimensions . This result is significant at the 1 percent level. The results support the theory that involving local governments in delivery of public services can help to better account for local demand and improve public services. Column 8 replicates the specification of column 2 by using HPIn as the dependent variable. Once endogeneity is controlled for, municipal revenue autonomy appears to have a positive and statistically significant effect on income poverty (HPIn) at the 5 percent level. Comparing this coefficient with those of MPIa, the result shows that the coefficient for MPIa is significant at the 1 percent level, but HPIn is not significant at the same level. Moreover, the estimated coefficients for other control variables have the expected signs only for MPIa.
Note that these results are consistent with the theoretical predictions of (Oates, 1993) and contrast with the findings of Sepulveda and Martinez-Vazquez(2011) who report that fiscal decentralization increases poverty. The difference between our result and those of Sepulveda and Martinez-Vazquez
(2011) could be explained by the country-specific context and the method
12The poverty index using a threshold is limited to many aspects: First, it fails to
take into account the severity of poverty. Second, it assumes that poverty is uniformly distributed across a given household ignoring the vulnerable family number such as children and elderly population.
used in their study. Although they use fixed e ffect e stimation, t he cross-country regressions might not account for individual country effects which may affect poverty. Moreover, the log of population and openness to inter-national trade which they use as instruments of fiscal d ecentralization are likely to be correlated with both endogenous and dependent variables. This violates the exogenous hypothesis required for valid instrument and could possibly bias estimation results.
Does local heterogeneity matter in the relationship between fiscal decentralization, access to basic services and poverty?
The subsequent columns of Table 3 (columns 3 to 6 for MPIa and columns 9 to 12 for HPIn) report the indirect effect of local heterogeneity on access to basic services (MPIa) and poverty (HPIn). These estimations test whether the effect of fiscal d ecentralization o n M PIa d epends o n t he d egree o f the heterogeneity of demand.
Columns 3 and 5 show the estimation results with interaction of municipal revenue autonomy crossed with the ethnic fractionalization and polarization index respectively for MPIa and HPIn. Columns 4 and 6 present level vari-ables and interaction terms in the same specification f or e ach i ndex. The coefficient of interaction terms crossed with ethnic fractionalization is a neg-ative and significant at the 1 percent level (column 3 ). This suggests that in a less ethnically diverse départements, local authorities have a higher propen-sity to satisfy citizens in terms of access to basic services and reduce poverty. In fact, as the literature argues, ethnic diversity has a negative impact on
social cohesion and human development (Alesina et al., 1999). Therefore, the significant effect of heterogeneity of demand on MPIa can be explained by the fact that social cohesion helps to increase of cooperation and main-tain social pressure against corruption and elite capture. This provides local governments with more efficiency in the implementation of poverty reduction programs and facilitates their actions13. Another possible explanation is that local diversity can force local authorities to be more accountable to citizens. These findings are consistent with the results byMontalvo and Reynal-Querol
(2005) who find that fractionalization has an important effect on economic development. They find also however that, local ethnic polarization plays no significant role in the relationship between fiscal decentralization and service delivery.
Columns 9 to 12 report estimates for municipal revenue autonomy on HPIn using the same specifications as in columns 3 to 6. The coefficients of the interactive terms between municipal revenue autonomy and ethnic fraction-alization and polarization are negative, but not significantly different from zero at any reasonable level of significance (columns 9 and 11). These results are the same with the inclusion of ethnic fractionalization and polarization (columns 10 and 12). The estimated coefficients of the other control variables have the expected signs and plausible magnitudes. The coefficient associated with the share of the informal sector is positive and statistically significant for the MPI. This indicates that the informal activities negatively affect ac-cess to basic services. One explanation might be that informal activities
13For example, Alesina et al. (2003) point out the negative effect of ethnic
induce loss of revenue for local governments that could have been used for service delivery. However, the coefficients for informal sector are negative, but not significantly different from zero, when taking HPIn as the dependent variable. This means that informal activities increase the income of citizens. This result is intuitive and consistent with the context of developing coun-tries, because many local businesses are not registered, which are the main sources of citizens’ income. The coefficient for central government transfers is positive, and not significant, revealing the potential inefficiency of transfers from central government to local government. As argued in the literature, local authorities can divert transfers away from its centrally defined objec-tive for personal gain (Prud’homme,1995)14. The share of urban population shows the expected sign. Its coefficient is negative for both MPI and HPIn, suggesting that local governments with a large share of urban populations likely to improve access to basic services and reduce poverty15. In addition, time-varying département specific effects are controlled for. The reported coefficients are statistically different from zero for both of MPI and HPIn, increasing confidence in the econometric method.
In table 3, the analysis assumes that MPIa is a good proxy for households’ access to basic services, because by design this index represents the depriva-tion of citizens in several dimensions of poverty. The estimadepriva-tions show that municipal revenue autonomy has a positive and significant effect on MPIa.
14SeeSanogo and Brun(2016) for more arguments on the effectiveness of central
trans-fers.
Table 2: Effect of local revenue autonomy (LRA) on Multidimensional Poverty Index and Headcount poverty Index, GFE 2SLS estimation
Dependent variable Multidimensional Poverty Index Headcount poverty Index
GFE GFE_IV GFE_IV GFE_IV GFE_IV GFE_IV GFE GFE_IV GFE_IV GFE_IV GFE_IV GFE_IV
(1) (2) (3) (4) (5) (6) (7) (8) (9) (10) (11) (12) LRA -0.068*** -0.078*** -0.050*** -0.10*** -0.06*** -0.08** -0.16 -0.094** -0.11 -0.18 -0.13* -0.15 (0.011) (0.013) (0.01) (0.03) (0.01) (0.03) (0.01) (0.04) (0.09) (0.16) (0.079) (0.17) Central Transfers 0.029 0.032 0.002 0.007 0.013 0.016 -0.013 0.003 0.013 0.012 0.0057 0.0083 (0.0277) (0.0321) (0.0166) (0.0169) (0.0179) (0.0189) (0.0123) (0.0108) (0.0126) (0.00826) (0.0079) (0.007) Urban population -0.790*** -0.758*** -0.609*** -0.61*** -0.647*** -0.64*** -0.129 -0.119 -0.0620 -0.0715 -0.093 -0.12 (0.107) (0.118) (0.0925) (0.0976) (0.0902) (0.0949) (0.149) (0.147) (0.0751) (0.0603) (0.098) (0.099) Informal sector 1.064*** 1.165*** 0.704*** 0.664*** 0.869*** 0.871*** -0.573 -0.587 -0.00982 -0.0142 -0.062 -0.047 (0.338) (0.373) (0.216) (0.217) (0.219) (0.216) (0.550) (0.520) (0.158) (0.158) (0.17) (0.18)
Ethnic frag.*Local aut -0.029*** 0.0428 -0.0328 0.189
(0.0105) (0.0390) (0.0249) (0.190)
Ethnic frag. -0.337* -1.150
(0.178) (0.893)
Ethnic polarization -0.0101 0.009 0.021 0.075
(0.0119) (0.0321) (0.016) (0.10)
Ethnic pol*Local aut (0.113)-0.102 (0.43)-0.31
Group fixed effect 0.0662 -0.113*** -0.20*** -0.22*** -0.243*** -0.295** 0.589*** 0.515*** 0.249*** 0.298*** 0.43*** 0.49*** (0.112) (0.037) (0.034) (0.046) (0.076) (0.136) (0.043) (0.054) (0.08) (0.069) (0.06) (0.04) Constant -2.124*** -1.465*** -0.977*** -1.07*** -1.164*** -1.16*** -0.444 -0.00444 -0.323 -1.29*** -0.278 -0.61
Observations 250 182 147 147 147 147 250 182 147 147 147 147
R-squared 0.846 0.832 0.897 0.895 0.890 0.888 0.950 0.938 0.970 0.974 0.96 0.96
Hansen (p-value) 0.036 0.327 0.853 0.247 0.325 0.324 0.187 0.237 0.225 0.29 0.25 0.22
Cragg-Donald Wald F statistic 313.02 256.33 35.53 252.37 49.31 313.02 256.33 35.53 252.72 49.31
Anderson canon (P-value) 0.000 0.000 0.000 0.000 0.000 0.000 0.000 0.000 0.00 0.00
Départements FE Yes Yes Yes Yes Yes No Yes Yes Yes Yes Yes
Robust standard errors clustered at the départements level in parentheses / *significant at 10%; ** significant at 5%; *** significant at 1%
However, this result may hide considerable difference in the effect of LRA on the different dimensions of poverty (education, health, water-electricity-sanitation, and living standards). To explore this possibility, the contribution of each dimension in MPIa is calculated. Table 3 presents the results where each dependent variable represents the share of individuals deprived in 30 percent of the corresponding dimensions. One might think that there is a significant degree of correlation between control variables, such as the share of urban population and municipal revenue autonomy. In order to avoid the potential problem of multicolinearity resulting from this correlation, I regress only the municipal revenue autonomy on the MPIa for each dimen-sion (columns 1 and 3). The second specification for each dimension includes the lagged MPIa index to alleviate the potential intertemporal dependence between current decisions and previous level of deprivation. In the third column for each dimension, the benchmark specification (columns 2 and 8,
table 3) are replicated to control for endogeneity. Apart from access to water, the estimates of municipal revenue autonomy are significant f or education, health and living standard, however interesting differences in the magnitude of the coefficients are worth noting. First, it seems that local governments are more likely to increase access to education than to health. The coefficient for education is negative and significant at the 1 percent level of significance, and higher than that for health. It is easier for local governments to imple-ment programs for access to education, for example by constructing schools, than for health. The devolution of responsibilities in the health sector to municipalities is limited compared to education because of the sensitivity of this sector.
This result is consistent with Côte d’Ivoire’s circumstances, since the cen-tral government carries out functions such as licensing health professionals, registration and quality-control of drugs. The results (columns 7, 8, and 9) show that the effects of municipal revenue autonomy on access to water are not significant. A possible explanation is that, by design the index concerns the citizens’ access to tap water which is the responsibility of central govern-ment, which has field offices responsible for delivering water at local l evel. In columns 10, 11, and 12 about living standard, which includes cooking fuel, sanitation assets, floor, a nd e lectricity, t he r esults a re d ifficult t o interpret, since the exogenous instruments are not valid (the Hansen p-value=0.001). By design, these dimensions seem less affected by the actions of municipali-ties.
In order to identify more clearly the area on which local governments must focus on, the sample is divided into two subgroups: urban population and
Table 3: Effect of municipal revenue autonomy on Multidimensional Poverty Index by dimension, GFE 2SLS
Dependent variable : MPI_Education MPI_Health MPI_Water MPI_Living standard MPI by dimension GFE GFE GFE_2SLS GFE GFE GFE_2SLS GFE GFE GFE_2SLS GFE GFE GFE_2SLS
(1) (2) (3) (4) (5) (6) (7) (8) (9) (10) (11) (12) LRA -0.07*** -0.03*** -0.09*** -0.05** -0.04** -0.06** -0.05 0.001 -0.09 -0.09*** -0.02* -0.11*** (0.01) (0.008) (0.02) (0.02) (0.02) (0.02) (0.06) (0.02) (0.09) (0.029) (0.01) (0.02) lagMPI_Educ 0.59*** (0.08) lagMPI_Heath 0.04*** (0.0172) lagMPI_water 0.71*** (0.120) lagMPI_living 0.70*** (0.0746) Central Transfers 0.025 -0.03 -0.08 -0.0409 (0.03) (0.039) (0.13) (0.04) Urban population -0.43***(0.079) -0.31*(0.19) -2.66**(1.06) -1.15***(0.20) Informal sector 0.94** 0.24 1.82 2.36*** (0.40) (0.37) (2.110 (0.741) Constant -1.9*** -0.8*** -2.5*** -3.8*** -3.70*** -1.4*** -4.7*** -1.7*** -4.18** -1.76*** -0.45** -3.2*** Observations 277 276 182 277 276 182 235 213 163 277 276 182 R-squared 0.576 0.803 0.643 0.939 0.940 0.941 0.439 0.823 0.567 0.416 0.805 0.63 Hansen (P-value) 0.053 0.58 0.34 0.001
Cragg-Donald Wald F statistic 300.4 370.9 357.66 313.27 Anderson canon (P-value) 0.00 0.00 0.00 0.00 Départements FE Yes Yes Yes Yes Yes Yes Yes Yes Yes Yes Yes Yes
Robust standard errors clustered at the départements level in parentheses /* significant at 10%; ** significant at 5%; *** significant at 1%
rural population. The analysis is interested in whether deprived urban and rural populations respond differently to changes in municipal revenue auton-omy. All variables in table 3 are included in specification 2 and 3 respectively for rural and urban populations MPIa index. In table 4, the results are con-sistent with the previous findings, h owever t here i s a s ignificant difference between the two subgroups. The coefficients for municipal revenue auton-omy for rural populations are higher than those for urban populations. This suggests that local governments are more likely to reduce deprivation in ac-cess to public service for rural population than urban ones. This result is intuitive since urbanization increases the need of citizens. These needs may limit the effect of local governments.
Table 4: Effect of LRA on multidimensional poverty index by subgroup: urban and rural population
Dependent variable: MPIa
Rural Urban
MPIa for rural and urban area GFE GFE_2SLS GFE GFE_2SLS
(1) (2) (3) (4) LRA -0.0917** -0.133*** -0.130* -0.124** (0.0365) (0.0327) (0.0754) (0.0534) Central Transfers -0.0162 -0.0651 (0.0658) (0.112) Urban population -1.586*** -2.782*** (0.385) (0.499) Informal sector -0.252 0.490 (0.250) (1.274) Constant -0.442* 2.003*** -0.200 1.143 Observations 131 85 174 112 R-squared 0.881 0.933 0.220 0.745 Hansen (p-value) 0.953 0.349
Cragg-Donald Wald F statistic 99.06 198.31
Anderson canon (P-value) 0.00 0.00
Robust standard errors clustered at the départements level in parentheses / *significant at 10%; ** significant at 5%; *** significant at 1%
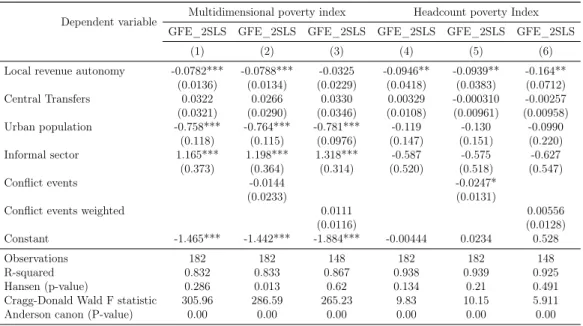
Does conflict a ffect a ccess t o s ervices a nd poverty?
Côte d’Ivoire experienced a conflict o ver t he p eriod b eing s tudied. I t is therefore reasonable to think that this context may have negatively affected the local government capacity to implement programs of poverty reduction and to increase access to public services. To deal with this possibility, the conflict effect is controlled for through an index represented by the number of conflict events weighted with a fatality index for each event by l ocality. The fatality index reports the number of deaths due to each event, it varies from one to 10 with 10 for the highest incidence of violence, and one the lowest. The estimated coefficients are negative and not statistically significant for both MPIa and HPIn (Table 5). This suggests that although conflict has a negative effect on poverty and access to public services, the effect is not statistically significant. T his u nexpected r esult c ould b e e xplained b y the fact the conflict was characterized by several short periods of conflict events with different intensity and location (See in Appendix). With the exception of Abidjan, the economic capital, the regions with a higher incidence of violence are concentrated in the rebel-held, northern and western parts of the country. Because the data mainly (approx. 80 percent) covers the southern regions, which have lower levels of conflict, i t d oes n ot a llow f or p roperly assessing the conflict e ffect. Note also that the conflict measures used in this analysis are not exhaustive. Further analysis should be based on household surveys.
Table 5: Effect of municipal revenue autonomy and conflict on access to basic service and poverty reduction
Dependent variable Multidimensional poverty index Headcount poverty Index GFE_2SLS GFE_2SLS GFE_2SLS GFE_2SLS GFE_2SLS GFE_2SLS
(1) (2) (3) (4) (5) (6)
Local revenue autonomy -0.0782*** -0.0788*** -0.0325 -0.0946** -0.0939** -0.164** (0.0136) (0.0134) (0.0229) (0.0418) (0.0383) (0.0712) Central Transfers 0.0322 0.0266 0.0330 0.00329 -0.000310 -0.00257 (0.0321) (0.0290) (0.0346) (0.0108) (0.00961) (0.00958) Urban population -0.758*** -0.764*** -0.781*** -0.119 -0.130 -0.0990 (0.118) (0.115) (0.0976) (0.147) (0.151) (0.220) Informal sector 1.165*** 1.198*** 1.318*** -0.587 -0.575 -0.627 (0.373) (0.364) (0.314) (0.520) (0.518) (0.547) Conflict events -0.0144 -0.0247* (0.0233) (0.0131)
Conflict events weighted 0.0111 0.00556
(0.0116) (0.0128)
Constant -1.465*** -1.442*** -1.884*** -0.00444 0.0234 0.528
Observations 182 182 148 182 182 148
R-squared 0.832 0.833 0.867 0.938 0.939 0.925
Hansen (p-value) 0.286 0.013 0.62 0.134 0.21 0.491
Cragg-Donald Wald F statistic 305.96 286.59 265.23 9.83 10.15 5.911
Anderson canon (P-value) 0.00 0.00 0.00 0.00 0.00 0.00
Robust standard errors clustered at the départements level in parentheses / *significant at 10%; ** significant at 5%; *** significant at 1%
Are the instruments valid and relevant?
A relevant econometric issue when addressing endogeneity is whether the excluded exogenous variables are valid instruments. In order to address this issue, for all specifications, the p-value for the Hansen over-identification test is reported. The null hypothesis is that the excluded exogenous variables are valid. The reported Hansen p-values are higher than the 5 percent con-ventional level of significance, which suggests that these variables satisfy the requirement for valid instruments and are not uncorrelated with the depen-dent variables. Another issue is whether the instruments are significant in explaining the extent of local revenue autonomy. The reported Anderson
Canon p-values confirm that the instruments explain significantly the fiscal decentralization measured here by local revenue autonomy. The instruments are globally relevant. The statistical significance of the coefficients on the excluded variables in the first-stage estimates was derived16.
Robustness checks
The benchmark results (column 2, Table 2) are not sensitive to the inclusion of other covariates such as the heterogeneity measures and the conflict vari-ables. For example, the effect of local revenue on MPIa does not disappears no matter which measure of heterogeneity is included in the regression and the statistical significance remains for almost all specifications (columns 3 to 6, Table 3). However, this statistical significance does not hold in many specifications for the effect on HPIn (columns 7 to 12, table 3). The analysis goes further by examining whether the 2007 peace agreement signing boosted the implementation program of public services delivery, which may not have been fully captured by grouped fixed effect. I proceed by dividing the sam-ple into two sub-samsam-ple periods: 2001-2006 and 2007-2011 and replicate the specification of table 3. This does not alter the previous findings. Munici-pal revenue autonomy positively affects access to public services across the two sub-periods. However, the results suggest that the effect is higher for the period (2007-2011), after the signing of the agreement, than the period before the signing (2001-2007) (Table 6). In Côte d’Ivoire, the 2007 peace agreement was signed by all political parties in the country, and marked the
end of tension. Both sides agreed to a free and fair general election to be held in 2008. This event might have induced a change in the behavior of local governments.
Table 6: Effect of local revenue autonomy (LRA) on Multidimensional Poverty Index (MPI), before and after the 2007 peace agreement signing, GFE 2SLS estimation
Dependent Before 2007 Peace agreement After 2007 Peace agreement
variable GFE GFE GFE_2SLS GFE_2SLS GFE GFE GFE_2SLS GFE_2SLS
(1) (2) (3) (4) (5) (6) (7) (8) Local Revenue A. -0.0434** -0.0596** -0.0783*** -0.0682** -0.0761*** -0.0851*** -0.102*** -0.120*** (0.0213) (0.0228) (0.0266) (0.0321) (0.0181) (0.0205) (0.0270) (0.0424) Central Transfers -0.00603 -0.0108 -0.0582 -0.0111 -0.0242 -0.0374 (0.0498) (0.0509) (0.0498) (0.0548) (0.0522) (0.0687) Urban population -0.784** -0.794*** -0.745*** -0.827*** -1.164*** -0.856*** (0.292) (0.287) (0.251) (0.275) (0.298) (0.258) Informal sector 0.383 0.378 0.770 0.884** 1.045 0.814 (0.538) (0.654) (0.652) (0.380) (0.705) (0.668)
Ethnic frag.*Local aut -0.00206 0.0170
(0.0243) (0.0198)
Group fixed effect 0.801*** 0.342 0.355** 0.351** 0.574*** 0.00975 0.164 -0.0156 (0.225) (0.329) (0.150) (0.145) (0.183) (0.223) (0.150) (0.148) Constant -1.899*** -1.368** -0.919** -1.037** -1.557*** -1.473*** -0.918** -0.546
Observations 172 159 120 99 105 91 62 48
R-squared 0.735 0.817 0.790 0.795 0.772 0.886 0.845 0.826
Hansen (p-value) 0.359 0.106 0.0068 0.42
Cragg-Donald Wald F statistic 185.77 69.319 60.205 14.54
Anderson canon (P-value) 0.00 0.00 0.00 0.00