HAL Id: inserm-00691443
https://www.hal.inserm.fr/inserm-00691443
Submitted on 26 Apr 2012
HAL is a multi-disciplinary open access
archive for the deposit and dissemination of
sci-entific research documents, whether they are
pub-lished or not. The documents may come from
teaching and research institutions in France or
abroad, or from public or private research centers.
L’archive ouverte pluridisciplinaire HAL, est
destinée au dépôt et à la diffusion de documents
scientifiques de niveau recherche, publiés ou non,
émanant des établissements d’enseignement et de
recherche français ou étrangers, des laboratoires
publics ou privés.
virulence.
Ayala Tovy, Rivka Hertz, Rama Siman-Tov, Sylvie Syan, Daniela Faust,
Nancy Guillen, Serge Ankri
To cite this version:
Ayala Tovy, Rivka Hertz, Rama Siman-Tov, Sylvie Syan, Daniela Faust, et al.. Glucose starvation
boosts Entamoeba histolytica virulence.. PLoS Neglected Tropical Diseases, Public Library of Science,
2011, 5 (8), pp.e1247. �10.1371/journal.pntd.0001247�. �inserm-00691443�
Virulence
Ayala Tovy1, Rivka Hertz1, Rama Siman-Tov1, Sylvie Syan2,3, Daniela Faust2,3, Nancy Guillen2,3, Serge Ankri1*
1 Department of Molecular Microbiology, The Bruce Rappaport Faculty of Medicine, Technion, Israel, 2 Institut Pasteur, Unite´ Biologie Cellulaire du Parasitisme, Paris, France,3 Inserm, U786, Paris, France
Abstract
The unicellular parasite, Entamoeba histolytica, is exposed to numerous adverse conditions, such as nutrient deprivation, during its life cycle stages in the human host. In the present study, we examined whether the parasite virulence could be influenced by glucose starvation (GS). The migratory behaviour of the parasite and its capability to kill mammalian cells and to lyse erythrocytes is strongly enhanced following GS. In order to gain insights into the mechanism underlying the GS boosting effects on virulence, we analyzed differences in protein expression levels in control and glucose-starved trophozoites, by quantitative proteomic analysis. We observed that upstream regulatory element 3-binding protein (URE3-BP), a transcription factor that modulates E.histolytica virulence, and the lysine-rich protein 1 (KRiP1) which is induced during liver abscess development, are upregulated by GS. We also analyzed E. histolytica membrane fractions and noticed that the Gal/GalNAc lectin light subunit LgL1 is up-regulated by GS. Surprisingly, amoebapore A (Ap-A) and cysteine proteinase A5 (CP-A5), two important E. histolytica virulence factors, were strongly down-regulated by GS. While the boosting effect of GS on E. histolytica virulence was conserved in strains silenced for Ap-A and CP-A5, it was lost in LgL1 and in KRiP1 down-regulated strains. These data emphasize the unexpected role of GS in the modulation of E.histolytica virulence and the involvement of KRiP1 and Lgl1 in this phenomenon.
Citation: Tovy A, Hertz R, Siman-Tov R, Syan S, Faust D, et al. (2011) Glucose Starvation Boosts Entamoeba histolytica Virulence. PLoS Negl Trop Dis 5(8): e1247. doi:10.1371/journal.pntd.0001247
Editor: Alok Bhattacharya, Jawaharlal Nehru University, India
Received September 17, 2010; Accepted June 4, 2011; Published August 2, 2011
Copyright: ß 2011 Tovy et al. This is an open-access article distributed under the terms of the Creative Commons Attribution License, which permits unrestricted use, distribution, and reproduction in any medium, provided the original author and source are credited.
Funding: This study was supported by grants to SA from the Israel Science Foundation, the Israel Ministry of Health, the Rappaport Family Institute for Research in the Medical Sciences, and the Deutsche Forschungsgemeinschaft (DFG) and from the French National Research Agency grant (Intestinalamibe) to NG. The funders had no role in study design, data collection and analysis, decision to publish, or preparation of the manuscript.
Competing Interests: The authors have declared that no competing interests exist. * E-mail: [email protected]
Introduction
Amebiasis is a parasitic infection that is caused by the unicellular protozoa, Entamoeba histolytica. The disease has a worldwide distribution with substantial morbidity and mortality, and is one of the three most common causes of death from parasitic disease [1]. The main clinical manifestations of amebiasis are colitis and liver abscesses. Pathogenesis of E. histolytica involves adherence, penetration into host tissues, and destruction of host cells. These processes are mediated by the ameba key virulence factors galactose/N-acetylgalactosamine (Gal/GalNAc) lectin, amoebapore (AP) and cysteine proteinases (CP). Host cell destruction is initiated upon trophozoites binding of the target cells. An important molecule involved in this process is the galactose/N-acetylgalactosamine-inhibitable lectin [2]. This mol-ecule is composed of two subunits; the 170 kDa heavy chain, which is responsible for the cell and carbohydrate binding activity of the lectin complex, and the 31–35 kDa light chain that has a structural role and participates in membrane anchoring of the complex [3]. It is believed that adherence of the parasite to the host gut cells is followed by the release of APs, which are a family of at least three small peptides capable of forming pores in lipid bilayers [4]. Other factors that play an important role in the Entamoeba pathogenesis are the CPs. These enzymes are released
by the parasite, to disrupt the intestinal mucus and the epithelial barrier and to facilitate the tissue penetration by the trophozoites [5,6]. The life cycle of the parasite consists of two stages: the infective cyst and the invasive trophozoite. During its progression through its life cycle in the host, the parasite is exposed to different environmental stresses which are the direct consequence of the host immune defence, or metabolic modifications and changes in the bacterial intestinal flora [7]. Whereas the physiological and molecular changes in E. histolytica following their exposure to oxidative and nitrosative stress(es) [8,9,10,11], heat shock [12,13], and bacterial flora [14,15,16] have been well investigated over the past ten years, information about the effects of metabolic stress in this parasite is lacking. E. histolytica relies solely on glycolysis and fermentation and lacks the tricarboxylic acid cycle and the mitochondrial electron chain reactions. Energy is mainly obtained from glucose fermentation, producing carbon dioxide, acetate and ethanol. Glucose starvation (GS) is a widely studied metabolic stresses in pathogens. It has been investigated in the malaria parasite Plasmodium falciparum. Interestingly, the PfEMP (var) genes, key components in malaria pathogenesis, account among the genes up-regulated by GS [17]. Recently, we found that in E. histolytica, GS leads to the accumulation of the glycolytic enzyme enolase in the nucleus and to the inhibition of the DNA and tRNA methyltransferase 2 (Dnmt2) nuclear activity [18]. In addition, GS
triggers the in vitro differentiation of Entamoeba invadens trophozoites into cysts [19], a finding potentially relevant for E. histolytica. Here, we describe data on the effects of GS on the physiology of the parasite. We report that GS is a positive regulator of E. histolytica virulence. To the best of our knowledge, this is the first evidence that supports a role of a metabolic stressor in the modulation of E.histolytica virulence.
Methods
Growth of Entamoeba histolytica
Trophozoites of the E. histolytica strain HM1:IMSS were grown under axenic conditions in Diamond’s TYI-S-33 medium at 37uC. Trophozoites in the exponential phase of growth were used in all experiments. For the GS assays, trophozoites were washed three times with PBS, and then incubated for 12 hours in glucose-free Diamond’s TYI-S-33 medium. Recovery was done by adding 1% glucose to the GS parasites for an additional 12 hours in the same medium.
Construction of sense and antisense KRiP1
For the construction of the antisense plasmid, KRiP1 was amplified by PCR from genomic DNA using the primers KRIP S and KRIP AS (Table1). The resulting 1500 bp PCR product was cloned into the T Easy vector (Promega) to give pGEM-KRiP. For the construction of the control sense KRiP1 plasmid, KRiP was amplified from pGEM-KRiP with the primers KRiP Bgll II and KRIP AS and subcloned into the pGEM-T Easy vector (Promega) to give pGEM-sense KRiP. Next, BglII/NotI-digested pGEM-KRiP and pGEM-sense KRiP were subcloned into BglII/ NotI-digested pSA8 plasmid [20]. The resulting plasmids contain the complete coding region of KRiP1 in the antisense or in the sense orientation, respectively, between 59 and 39 untranslated regions of the E.histolytica gene coding for ribosomal protein RP-L21 [20–21].
Measurement of cytopathic activity
The rate of cultured HeLa cell monolayers destruction by trophozoites that were grown in either control or glucose-free
medium was determined using a previously described protocol [22]. Briefly, E. histolytica trophozoites (2.56105or 105per well) were incubated with HeLa cell monolayers in 24-well tissue culture plates at 37uC for 60 minutes. The incubation was stopped by placing the plates on ice and unattached trophozoites were removed by washing the plates with cold Phosphate Buffer Saline (PBS). HeLa cells remaining attached to the plates were stained with methylene blue (0.1% in 0.1 M borate buffer, pH 8.7). The dye was extracted from the stained cells by 0.1 M HCl, and its color intensity was measured spectrophotometrically at OD660.
Hemolytic activity
The hemolytic activity of trophozoites that were grown in either control or glucose-free medium was determined using a previously described protocol [22]. Briefly, Human red blood cells were collected in heparin and then washed three times in PBS. The assay was performed by mixing 2.56105trophozoites that had been grown in either control or glucose-free medium with 56108red blood cells in 1 ml PBS at 37uC for 60 min. Samples of these mixtures were taken at 30 and 60 minutes. The cell suspension was rapidly sedimented (6000 rpm for 5 seconds), and the amount of hemoglobin in the supernatant was determined spectrophotemetrically at OD570.
Adhesion assay
The adhesion of trophozoites that were grown in either control or glucose-free medium to an HeLa cell monolayers was measured using a previously described protocol [23]. Briefly, trophozoites (26105) were added to wells that contained fixed HeLa monolayers in 1 ml of Dulbecco’s modified Eagle’s medium (DMEM) without serum, and incubated at 37uC for 30 minutes. The number of adherent trophozoites was determined by counting under a light microscope the trophozoites that remained attached to the HeLa cells after gentle decanting (twice) of the non-adherent trophozoites with warmed (37uC) DMEM.
Transwell migration assays
Transwell migration assays were performed in 5 mm transwell inserts (8mm pore size Costar) suspended by the outer rim within individual wells of 24-well plates using a previously described protocol [24]. Briefly, E. histolytica trophozoites that were grown in either control or glucose-free medium, were first washed three times in Diamond’s TYI-S-33 medium without serum, and then suspended at a concentration of 26105trophozoites/ml in serum-free medium. A 500-ml aliquot of the suspension was then loaded into the upper chamber of the transwell inserts, which were then placed in anaerobic bags (Mitsubishi Gas Chemical Company, Inc., Tokyo, Japan), and incubated at 37uC for three hours. At the end of the incubation, the inserts and media were removed, and trophozoite migration was determined by counting the number of trophozoites that were attached to the bottom of the well.
Viability assay under heat shock and oxidative stress
Trophozoites (16106) were exposed to a temperature of 42uC or to 2.5 mM in hydrogen peroxide (H2O2). After 1, 1.5, 2 and
2.5 hours of incubation, an aliquot of the culture was stained with eosin (0.1% final concentration), and the number of living trophozoites were counted in a counting chamber under a light microscope (Bausch and Lomb).
Stable isotope labeling by peptide dimethylation for quantitative proteomic analysis
Entamoeba histolytica trophozoites (107) that were grown in either control or glucose-free medium for 12 hours were harvested and
Author Summary
During infection, pathogens are exposed to different environmental stresses that are mostly the consequence of the host immune defense. The most studied of these environmental stresses are the response of pathogens to nitric oxide and to hydrogen peroxide, both produced by phagocytes. In contrast, the overall knowledge about the response of pathogens to metabolic stresses is scanty. Amebiasis is caused by the unicellular protozoan parasite Entamoeba histolytica, and has a worldwide distribution with substantial morbidity and mortality. During its journey in the host, the parasite is exposed to the host immune system and to variations in nutrient availability due to the host nutrition status and the competition with the bacterial flora of the large intestine. How E. histolytica responds to glucose starvation (GS) has never been investigated. Here, the authors report that the parasite virulence is boosted by GS. Paradoxically, two well accepted virulence factors, the amoebapore A and the cysteine protease A5 are less abundant in the glucose-starved parasites. This Accordingly, these proteins are not required for the boosting of the E. histolytica virulence, in contrast to KRiP1 and LgL1 that seem to be involved in this phenomenon.
lysed in 300mL 1% octyl b-D-glucopyranoside (Sigma-Aldrich) on ice for 20 minutes with regular shaking. Crude extracts were centrifuged at 13000 rpm at 4uC for 10 minutes, supernatants were removed, and the protein amounts of in the lysate were quantified using the Bradford method [25]. Usually 4 mg of protein were recovered and 100mg of total cell lysate was used for the labeling in two independent experiments. Urea (8M) was then added to the proteins followed by their reduction with 3 mM DTT at 60uC for 30 minutes. Trypsinization of proteins was carried out overnight at 37uC in 10 mM ammonium bicarbonate containing modified trypsin (Promega) at a 1:50 enzyme-to-substrate ratio, overnight at 37uC. A second step of trypsinization was done by adding another portion of trypsin and incubating at 37uC for 4 hr. The tryptic peptides were desalted using C18 tips (Harvard Inc.), dried and resuspended in 50 mM Hepes (pH 6.4). Labeling by dimethylation was done in the presence of 100 mM NaCBH3
(Sterogene). Peptides from the control samples were labeled with light formaldehyde (35% Frutarom) and peptides from glucose starvation samples were labeled with heavy formaldehyde at a final concentration of 200 mM (20% w/w, Cambridge Isotope laboratories). After 1 hour incubation at room temperature, the pH was raised to 8 and the reactions were further incubated for 1 hour. Neutralization was done with 25 mM ammonium bicarbonate for 30 minutes and equal amounts of the ‘‘light’’ and ‘‘heavy’’ peptides were mixed, cleaned on C18 tips and re-suspended in 0.1% formic acid. The combined labeled peptides were separated in an on-line two-dimensional chromatography (MuDPiT). First the peptides were loaded on a 15 mm of BioX-SCX column (LC Packing) and eluted with 10 salt steps of 0, 30, 60, 80,100, 120, 160, 200, 300, 500 mM ammonium formate in 5% ACN and 0.1% formic acid, pH 3. The eluted peptides were further resolved by capillary reverse-phase chromatography (20 cm fused silica capillaries, J&W self-packed). The peptides were eluted using a 125 min gradient (5% to 40% acetonitrile containing 0.1% formic acid) followed by a wash step of 95% acetonitrile for 15 min. The flow rate was about 0.25ml/min and the peptides were analysed using an Orbitrap mass spectrometer (Thermo-Fischer). Protein identification was performed at the Smoler Proteomics Center, Technion (http://biology.technion.ac. il/proteomics/index.htm). Mass spectrometry (MS) was done in a
positive mode using repetitively full MS scan followed by collision induced dissociation (CID) of the 7 most dominant ions selected from the first MS scan. The MS data were analyzed and compared using the Sequest 3.31 (Thermo). Identification of proteins with significant changes in their abundance level was based on searching with the ProtScore program, with a cut-off at 2.0 fold, searching in the E. histolytica genome NZ_AAFB00000000 part of the NR-NCBI data base.
Fractionation of trophozoites
Nuclear and cytoplasmic fractions of E.histolytica trophozoites were prepared using a previously described protocol [21]. Proteins were separated on 12% polyacrylamide SDS-PAGE gels, and then transferred to a nitrocellulose membrane. Membranes were stained with Ponceau S (Sigma) to verify the efficiency of the transfer. The blots were then blocked with 3% skim milk in PBS, and then incubated with a monoclonal antibody against actin (1:1000, Santa-Cruz), a polyclonal antibody against E. histolytica amoebapore A (Ap-A) (1:500) (kindly provided by Prof. Mirelman, Weizmann Institute, Israel), and a polyclonal antibody against E. histolytica KRiP1 (1:1000) raised in this work by three immuniza-tions of two rabbits with a unique synthetized peptide (amino acids 82 to 108, EQSTKAPAGDKVINLD). After incubation with the first antibody, the blots were then incubated with a secondary antibody (1:10000) (horseradish peroxide-conjugated goat anti-rabbit) antibody, Jackson ImmunoResearch), and immune com-plexes were detected by enhanced chemiluminescence.
Preparation of membrane fraction
Trophozoites were harvested by centrifugation, washed 3 times in PBS, resuspended in 300ml 100 mM NaCl and subjected to four cycles of freezing at -70uC and thawing. The samples were centrifuged at 800 g for 15 minutes and supernatants were collected and centrifuged at 10000 g for 1 hour. The Pellets were resuspended in 15ml PBS.
RT-PCR analysis
Total RNA was extracted from trophozoites using a TRI-reagent solution (Sigma). Reverse transcription was performed with the EZ-First Strand cDNA Synthesis Kit for RT-PCR Table 1. Oligonucleotides used in this study.
Accession number Primer name Sequence
X70851 AP-A 59 AAACATATCTTACAAACAATC X70851 AP-A 39 GAGTTTATCAATTCCAAAAT EHI_130700 Enolase 922 59 AATAAATTCACTGTTGAACATGGTAAT EHI_130700 Enolase 39 TTAAGCAGTTGAATTTCTCCAGTT X91644.2 CP-A5 sense CTGAATATTGGATTGTTAGAAATTCAT X91644.2 CP-A5 anti sense AAGCATCAGCAACCCCAACTGGA M96024 LgL1 sense CTCTAGAGACATCTAAAATATTGTC M96024 LgL1 anti sense GGAGATCTGAATTGCATAACTTGTGTACAT AF291721 URE3-BP sense ACTTCTCTCTGTTATTACACAGACAGACTTT AF291721 URE3-BP anti sense ACCAAAAATGAAATTTTTATTTATTC EHI_091570 HSP bis70 59 TAAGAAGAGTGGCAAAAAGAGTATTG EHI_091570 HSP 70 39 TGTATTCTACTTCAATTAATGGTTTAT EHI_096350 KRiP S ATGGTACCATGTTTATCTTTTATTA EHI_096350 KRiP AS ATAGATCTTTAAATCTTAACTTGATT doi:10.1371/journal.pntd.0001247.t001
(Biological Industries, Beit Haemek, Israel), according to the manufacturer’s instructions. The primers that were used to amplify Ap-A, LgL1, CP-A5, URE3-BP, enolase encoding genes and rDNA are listed in Table 1. The PCR products were resolved on 1% agarose gels, and then stained with 0.5mg/ml ethidium bromide (aMReSCO). Densitometry analysis of the stained PCR products was done using the TINA software (http://www.tina-vision.net).
Northern blot analysis
Total RNA was prepared using the RNA isolation kit TRI Reagent (Sigma). RNA (10mg) was size-fractionated on a 4% polyacrylamide denaturing gels containing 8 M urea and subsequently blotted to a GeneScreen membranes (NEN Bio-products, Boston, MA). Hybridizations under stringent conditions were carried out overnight at 65uC in hybridization buffer (0.5 M Na-phosphate (pH 7.2), 7% SDS, 1 mM EDTA and 50mg per ml hybridization buffer of salmon sperm DNA with the following DNA probes (0.004mg/ml): Ap-A, CP-A5, URE3-BP and HSP 70. The membrane was then washed at 65uC for 20 min with washing buffer 1 (5% SDS, 40 mM Na-phosphate (pH 7.2), and 1 mM EDTA), followed by three washes of 30 min each wash at 65uC with washing buffer 2 (1% SDS, 40 mM Na-phosphate (pH 7.2), and 1 mM EDTA). Probes were randomly labeled with P32 dCTP (Amersham) using a DNA labeling kit (Biological Industries).
Hepatic abscess formation
Animal handling and experimentation were conducted accord-ing to the European Union and the Pasteur Institute approved protocols. Four-week-old male Syrian golden hamsters (Mesocricetus auratus), with a weight ranging from 90 to 100 g, were inoculated by the intraportal route [26,27] with 106 sense or anti-sense KRiP1 trophozoites. Two independent experiments were per-formed, with 3 animals for each amoeba type per experiment; thus, a total of 12 hamsters were used for this evaluation. (Six animals by experiment and conditions were used; in total, 12 hamsters were included in this evaluation. Treatment of animals and surgical procedures were done according to published methods. From 7 days post-infection, hamsters were sacrificed, livers removed). Livers were isolated 7 days after infection and treated for histological analysis. Serial (five-micron) lobe sections were stained with Harris’ haematoxylin, periodic acid-Schiff reagent. Immunohistochemistry was performed on sections from different livers using an anti-Gal/GalNAc lectin monoclonal antibody CD6 (a total of 31 tissue sections were analysed).
Results
1- The effect of GS on the resistance of E.histolytica to HS and oxidative stress
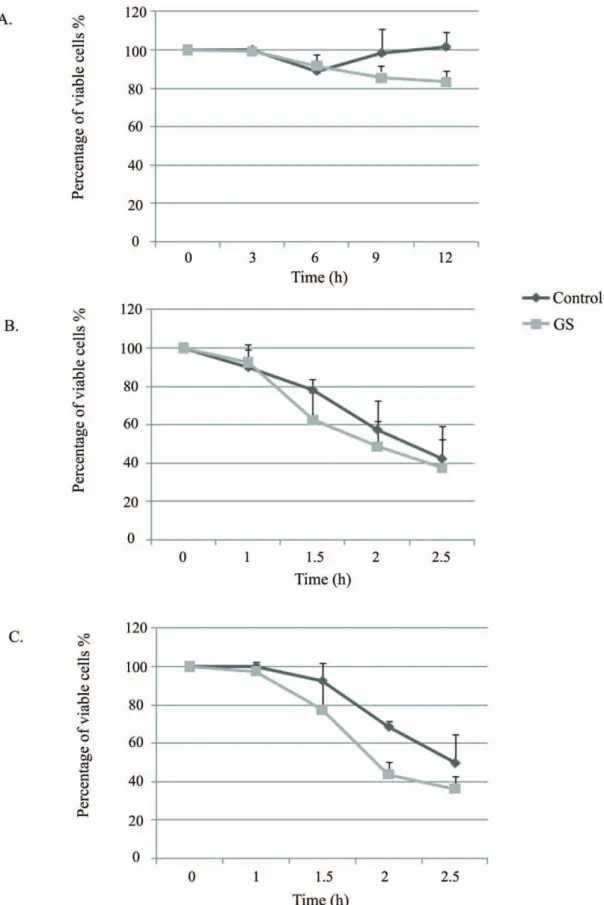
Entamoeba histolytica trophozoites were glucose-starved for a period of twelve hours and the effect of glucose starvation (GS) on their viability was determined (Fig. 1A). Up to a period of six hours, GS has no significant effect on the viability of the trophozoites. Between 6 hours and 12 hours, a slightly lower viability (17%) was observed for the glucose-starved trophozoites when compared to the viability of parasites cultivated in the presence of glucose. A longer GS (more than 24 hours) led to significant parasite death [18]. Consequently, we used 12 hours of GS for all subsequent experiments.
The induction of stress responses is important for the adaption of cells to environmental changes following stress [28]. Conse-quently, we examined the resistance of glucose-starved
trophozo-ites to heat shock and to oxidative stress. No significant difference in the resistance of starved and control trophozoites to heat shock was observed (Fig. 1B). In contrast, the glucose-starved parasites were slightly more sensitive to oxidative stress when compared to the sensitivity of control trophozoites grown in presence of glucose (Fig. 1C). In addition, the expression of heat shock protein 70 (HSP70) expression was not up-regulated by GS (Table S1). These results indicate that GS does not induce a protective response against distinct stresses.
2- The effect of GS on E. histolytica virulence
The effect of GS on E. histolytica virulence has never been investigated. Since E. histolytica trophozoites have the capacity to lyse human erythrocytes [29], we compared the capacity of E. histolytica to lyse human erythrocytes [29] (hemolytic activity) of control and glucose-starved trophozoites as one of the measures of their virulence. We found that the hemolytic activity of glucose-starved trophozoites was nearly twice as high (1.7 fold) as that of the control trophozoites (Fig. 2A). Since the parasite is also able to disrupts monolayers of cultured mammalian cells, such as Baby Hamster Kidney (BHK) or HeLa cells [30], we compared the cytopathic activity of control and glucose-starved E. histolytica trophozoites as a second measure of virulence. We found that the cytopathic activity of glucose-starved trophozoites was significantly higher than that of the control trophozoites (Fig. 2B). Moreover, the cytopathic activity of the glucose-starved trophozoites can be restored to that of the control trophozoites upon their re-incubation in a glucose-containing culture medium for 12 hours (Fig. 2B). Since the cytopathic process is initiated by the parasite binding to its target cells [31], we then compared the ability of control and glucose-starved E .histolytica trophozoites to adhere to HeLa cells. We found that the binding of the glucose-starved trophozoites was more than twice as high as that of the controls trophozoites (Fig. 2C). During invasive amebiasis, migration is an essential process; Therefore, we compared the migration of control and glucose-starved E. histolytica trophozoites through 8mm pores. We found that the numbers of glucose-starved trophozoites that passed through the pores was considerably greater than then number of control trophozoites (Fig. 2D). Collectively, these results indicate that GS is a positive regulator of E. histolytica virulence.
3- Quantitative proteomic analysis of glucose-starved trophozoites
To gain insight into the mechanism by which GS enhances the virulence of E. histolytica, we compared changes in the protein composition of control and glucose-starved trophozoites, using stable isotope labeling (Table 2 and 3). In this high throughput proteomics analysis, total protein extracts from E. histolytica trophozoites grown in complete TYI media or in GS medium was compared to total lysate from E. histolytica grown in GS media (as described in Materials and methods). Proteins were identified using Mass spectrometry (MS) and identification of proteins was achieved by a minimum of three peptides. Forty-nine proteins with at least a two-fold change in their abundance were detected. Of these, 29 proteins were more abundant (Table 2) and 20 proteins were less abundant in the glucose-starved trophozoites when compared to the equivalent proteins in the controls trophozoites (Table 3). We classified the corresponding genes according to their functions using the Pfam classification (Fig. 3A). An interesting feature that we observed for glucose-starved trophozoites was a decrease in the amount of proteins that were associated with metabolism (Fig. 3A; lower panel). These proteins are mostly associated with the fatty acid pathway. The induction of the gluconeogenic pathways is a common response to GS [32]. We
Figure 1. The effect of GS on the resistance ofE.histolyticato HS and oxidative stress. The viability of trophozoites grown in glucose-free Diamond’s TYI-S-33 media for 12 hours (A), subjected to heat shock at 42uC (B) and to oxidative stress (2.5 mM H2O2) (C) was measured and
compared to control trophozoites grown in complete Diamond’s TYI-S-33 medium. The number of trophozoites at the beginning of each experiment was taken as 100%. Data are expressed as the mean and standard deviation of three independent experiments that were repeated twice with a P-value ,0.05.
found that a protein that shares a short homology to glycerol-3-phosphate dehydrogenase (EHI_161020) was one of the most highly enriched in the glucose-starved trophozoites. An interesting feature of the response to GS is the increase in proteins that are involved in protein synthesis, especially the 60S and 40S ribosomal proteins (Fig. 3A; upper panel). Several other abundant proteins in the glucose-starved trophozoites may play a role in the boosting of E.histolytica virulence. One of them is the transcription factor Upstream Regulatory Element 3-Binding Protein (URE3-BP). The enrichment of URE3-BP upon GS treatment correlates with a higher amount of URE3-BP transcripts in the glucose-starved parasite compared to control trophozoites (Fig. 3B). URE3-BP is a calcium-responsive transcription factor that is known to modulate the transcription of two E. histolytica genes encoding virulence-related factors, the Gal/GalNAc lectin subunit HgL5 and ferredoxin [24]. Further proteins that may play a role in the boosting of E. histolytica virulence under GS are proteins encoded by genes up-regulated in trophozoites isolated from hamster liver abscesses [33] such as the 20 kDa antigen (EHI_056490) and the lysine-rich proteins, KRiP1 (EHI_096350) and KRiP3 (EHI_110740) (Table 2 and [33]). The increased abundance of KRiP1 observed in the proteomic analysis was confirmed by Western blot analysis (Fig. 3C). An unexpected result of the
proteome analysis is the lower abundance of proteins associated with virulence in the glucose-starved E.histolytica trophozoites compared to control trophozoites (Table 3). These proteins include the key virulence factors Ap-A and CP-A5. The lower abundance of Ap-A in glucose-starved trophozoites was confirmed by Western blot analysis (Fig. 3C). This result correlates with a lower amount of Ap-A transcripts in the glucose-starved parasites compared to control trophozoites (Fig. 3B). About CP-A5, its lower abundance observed by the proteomic analysis (Table 3) correlates with a lower amount of CP-A5 transcript (Fig. 3B).
4- Physiological analysis of trophozoites down-regulated for the expression of KRiP1
KRiP1 is one of the proteins whose abundance is the most enhanced by GS (Table 2 and Fig. 3C). Moreover, the up-regulation of KRiP1 gene expression in trophozoites isolated from hamster liver abscesses points towards an involvement of this protein in the regulation of E. histolytica virulence [33]. These observations suggest an implication of KRiP1 in the mechanism accounting for the exacerbation of amoebic virulence under GS. To test this hypothesis, the expression of KRiP1 was down-regulated using the antisense technology. For this purpose, trophozoites were transformed with a plasmid that includes the
Figure 2. The effect of GS on virulence. The hemolytic activity (A), and the cytopathic activity (B), adhesion (C) and mobility (D) of E.histolytica trophozoites were examined. Control cells were grown in complete TYI medium, while the glucose-starved trophozoites were grown in glucose-free TYI for 12 hours. The respective value of the control for each activity was taken as 100%. Data are expressed as the mean and standard deviation of three independent experiments that were repeated twice with a P-value ,0.05.
krip1 gene in the antisense orientation between the 59 and 39 untranslated regions (UTRs) of the E. histolytica gene coding for ribosomal protein RP-L21 (Ehg34) [20–21]. As a control, trophozoites were transformed with a plasmid that includes the krip1 gene in the sense orientation. It is important to note that the Ehg34 59 UTR does not allow the translation of an mRNA that has been expressed under its control [34]. The amount of KRiP1 in trophozoites transformed with the krip1 gene sense or antisense construct was determined by Western blot analysis (Fig. 4A). The KRiP1 antisense strain contained three times less amount of KRiP1 compared with those found in the KRiP1 sense strain. No significant difference in the growth rate of KRiP1 sense and antisense trophozoites cultivated in standard TYI-33 media was observed (data not shown). In addition, no difference in the viability of KRiP1 sense and antisense transformants exposed to
GS was observed (data not shown). These results indicate that KRiP1 is not essential for the parasite survival under GS.
We then compared the cytopathic activity of E. histolytica krip1 sense and antisense trophozoites cultivated in standard TYI-33 media. The cytopathic activity of E.histolytica trophozoites expressing the antisense KRiP1 vector was 25% lower compared to that of the control (Fig. 4B). Under conditions of GS, the boosting effect on the cytopathic activity was observed for the KRiP1 sense trophozoites but did not occur for the KRiP1 antisense parasites (Fig. 5). This result suggests that KRiP1 is involved in the mechanism that up-regulated the cytopathic activity of E. histolytica under GS. We further analyzed the consequences of krip1 gene expression levels on the amoebic liver abscess formation by intraportal infection of hamsters with KRiP1 sense or anti-sense trophozoites. Two independent experiments Table 2. Quantitative proteomic analysis of proteins with increased abundance following glucose starvation.
Accession Pathema Accession GI Ppro pepCount mean H/L Protein Name Domain of interest EHI_161020 67466970 3.63E-04 3 13.30 hypothetical protein Glycerol-3-phosphate
dehydrogenase EHI_096350 67483266 2.57E-04 3 12.91 hypothetical protein Lysine-rich protein KRiP1 EHI_035430 67481531 5.06E-08 6 7.28 hypothetical protein
EHI_194520 67478606 4.17E-11 7 5.59 hypothetical protein RRN7/LIM domains EHI_153080 67464228 3.14E-08 9 5.48 60S ribosomal protein L24
EHI_114350 67465341 7.49E-05 4 4.79 hypothetical protein SIR2 family
EHI_156420 67474310 1.91E-09 6 4.34 hypothetical protein Calponin homology domain EHI_104600 67464911 4.37E-09 3 4.32 13 kDa
ribonucleoprotein-associated protein
EHI_140650 67477494 2.14E-07 3 3.51 transcription enhancer protein
EHI_086230 67474712 1.22E-05 3 3.12 hypothetical protein V-type H+-transporting ATPase subunit G EHI_092120 67467728 1.14E-05 3 2.96 60S ribosomal protein L44
EHI_069560 67469807 4.42E-09 8 2.86 hypothetical protein Autophagy-related protein 27 EHI_110740 67477647 5.28E-06 8 2.83 hypothetical protein Lysine-rich protein KRiP3 EHI_141930 67478487 1.74E-04 3 2.65 protein kinase
EHI_114120 67471726 2.28E-10 12 2.51 Chaperonin-containing TCP-1 delta subunit
EHI_093860 67484130 8.40E-06 3 2.48 MIT-domain protein EHI_060740 10505244 6.66E-15 10 2.41 URE3-BP sequence specific
DNA binding protein
EHI_012980 183231113 1.22E-14 21 2.40 dihydropyrimidine dehydrogenase EHI_143100 183235312 3.69E-06 5 2.39 Ras guanine nucleotide
exchange factor
EHI_064640 183231981 7.51E-09 6 2.28 hypothetical protein Seryl-tRNA synthetase N-terminal domain EHI_020240 67466062 5.21E-04 5 2.27 tryptophanyl-tRNA synthetase
EHI_000510 67474022 4.36E-06 3 2.27 60S ribosomal protein L4 EHI_013260 67481903 2.11E-14 4 2.22 Rho family GTPase EHI_013890 67463032 1.88E-11 12 2.21 40S ribosomal protein S6
EHI_124520 183231771 1.13E-06 6 2.21 hypothetical protein domain Ras-like GTPase superfamily
EHI_056490 67469491 1.23E-06 7 2.08 20 kDa antigen EHI_160980 67466177 5.22E-12 24 2.02 methylated LINE binding
protein EhMLBP EHI_146560 67465753 3.36E-12 8 2.01 40S ribosomal protein S24 EHI_023230 67480599 5.89E-09 8 2.01 histone H4
were carried out. Seven days after infection, the animals were sacrificed, morphology of liver was macroscopically observed and a histological analysis was performed. As expected, infection with trophozoites carrying the krip1 sense gene resulted in abscess development (4 of 6 animals presented well organized abscesses). Histological analysis showed that 7 of the 12 inspected lobes presented necrotic areas with parasites (Fig. 4C). In contrast, trophozoites carrying the krip1 gene antisense construct have clearly reduced their capacity to establish liver abscesses. Indeed, in 4 out of 6 hamsters, we did not observe macroscopic abscesses. From the 12 lobes examined by histology, only two presented liver lesions, whereas the other lobes presented preserved tissue architecture (Fig. 4C).
5- Ap-A and CP-A5 are not necessary for the boosting effect of glucose starvation on virulence
Ap-A and CP-A5 are two major E. histolytica virulence factors [35]. The reduction of their levels in glucose-starved trophozoites (Table 3) suggests that these proteins are not involved in the boosting effect of GS on the parasite’s virulence. To test this hypothesis, two strains silenced for the expression of Ap-A (G3 strain) and Ap-A and CP-A5 (RB8) were studied. First, we confirmed by RT-PCR that the expression of Ap-A and CP-A5 encoding genes in the respective G3 and RB8 strains was silenced (data not shown). Then, the GS effect on the cytopathic activity of
E. histolytica strains G3 and RB8 was examined (Fig. 5). We found that GS boosted the virulence of the G3 and RB8 strains indicating that Ap-A and CP-A5 are not requested for the boosting effect of GS on virulence.
6- LgL1 is necessary for the boosting effect of glucose starvation on virulence
E. histolytica trophozoites adhere to the host colon epithelium using the galactose/N-acetylgalactosamine (Gal/GalNAc) inhibit-able lectin [36]. Monoxenic cultivation of E. histolytica with the bacterium Escherichia coli strain O55 results in down-regulation of the lectin light subunit and reduced virulence [37]. These observations suggest that the Gal/GalNAc lectin light subunits are involved in the response of the parasite to environmental changes. Therefore, and despite the fact that the light subunits were missing from the list of protein regulated by GS (Table 2 and 3), we examined more specifically their abundance in the membrane-enriched protein fraction of glucose-starved trophozo-ites. We observed that around three times more LgL1 was present in the protein fraction of glucose-starved trophozoites compared to the amount present in the fraction of the control strain (Fig. 3D). To determine the role of LgL1 in the boosting effect of GS on virulence, the cytopathic activity of the E. histolytica RB9 strain was studied. These parasites have been silenced for the expression of Ap-A and of LgL1 [38]. Interestingly, no boosting effect of GS on Table 3. Quantitative proteomics analysis of proteins with decreased abundance following glucose starvation.
Accession
Pathema Accession GI Ppro pepCount mean H/L Protein Name Domain of interest EHI_001830 183233476 1.70E-07 6 2.00 hypothetical protein Gpi16 subunit, GPI
transamidase component EHI_109990 67472817 1.05E-09 4 2.00 hypothetical protein lipoprotein 17 EHI_004610 67483002 7.30E-04 3 2.00 phosphoribulokinase
EHI_185240 67481639 6.47E-06 6 2.00 long chain fatty acid CoA ligase EHI_196530 67465479 2.09E-10 4 2.10 Ras family GTPase
EHI_121490 67463591 1.65E-09 5 2.10 WD repeat protein
EHI_146330 67467663 1.44E-14 5 2.20 calpain large subunit domain III-containing protein
EHI_011550 67474946 4.68E-05 3 2.30 hypothetical protein Arrestin WW domains EHI_130930 400978 2.15E-06 5 2.30 Ras-like GTP-binding protein RHO1
EHI_130930 67480401 3.40E-07 4 2.40 purine nucleoside phosphorylase EHI_065740 183234624 7.47E-06 4 2.40 HEAT repeat domain-containing protein EHI_065740 67476093 6.55E-14 6 2.40 60S ribosomal protein L30
EHI_096410 158932 1.52E-08 3 2.60 hypothetical protein
EHI_118810 67483281 3.40E-04 3 2.00 hypothetical protein Protein kinase domain EHI_096410 67477219 2.60E-06 3 2.70 protein kinase domain-containing protein
EHI_012170 67481683 2.91E-04 3 2.90 hypothetical protein von Willebrand factor EHI_127830 67479381 6.51E-05 4 2.90 long chain fatty acid CoA ligase
EHI_168240 67469932 1.22E-14 5 3.10 cysteine proteinase –A5
EHI_159480 67475078 1.17E-06 6 4.30 pore-forming peptide ameobapore A precursor EHI_194540 183231856 9.24E-08 4 6.30 pore-forming peptide ameobapore B precursor
Total lysates of control and glucose-starved E.histolytica trophozoites were produced and used as substrates for stable isotope dimethyl labeling of peptides for quantitative proteomics analysis. The list describes the proteins that were up-regulated (Table 2) or down-regulated (Table 3) following glucose starvation. Mean H/L provided directly from the MS analysis is the ratio between the protein levels in lysates from glucose-starved and control trophozoites. The value displayed for pepCount represents the number of peptides used for protein identification and statistical value is given in the column Ppro (protein probability). Ppro is the probability of the best peptide match (the peptide with the lowest score) for each identified protein. Classification and characterization of the domains in the hypothetical proteins was done using motif Search (http://motif.genome.jp/) of the PROSITE and Pfam databases.
the cytopathic activity of the strain RB9 was observed (Fig. 5). These results suggest that LgL1 is involved in the mechanism that enhances the cytopathic activity of E. histolytica under GS.
Discussion
Parasite survival in its host depends on its ability to react to different stress stimuli and to adapt to changing environments. Under laboratory conditions, E. histolytica is cultivated in presence of 1% glucose whereas in its human host, the parasite lives mostly in the large intestine, which is a low-glucose environment, due to the absorption of simple sugars in the small intestine [39]. We recently reported evidences that the parasite reacts to GS by modifying the cellular localization of enolase and the methylation
status of its tRNAasp [18]. The results presented here indicate that GS is also a positive regulator of E. histolytica virulence.
A positive regulation of virulence by GS has also been reported in Candida albicans. In this haploid yeast, glucose depletion causes a developmental switch that allows cells to penetrate the surface of an agar medium in a process called invasive growth. This process mimics invasion of host tissue and therefore pathogenesis [40].
In many microorganisms the stress response against heat shock or starvation provides a cross-resistance to other stresses. In E.coli, glucose or nitrogen starvation lead to enhanced resistance to heat shock and oxidative stress [41]. Adaptation of C. elegans to high temperatures by the heat shock response results in a reduced sensitivity to ethanol under conditions of heat stress [42]. The mechanism acting in the cross-protection effect is the induction of
Figure 3. Quantitative changes in protein expression following glucose starvation. (A) Total lysates of control and glucose-starved E.histolytica trophozoites used for stable isotope dimethyl labeling of peptides for quantitative proteomics analysis. The pies represent proteins whose amounts were increased (upper panel) or decreased (lower panel) following glucose starvation. The proteins were annotated according to their biological role as classified in the Pfam databases. Percentage number is given for each protein family. (B) Transcript amounts for Ap-A, CP-A5, URE-3BP and HSP70 in control and glucose-starved (GS) E.histolytica trophozoites were analyzed by Northern blot analysis. HSP70 whose expression is only slightly reduced in glucose-starved trophozoites (Table S1) was used as a control for loaded RNA. (C) Western blot analysis of Ap-A and KRiP1 expression in glucose-starved trophozoites. Cytoplasmic and nuclear protein fractions of E.histolytica were separated on 12% SDS-PAGE, transferred to a nitrocellulose membrane and incubated respectively with the KRiP1, Ap-A, or actin antibody. (D) Western blot analysis of LgL1 amounts in control and glucose-starved (GS) trophozoites. Membrane protein fractions were separated on 12% SDS-PAGE, transferred to nitrocellulose membrane and incubated with LgL1 antibody. Ponceau stain was used to control for protein loading.
heat shock proteins (HSPs) expression by the initial stress stimulus. HSPs prevent the aggregation of partially denatured proteins [43]. Our results show that GS does not protect the E. histolytica against heat shock or oxidative stress. This result is not surprising as the abundance of HSP 70 and other HSPs were not increased in glucose-starved parasites. In contrast to the lack of HSPs induction, GS has a striking effect on the abundance of other E.histolytica proteins.
The following focus of our study was directed to identify at the proteome level major E. histolytica factors modified by GS. The proteomics analysis provided several candidate(s) proteins that may be involved in the virulence boosting effect of GS.
One of the proteins whose abundance is enhanced in glucose-starved trophozoites is URE3-BP. The role of this transcription factor in the remodeling of the cell surface in response to calcium signals has been well established. Indeed, the expression of a dominant-positive mutant of URE3-BP leads to higher virulence and increased cell motility [24]; phenotypic features that we also observed in glucose-starved trophozoites. These data indicate that URE3-BP may be involved in the control of virulence exerted by GS.
Another putative regulator of the virulence under GS is KRiP1 which belongs to a group of lysine-rich proteins (KRiP and KERP) whose expression is up-regulated in virulent E.histolytica strains [33]. Some of these proteins, like KERP1, are localized to the parasite membrane and others like KRiP1 are nuclear, as we demonstrated here. Our knowledge about how these lysine-rich proteins regulate the parasite’s virulence is scanty. The fact that no boosting of the cytopathic activity occurs under GS in the KRiP1 antisense transfectants suggests that this protein regulates the virulence of the parasite under stressful physiological conditions.
In an attempt to investigate the direct involvement of KRiP1 in pathogenicity, we subjected parasites modified for KRiP1 production by an antisense strategy to in vivo conditions of liver abscess formation. We demonstrate that the antisense parasites exhibit a significantly lower pathogenicity in the hamster model, indicating that KRiP1 plays a role in E. histolytica virulence in vivo. A third candidate for the regulation of E.histolytica virulence under GS is the Gal/GalNAc lectin light subunit which is also upregulated following GS. The role of LgL1 in the virulence boosting effect of GS may be direct or the result of changes in the
Figure 4. Antisense down-regulation of KRiP1 expression. (A) Determination of KRiP1 expression in sense KRiP1 and antisense KRiP1 transfectants by Western blot analysis. Nuclear protein fractions of E.histolytica sense KRiP1 and antisense KRiP1 transfectants grown in the presence of 40 mg per ml G418 were separated on 12% SDS-PAGE and analyzed by Western blot using a KRiP1 antibody, and an actin antibody. Identical results were obtained for three independent experiments. (B) Cytopathic activity of sense KRiP1 and antisense KRiP1 transfectants grown in complete TYI-S-33 medium. The cytopathic activity of the sense KRiP1 transfectant was taken as 100%. Data are expressed as the mean and standard deviation of three independent experiments that were repeated twice with a P-value ,0.05. (C) Amoebic liver abscess formation by E. histolytica transfected with sense- and antisense-KRiP1 expression plasmids. Hamsters were infected by intraportal vein injection with trophozoites (16106) expressing a
KRiP1-sense (upper row) or -antiKRiP1-sense (lower row) plasmid. A total of 6 animals, in two independent experiments, were infected with each amoeba type. Liver abscess formation was analysed at 7 days post-infection. Images show representative fields from 5 mm sections of formaldehyde-fixed tissue, stained with Harris’ haematoxylin, periodic acid-Schiff reagent to visualize the hamster cells. Trophozoites were revealed by monoclonal antibody CD6 directed against E. histolytica Gal/GalNAc lectin heavy subunit and HRPO-coupled anti-mouse antibody. Scale bar, 60 mm for upper left panel and 40 mm for the three other panels.
overall structure of the Gal/GalNAc lectin complex. In addition, the silencing of LgL1 in the RB9 strain led to the co-silencing of LgL2 and LgL3 [44]. Therefore, it is difficult at this stage to know which LgL is implicated in the GS boosting effect on E. histolytica virulence. In Saccharomyces cerevisiae, glucose sensing is achieved by two transmembrane glucose-sensing proteins, Snf3 and Rgt2 [45]. These proteins have a cytoplasmic C-terminal tail which is essential for detecting changes in glucose concentrations [46]. In addition to a role of the LgL subunits in adhesion [47], signalling in chemotaxis [48] and differentiation [19], the role of LgL in glucose sensing in E.histolytica could be a new area of the Gal/ GalNAc lectin research.
An unexpected result of the proteomics analysis is the lower abundance of the virulence factors Ap-A and CP-A5 in glucose-starved E. histolytica trophozoites. Usually, in a state of energy depletion organisms synthesize virulence factors that are capable of killing host cells and degrade macromolecules to obtain sugar and energy [49,50]. Our results suggest that AP-A and CP-A5 are not essential for the virulence boosting in glucose-starved parasites. An interesting feature that was found in glucose-starved trophozoites is the decreased amount of proteins associated with metabolism and in particular with the fatty acid pathway. In the specific pyruvate-to-ethanol pathway in E.histolytica, acetyl-CoA is converted to acetaldehyde, which is then reduced to ethanol [51]. Reduced levels of the long chain fatty acid CoA ligase during GS may be a consequence of a mechanism by which acetyl-CoA is deviated from the fatty acid pathway into the pyruvate-to-ethanol pathway [52]. Lipid degradation as a mean to increase acetyl-CoA production was also observed in glucose-starved B. subtilis and in starved rats where fatty acids degradation could provide acetyl-CoA as substrate for the tricarboxylic acid cycle [53,54]. Many of
the ribosomal proteins were also affected by GS. These proteins are regarded as moon light proteins, thus having extra-ribosomal roles [55]. Examples for biological processes ribosomal proteins participate in include growth regulation, cell proliferation and DNA damage response [56,57,58]. In eukaryotic cells ribosomal proteins can auto-regulate their production, in this way synthesis of individual ribosomal protein can be controlled [59]. This mechanism may also be relevant for E. histolytica for which proteomics data provide evidence for ribosomal turnover during GS and for the accumulation of some several ribosomal proteins [60]. Alternatively, the accumulation of ribosomal components in the glucose-starved parasites may reflect their ability to immedi-ately initiate an upshift program when the missing substrate is made available, as seen in Vibrio sp. strain S14 during carbon starvation [61]. At this stage, we cannot rule out that metabolic changes occurring in the glucose-starved parasites contribute to the modulation of their virulence.
In summary, the results of this investigation indicate that significant changes occur in the metabolism of E.histolytica exposed to GS to provide the parasite an alternative source of energy. In addition, we report for the first time that GS upregulates E. histolytica virulence and that KRiP1 and LgL1 are involved in the boosting effect. In the future, it will be interesting to determine if this specific response of the parasite to short-term glucose starvation reflects events occurring in the low-glucose environment of the large intestine.
Supporting Information
Table S1
(XLS)
Figure 5. Cytopathic activity under GS of strains with reduced expression of Ap-A, CP-A5, Lgl1, and KRiP1. Cytopathic activity of E.histolytica Ap-A mutant (G3), and CP-A5 mutant (RB8), and LgL1 mutant (RB9), and E.histolytica sense KRiP1 and antisense KRiP1transfectants that were cultivated in control and glucose-free TYI-S-33 medium. The cytopathic activity of each strain before glucose starvation (GS) was taken as 100%. Data are expressed as the mean and standard deviation of three independent experiments that were repeated twice with a P-value ,0.05 (with assays/measurements repeated twice.
Acknowledgments
We thank the Smoler Protein Center at the Technion for their help with Proteomics and Dr. Bomzon from PGCert Editing for editing our manuscript.
Author Contributions
Substantial contribution to conception and design, acquisition of data, or analysis and interpretation of data: AT RH RS-T SS DF NG SA. Drafted the article or revised it critically for important intellectual content: AT DF NG SA. Final approval of the version to be published: AT NG SA.
References
1. World Health Organization (1997) Amoebiasis. WHO Weekly Epidemiologic Record 72: 97–100.
2. McCoy J, Mann B, Petri WA, Jr. (1994) Adherence and cytotoxicity of Entamoeba histolytica or how lectins let parasites stick around. Infection and Immunity 62: 3045–3050.
3. Petri WA, Jr., Broman J, Healy G, Quinn T, Ravdin JI (1989) Antigenic stability and immunodominance of the Gal/GalNAc adherence lectin of Entamoeba histolytica. Am J Med Sci 297: 163–165.
4. Nickel R, Ott C, Dandekar T, Leippe M (1999) Pore-forming peptides of Entamoeba dispar. Similarity and divergence to amoebapores in structure, expression and activity. Eur J Biochem 265: 1002–1007.
5. Bansal D, Ave P, Kerneis S, Frileux P, Boche O, et al. (2009) An ex-vivo human intestinal model to study Entamoeba histolytica pathogenesis. PLoS Negl Trop Dis 3: e551.
6. Que X, Reed SL (2000) Cysteine proteinases and the pathogenesis of amebiasis. Clin Microbiol Rev 13: 196–206.
7. Mortimer L, Chadee K The immunopathogenesis of Entamoeba histolytica. Exp Parasitol).
8. Akbar MA, Chatterjee NS, Sen P, Debnath A, Pal A, et al. (2004) Genes induced by a high-oxygen environment in Entamoeba histolytica. Mol Biochem Parasitol 133: 187–196.
9. Siman-Tov R, Ankri S (2003) Nitric oxide inhibits cysteine proteinases and alcohol dehydrogenase 2 of Entamoeba histolytica. Parasitol Res 89: 146–149. 10. Rico G, Leandro E, Rojas S, Gimenez JA, Kretschmer RR (2003) The monocyte locomotion inhibitory factor produced by Entamoeba histolytica inhibits induced nitric oxide production in human leukocytes. Parasitol Res 90: 264–267.
11. Elnekave K, Siman-Tov R, Ankri S (2003) Consumption of L-arginine mediated by Entamoeba histolytica L-arginase (EhArg) inhibits amoebicidal activity and nitric oxide production by activated macrophages. Parasite Immunol 25: 597–608.
12. Weber C, Guigon G, Bouchier C, Frangeul L, Moreira S, et al. (2006) Stress by heat shock induces massive down regulation of genes and allows differential allelic expression of the Gal/GalNAc lectin in Entamoeba histolytica. Eukaryot Cell 5: 871–875.
13. Bernes S, Siman-Tov R, Ankri S (2005) Epigenetic and classical activation of Entamoeba histolytica heat shock protein 100 (EHsp100) expression. FEBS Lett 579: 6395–6402.
14. Mirelman D, Bracha R, Chayen A, Aust-Kettis A, Diamond LS (1986) Entamoeba histolytica: effect of growth conditions and bacterial associates on isoenzyme patterns and virulence. Exp Parasitol 62: 142–148.
15. Rani R, Murthy RS, Bhattacharya S, Ahuja V, Rizvi MA, et al. (2006) Changes in bacterial profile during amebiasis: demonstration of anaerobic bacteria in ALA pus samples. Am J Trop Med Hyg 75: 880–885.
16. Bhattacharya A, Anand MT, Paul J, Yadav N, Bhattacharya S (1998) Molecular changes in Entamoeba histolytica in response to bacteria. J Eukaryot Microbiol 45: 28S–33S.
17. Fang J, Zhou H, Rathore D, Sullivan M, Su XZ, et al. (2004) Ambient glucose concentration and gene expression in Plasmodium falciparum. Mol Biochem Parasitol 133: 125–129.
18. Tovy A, Siman Tov R, Gaentzsch R, Helm M, Ankri S (2010) A new nuclear function of the Entamoeba histolytica glycolytic enzyme enolase: the metabolic regulation of cytosine-5 methyltransferase 2 (Dnmt2) activity. PLoS Pathog 6: e1000775.
19. Eichinger D (2001) A role for a galactose lectin and its ligands during encystment of Entamoeba. J Eukaryot Microbiol 48: 17–21.
20. Ankri S, Stolarsky T, Mirelman D (1998) Antisense inhibition of expression of cysteine proteinases does not affect Entamoeba histolytica cytopathic or haemolytic activity but inhibits phagocytosis. Mol Microbiol 28: 777–785. 21. Lavi T, Siman-Tov R, Ankri S (2008) EhMLBP is an essential constituent of the
Entamoeba histolytica epigenetic machinery and a potential drug target. Molecular Microbiology 69: 55–66.
22. Bracha R, Mirelman D (1984) Virulence of Entamoeba histolytica trophozoites. Effects of bacteria, microaerobic conditions, and metronidazole. J Exp Med 160: 353–368.
23. Ankri S, Padilla-Vaca F, Stolarsky T, Koole L, Katz U, et al. (1999) Antisense inhibition of expression of the light subunit (35 kDa) of the Gal/GalNac lectin complex inhibits Entamoeba histolytica virulence. Mol Microbiol 33: 327–337. 24. Gilchrist CA, Baba DJ, Zhang Y, Crasta O, Evans C, et al. (2008) Targets of the Entamoeba histolytica transcription factor URE3-BP. PLoS Negl Trop Dis 2: e282.
25. Bradford MM (1976) A rapid and sensitive method for the quantitation of microgram quantities of protein utilizing the principle of protein-dye binding. Anal Biochem 72: 248–254.
26. Rigothier MC, Khun H, Tavares P, Cardona A, Huerre M, et al. (2002) Fate of Entamoeba histolytica during establishment of amoebic liver abscess analyzed by quantitative radioimaging and histology. Infect Immun 70: 3208–3215. 27. Tsutsumi V, Mena-Lopez R, Anaya-Velazquez F, Martinez-Palomo A (1984)
Cellular bases of experimental amebic liver abscess formation. Am J Pathol 117: 81–91.
28. Gasch AP, Spellman PT, Kao CM, Carmel-Harel O, Eisen MB, et al. (2000) Genomic expression programs in the response of yeast cells to environmental changes. Mol Biol Cell 11: 4241–4257.
29. Mora-Galindo J, Gutierrez-Lozano M, Anaya-Velazquez F (1997) Entamoeba histolytica: kinetics of hemolytic activity, erythrophagocytosis and digestion of erythrocytes. Arch Med Res 28 Spec No. pp 200–201.
30. Bracha R, Mirelman D (1984) Virulence of Entamoeba histolytica trophozoites. Effects of bacteria, microaerobic conditions, and metronidazole. J Exp Med 160: 353–368.
31. Petri WA, Jr., Haque R, Mann BJ (2002) The bittersweet interface of parasite and host: lectin-carbohydrate interactions during human invasion by the parasite Entamoeba histolytica. Annu Rev Microbiol 56: 39–64.
32. Persson O, Valadi A, Nystrom T, Farewell A (2007) Metabolic control of the Escherichia coli universal stress protein response through fructose-6-phosphate. Mol Microbiol 65: 968–978.
33. Santi-Rocca J, Weber C, Guigon G, Sismeiro O, Coppee JY, et al. (2008) The lysine- and glutamic acid-rich protein KERP1 plays a role in Entamoeba histolytica liver abscess pathogenesis. Cell Microbiol 10: 202–217.
34. Petter R, Moshitch S, Rozenblatt S, Nuchamowitz Y, Mirelman D (1994) Characterization of two distinct gene transcripts for ribosomal protein L21 from pathogenic and nonpathogenic strains of Entamoeba histolytica. Gene 150: 181–186.
35. Ackers JP, Mirelman D (2006) Progress in research on Entamoeba histolytica pathogenesis. Curr Opin Microbiol 9: 367–373.
36. Mann BJ, Young CY, Petri WA, Jr. (1992) Sequence and structure of the galactose adherence lectin of Entamoeba histolytica. Arch Med Res 23: 55–56. 37. Padilla-Vaca F, Ankri S, Bracha R, Koole LA, Mirelman D (1999) Down regulation of Entamoeba histolytica virulence by monoxenic cultivation with Escherichia coli O55 is related to a decrease in expression of the light (35-kilodalton) subunit of the Gal/GalNAc lectin. Infect Immun 67: 2096–2102. 38. Bracha R, Nuchamowitz Y, Anbar M, Mirelman D (2006) Transcriptional
silencing of multiple genes in trophozoites of Entamoeba histolytica. PLoS Pathog 2: e48.
39. Wolfe AJ (2005) The acetate switch. Microbiol Mol Biol Rev 69: 12–50. 40. Cullen PJ, Sprague GF, Jr. (2000) Glucose depletion causes haploid invasive
growth in yeast. Proc Natl Acad Sci U S A 97: 13619–13624.
41. Jenkins DE, Schultz JE, Matin A (1988) Starvation-induced cross protection against heat or H2O2 challenge in Escherichia coli. J Bacteriol 170: 3910–3914. 42. Gainutdinov M, Timoshenko A, Petrov AM, Gainutdinov TM, Kalinnikova TB (2010) Ethanol sensitizes the nervous system of Caenorhabditis elegans nematode to heat stress. Bull Exp Biol Med 150: 55–57.
43. Tyedmers J, Mogk A, Bukau B (2010) Cellular strategies for controlling protein aggregation. Nat Rev Mol Cell Biol 11: 777–788.
44. Bracha R, Nuchamowitz Y, Anbar M, Mirelman D (2006) Transcriptional silencing of multiple genes in trophozoites of Entamoeba histolytica. PLoS Pathog 2: e48. Epub 2006 May 2026.
45. Moriya H, Johnston M (2004) Glucose sensing and signaling in Saccharomyces cerevisiae through the Rgt2 glucose sensor and casein kinase I. Proc Natl Acad Sci U S A 101: 1572–1577.
46. Marshall-Carlson L, Celenza JL, Laurent BC, Carlson M (1990) Mutational analysis of the SNF3 glucose transporter of Saccharomyces cerevisiae. Mol Cell Biol 10: 1105–1115.
47. Mann BJ (2002) Structure and function of the Entamoeba histolytica Gal/ GalNAc lectin. Int Rev Cytol 216: 59–80.
48. Blazquez S, Guigon G, Weber C, Syan S, Sismeiro O, et al. (2008) Chemotaxis of Entamoeba histolytica towards the pro-inflammatory cytokine TNF is based on PI3K signalling, cytoskeleton reorganization and the Galactose/N-acetylga-lactosamine lectin activity. Cell Microbiol 10: 1676–1686.
49. Herbert KC, Foster SJ (2001) Starvation survival in Listeria monocytogenes: characterization of the response and the role of known and novel components. Microbiology 147: 2275–2284.
50. Somerville GA, Proctor RA (2009) At the crossroads of bacterial metabolism and virulence factor synthesis in Staphylococci. Microbiol Mol Biol Rev 73: 233–248.
51. Lo HS, Reeves RE (1978) Pyruvate-to-ethanol pathway in Entamoeba histolytica. Biochem J 171: 225–230.
52. Harding JW, Jr., Pyeritz EA, Copeland ES, White HB, 3rd (1975) Role of glycerol 3-phosphate dehydrogenase in glyceride metabolism. Effect of diet on enzyme activities in chicken liver. Biochem J 146: 223–229.
53. Ardawi MS (1991) Metabolism of glucose, glutamine, long-chain fatty acids and ketone bodies by lungs of the rat. Biochimie 73: 557–562.
54. Koburger T, Weibezahn J, Bernhardt J, Homuth G, Hecker M (2005) Genome-wide mRNA profiling in glucose starved Bacillus subtilis cells. Mol Genet Genomics 274: 1–12.
55. Weisberg RA (2008) Transcription by moonlight: structural basis of an extraribosomal activity of ribosomal protein S10. Mol Cell 32: 747–748. 56. Jonathan R. Warner, McIntosh aKB (2009) How Common are Extra-ribosomal
Functions of Ribosomal Proteins? Mol Cell 10: 3–11.
57. Li J, Tan J, Zhuang L, Banerjee B, Yang X, et al. (2007) Ribosomal protein S27-like, a p53-inducible modulator of cell fate in response to genotoxic stress. Cancer Res 67: 11317–11326.
58. Wanzel M, Russ AC, Kleine-Kohlbrecher D, Colombo E, Pelicci PG, et al. (2008) A ribosomal protein L23-nucleophosmin circuit coordinates Miz1 function with cell growth. Nat Cell Biol.
59. Eng FJ, Warner JR (1991) Structural basis for the regulation of splicing of a yeast messenger RNA. Cell 65: 797–804.
60. Lafontaine DL (2010) A ‘garbage can’ for ribosomes: how eukaryotes degrade their ribosomes. Trends Biochem Sci. 21 p.
61. Flardh K, Cohen PS, Kjelleberg S (1992) Ribosomes exist in large excess over the apparent demand for protein synthesis during carbon starvation in marine Vibrio sp. strain CCUG 15956. J Bacteriol 174: 6780–6788.