Publisher’s version / Version de l'éditeur:
Vous avez des questions? Nous pouvons vous aider. Pour communiquer directement avec un auteur, consultez la première page de la revue dans laquelle son article a été publié afin de trouver ses coordonnées. Si vous n’arrivez pas à les repérer, communiquez avec nous à PublicationsArchive-ArchivesPublications@nrc-cnrc.gc.ca.
Questions? Contact the NRC Publications Archive team at
PublicationsArchive-ArchivesPublications@nrc-cnrc.gc.ca. If you wish to email the authors directly, please see the first page of the publication for their contact information.
https://publications-cnrc.canada.ca/fra/droits
L’accès à ce site Web et l’utilisation de son contenu sont assujettis aux conditions présentées dans le site LISEZ CES CONDITIONS ATTENTIVEMENT AVANT D’UTILISER CE SITE WEB.
Internal Report (National Research Council of Canada. Institute for Research in Construction), 2000-11-01
READ THESE TERMS AND CONDITIONS CAREFULLY BEFORE USING THIS WEBSITE.
https://nrc-publications.canada.ca/eng/copyright
NRC Publications Archive Record / Notice des Archives des publications du CNRC :
https://nrc-publications.canada.ca/eng/view/object/?id=dabe3039-a6d5-40d4-b1e4-2754c7d9025d https://publications-cnrc.canada.ca/fra/voir/objet/?id=dabe3039-a6d5-40d4-b1e4-2754c7d9025d
NRC Publications Archive
Archives des publications du CNRC
For the publisher’s version, please access the DOI link below./ Pour consulter la version de l’éditeur, utilisez le lien DOI ci-dessous.
https://doi.org/10.4224/20378856
Access and use of this website and the material on it are subject to the Terms and Conditions set forth at
In-situ performance evaluation of exterior insulation basement systems (EIBS): spray polyurethane foam: summary report
Swinton, M. C.; Bomberg, M. T.; Kumaran, M. K.; Maref, W.; Normandin, N.; Marchand, R. G.
National Research Council Canada
Conseil national de recherches Canada
Canada
In-situ Performance Evaluation
of Exterior Insulation Basement
System (EIBS)
Spray Polyurethane Foam
Summary Report
M.C. Swinton, M.T. Bomberg, M.K. Kumaran, W. Maref, N. Normandin, R.G. Marchand
Internal Report No. 820
In-situ Performance Evaluation of Exterior Insulation Basement System (EIBS)
Spray Polyurethane Foam Summary Report
M.C. Swinton, M.T. Bomberg, M.K. Kumaran, W. Maref, N. Normandin, R.G. Marchand
National Research Council of Canada Institute for Research in Construction
Ottawa, Ontario Canada K1A 0R6
Internal Report No. 820
IR-820
-i-In-situ Performance Evaluation of Exterior Insulation
Basement System (EIBS) - Spray Polyurethane Foam
Executive Summary
In 1995, the Canadian Urethane Foam Contractors Associationestablished a joint research project with the Institute for Research in Construction to assess the in-situ thermal performance of a number of insulation products used as exterior basement insulation in contact with the ground.
In October 1995, two spray polyurethane foam specimens measuring 1220 mm wide were sprayed onto the exterior of a concrete basement wall at Test Hut #1 at the NRC Campus on Montreal Road in Ottawa. The specimens conformed to CAN/ULC-S705.1-981, "Spray applied polyurethane foam insulation, medium density". They were instrumented prior to backfilling and their thermal
performance was monitored over two full years. Soil temperatures and moisture content were monitored concurrently. Weather events were recorded daily. Through analysis of the surface temperatures of the specimens, the presence of water was detected at their outer surface through various periods of heavy rain and major thaws throughout the two-year period. Over the same periods, the surface of the concrete on the inside of the insulation showed no evidence of water penetration through the insulation layer through most of the height of the basement wall.
For the conditions recorded over two years of monitoring, the thermal performance of each insulation specimen was found to remain stable. The thermal performance appeared not to be significantly affected by water
movement at the exterior face of the insulation. Furthermore, many specimens showed improvement of thermal performance in the second year. The dry summer and dryer soils noted during the second year may have contributed to this apparent marginal improvement.
The insulation specimens were retrieved after 31 months of exposure in the soil. Samples were taken from these exposed specimens. Thermal, moisture and mechanical properties were tested in the lab.
It is concluded that the key performance factors of the 76-mm thick SPF
specimens sprayed on the exterior surfaces of the concrete basement wall, i.e., the in-situ thermal resistance, the compressive strength, and the moisture contents all remained at a very good level.
1
In November 1998 the Canadian Commission on Building and Fire Codes accepted CAN/ULC-S705.1-98 as a replacement for the CGSB standard 51.23-92. Since there was no change in the technical requirements, the tested SPF product may be considered to be in accordance with the CAN/ULC-S705.1-98
In-situ Performance Evaluation of Exterior Insulation Basement
System (EIBS) - Spray Polyurethane Foam Summary Report
Preface
This report summarises the findings of the project “In-situ Performance
Evaluation of Exterior Insulation Basement System (EIBS) - Spray Polyurethane Foam”, recorded in a more detailed contract report1.
Introduction
Exterior basement insulation performs many functions. It not only provides thermal resistance between the soil and the interior, it also protects the structure from a challenging environment (e.g. moisture from wet soils, heaving and adhering soils due to frost action). It provides a means of water management at the interface of the soil and insulation, while promoting drying out of the structure. In this context, it is important to set performance parameters for setting
appropriate materials.
The Canadian Urethane Foam Contractors Associationestablished a joint research project with the Institute for Research in Construction to assess the in-situ thermal performance of Spray Polyurethane Foam (SPF) applied to the exterior of a basement.
In October 1995, two SPF specimens measuring 1220 mm wide were installed on the exterior basement wall at Test Hut #1 at the NRC Campus on Montreal Road in Ottawa. The specimens conformed to CAN/ULC-S705.1-981 "Spray applied polyurethane foam insulation, medium density". They were instrumented prior to backfilling and their thermal performance was monitored over two full years.
Objectives
This project was undertaken to record the effect of exposure of Spray
Polyurethane Foam insulation specimens used as exterior basement insulation. The insulation was exposed to the Ottawa climate, including below grade
conditions, over a two and a half year period from October 1995 to June 1998. The official monitoring began in June 1996. The following key performance factors of the SPF insulation were investigated: in-situ thermal resistance,
1
In November 1998 the Canadian Commission on Building and Fire Codes accepted CAN/ULC-S705.1-98 as a replacement for the CGSB standard 51.23-92. Since there was no change in the technical requirements, the tested SPF product may be considered to be in accordance with the CAN/ULC-S705.1-98
IR-820 2
-laboratory tested thermal conductivity and compressive strength. The performance factors were investigated in the context of:
• a prolonged exposure to the below grade environment
• measured changes in local environmental conditions; i.e., changes in soil temperatures, soil moisture content, surrounding air temperatures inside and out, and,
• measured laboratory properties before and after exposure.
Approach
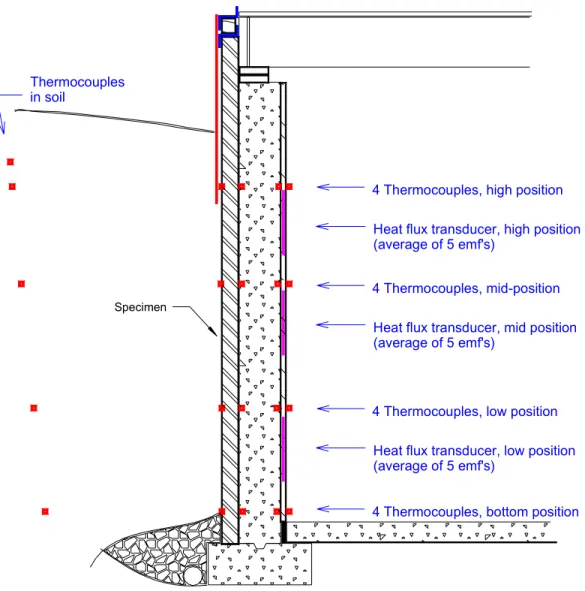
The SPF specimens were sprayed over the full height of two 1220 mm wide segments of the exterior basement wall of Test Hut #1, at NRC’s main Campus in Ottawa. Their performance was monitored using a strategy developed to monitor the in-situ thermal performance of roof insulation2,3. A thermally calibrated, 25 mm layer of expanded polystyrene board was installed over the entire surface of the interior of the basement wall. Thermocouples were systematically placed at the surface of each element in the wall, in a vertical array consisting of 16 points per specimen. A schematic diagram of this
arrangement is shown in Figure 1. As well, heat flux transducers were installed at three vertical locations.
The monitored temperature difference across the calibrated insulation layer was used to calculate the heat flux profile into the wall on a continuous basis.
Detailed analysis of heat transfer through the wall was used to assess the resulting heat flux into each exterior insulation specimen. Using this heat flux and temperature difference across the specimens, the apparent in-situ thermal resistance of the specimens was deduced.
Boundary conditions, including soil temperatures and moisture content were recorded, as well as observations of weather extremes. Four separate soil analyses were performed to characterize the soil environment, including vertical profiles of moisture content. One soil characterization report is included in Appendix C. This information was used to qualify differences in observed thermal performance of the specimens.
Specimens & Installation
The field experiment consisted of installing an SPF specimen on each of the east and west basement wall of Test Hut #1. The specimens were instrumented as shown in Figure 1.
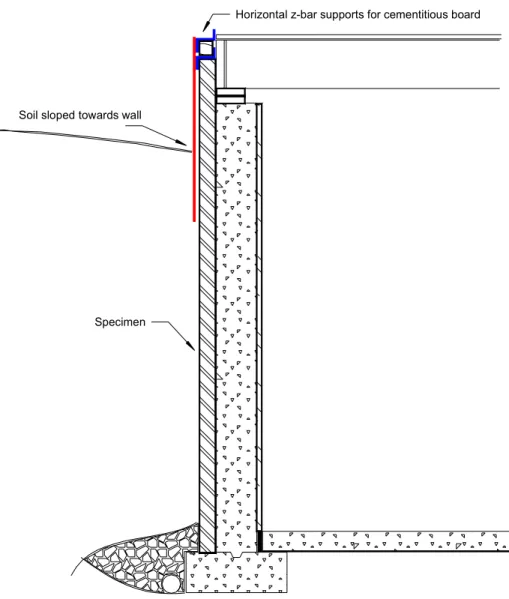
Two different installation methods were used on the east and west wall
configurations, labelled System 1 and System 2 respectively. System 1 on the west wall (Fig. 2) featured two horizontal rows of metal z-bars, separated by a wood spacer, all fastened to the header. Once the insulation was in place, the cementitious covering boards were fastened to the z-bars and wood space. No other fasteners were used, so the cementitious board was effectively
‘cantilevered’ over the insulation specimens. The soil was sloped at 5% grade towards the wall, to simulate a settled condition.
System 2 on the east wall (Fig. 3) featured metal z-bar supports placed vertically between each insulation specimen. The z-bars were fastened directly to the concrete wall and wood header on the inside, and fastened to the cementitious board on the outside. Each metal z-bar was therefore a thermal bridge around the insulation. System 2 also featured an initial 5% sloped grade away from the basement wall.
Control of Interior Conditions
The test hut was heated in the winter and air-conditioned in the summer. The indoor temperature was initially set at 21°C. After an initial monitoring period through the first summer, this temperature was reset to 23°C, to increase the accuracy of the monitoring in the shoulder seasons.
The indoor RH was not controlled, although some summertime dehumidification probably occurred as a by-product of air-conditioning.
The drainage system featured a sump pump. The level of water in the sump was observed to be quite high (at footing level) for the first 200 days of monitoring. At day 215, the sump pump controls were reset to maintain the water level in the sump at about 300 mm below the footings.
Results
Temperature Profiles Through the Wall at Mid-Height
Figure 4 shows the two-year temperature record at four locations through the wall at specimen W6: the interior surface, both sides of the concrete, and the exterior surface of the specimen in contact with the soil. The inner surface of the wall is kept near 21°C, with small variations throughout the two years. Main control events such as power outages and changes from heating to air conditioning and back are evident from these temperature readings. The temperature at both sides of the concrete are quite close to one another (concrete being a poor thermal insulator), and these vary from 15°C to 20°C, from winter to summer.
The lowest curve in the graph is the temperature record for the insulation/soil interface. These vary between about 5°C in winter up to a maximum of about 20°C in summer.
The periodic ‘spikes’ in this curve correspond to recorded events of heavy precipitation or winter thaws. The August 8, 1996 rain was a 1 in 75 year event for Ottawa, which caused local flooding around the test hut. During this storm, the temperature at the insulation/soil interface deflected upwards, apparently due
IR-820 4
-to warm rainwater moving down the wall. Such deflections were observed at the mid, low and bottom thermocouple positions during the same period, tracing the path of the water. These deflections were much less noticeable at the high position, where the soil temperature would be closer to the temperature of the moving water.
The temperature deflections in the winter at the soil/insulation interface are downward because the melt water temperature is initially 0°C, which cools the soil and insulation at the interface.
Figure 5 shows temperature measurements on the east wall of the test hut for the same insulation product that was shown on the west side in Figure 4. In the first year, these periodic temperature deflections were often smaller or absent on the east wall where the ground surface was properly graded outward. This relative absence of temperature deflections can be observed in Figure 6 for the first winter.
In the second year however, the differences between east and west were less noticeable, and the temperature deflections were then quite noticeable. A final review of soil slopes near the wall revealed that by the end of the second year, most of the slopes had settled on the east wall. These slopes were now mostly inward.
In-Situ Thermal Performance
Figures 6 and 7 show the resulting thermal performance plots for the specimens on the west face (a) and the east face (b). The change in thermal resistance adjustment is shown on a weekly basis over two heating seasons. Key observations are as follows: • all specimens show relatively steady performance through the heating seasons • the second heating season shows equal or improved performance for all specimens • the results for the warm periods are unreliable, since the temperature difference
across the specimens are very small (< 0.5°C). During such periods, thermocouple errors can be as large as the actual temperature difference.
• On day 215, modifications were made to faulty controls on the sump pump. Water levels around the footing were lowered over time. The sump pump connection is nearest specimens W5 & W6.
• Major rain and thaw periods do not appear to significantly affect the thermal performance of the specimens during these episodes.
Discussion
The following general observations are made as a result of these experiments. 1. The in-situ tracking of thermal performance of the specimens indicated stable
thermal performance1 over the two years of monitoring. In most cases there was an improvement in specimen thermal performance in the second heating season. This correlates with dryer prevailing soil conditions in the second year.
2. Based on the temperature profiles at the specimen/soil interface, and corresponding observations of heavy rainfall or thaw periods, the specimens are apparently
‘handling’ moving water at the specimen surface. This appears to have negligible effect on thermal performance of the specimen. There is also independent evidence that the SPF insulation protected the concrete structure during these events (no temperature deflections on the inside face, and clean interior surfaces observed on removal of the insulation).
3. The measured values of water vapour permeability of the retrieved SPF samples were consistent with those published in literature.
4. The measured moisture contents of the retrieved SPF samples were very low. Small variations were noted from top to bottom of the original specimens and these were all at a low range of moisture content.
5. When tested in the lab after recovery and drying of the specimens, the compressive strengths of the SPF samples were slightly higher than those of samples tested at the beginning of the test.
6. Other samples wrapped with a polyethylene cover appeared to have similar water handling and thermal characteristics as the samples without this protection. The data suggests that, by whatever mechanism, there may be even more water movement at the soil/polyethylene interface than at the interfaces of the other specimens.
7. Installation System #1 (Horizontal z-bars attached to header) yielded consistently superior thermal performance of the system compared to Installation System #2 (vertical z-bars attached to concrete).
1
The aging process is slowed because the polyurethane foam was sprayed on dry surface of old concrete. In principle, one may consider that the 76-mm thick medium density SPF is exposed to one-sided aging only.
IR-820 6
-8. The following parameters of SPF used on the exterior of basement walls appeared to have little or no effect on the observed thermal performance of specimens within the scope of this experiment:
• duration of exposure
• mean temperature of the specimen • water movement at the outer surface • freezing cycles
Conclusions
For the conditions recorded over the two year monitoring period in this experiment, the SPF insulation specimens installed as exterior basement insulation showed stable and sustained thermal performance in the soil.
The moisture management capabilities of these unprotected SPF specimens below grade were confirmed, both by the sustained thermal performance over the two year period and the low moisture contents of the specimens measured on retrieval. It is concluded that the key performance factors of the 76-mm thick SPF
specimens sprayed on the exterior surfaces of the concrete basement wall, i.e., the in-situ thermal resistance, the compressive strength, and the moisture contents all remained at a very good level.
Reference
1. Swinton, M.C.; Bomberg, M.T.; Maref, W.; Normandin, N.; Marchand, R.G.;
InSitu Performance Evaluation of Exterior Insulation Basement System (EIBS) -Spray Polyurethane Foam, 2000. 41 pp.(A-3132.3)
Figure 1. General Layout of Insulation Specimens and Sensors
Thermocouples in soil
Heat flux transducer, mid position (average of 5 emf's)
Heat flux transducer, low position (average of 5 emf's)
4 Thermocouples, low position
4 Thermocouples, bottom position Heat flux transducer, high position (average of 5 emf's)
4 Thermocouples, high position
4 Thermocouples, mid-position Specimen
IR-820 8
-Figure 2. Installation System 1 for the Above Ground Protective Assembly - West Wall.
Specimen Soil sloped towards wall
Figure 3. Installation System 2 for the Above Ground Protective Assembly - East Wall
Specimen Vertical z-bar
supports
Soil sloped away from wall
IR-820 10
-Figure 4. Temperature Profiles at the Mid-Position of Specimen W6 on the West Wall
Measured Temperatures at the 'Mid-Position' of Wall
0 5 10 15 20 25 0 30 60 90 120 150 180 210 240 270 300 330 360 390 420 450 480 510 540 570 600 630 660 690 720 750
Days from Start
Te mpe ra tur e (C )
West Wall - Specimen w6
Oct 3/96
June 5/96 Jan 1/97 Apr 1
New Temp. Control Reset to 21°C
Aug. 8 Rain & Flood
Temp. Reset to 23°C Power Outage
Major Rain or Thaw
Air conditioning period
Sep 28 Jan 26/98
Ice Storm '98 Heating period
Apr 26 June 25
Figure 5. Temperature Profiles at the Mid-Position of Specimen E6 on the East Wall
Measured Temperatures at the 'Mid-Position' of Wall
0 5 10 15 20 25 0 30 60 90 120 150 180 210 240 270 300 330 360 390 420 450 480 510 540 570 600 630 660 690 720 750
Days from Start
T e mp er at u re (C )
East Wall - Specimen e6
Oct 3/96
June 5/96 Jan 1/97 Apr 1
New Temp. Control Reset to 21°C
Aug. 8 Rain & Flood
Temp. Reset to 23°C Power Outage
Major Rain or Thaw
Air conditioning period
Sep 28 Jan 26/98
Ice Storm '98 Heating period
Apr 26 June 25
IR-820 12
-Figure 6. Trend in R-value for Two Heating Seasons. (Normalized to Initial R-value for October 1996)
Weekly Average R-value of the Specimen Relative to the R-value for October 1996
0% 10% 20% 30% 40% 50% 60% 70% 80% 90% 100% 110% 120% 120 150 180 210 240 270 300 330 360 390 420 450 480 510 540 570 600 630 660 690 720 750 Days Rel a ti v e R-va lu e 6/5/96
Start date: West Wall - Specimen w6
Oct 3, '96 Jan 1, '97 Apr 1 May 31 Jul 30 Sep 28 Nov 27 Jan 26/98 Mar 27 May 26
Small temperature differences. Error margins are larger
Warmer soil temperatures
Warmer temps.
Figure 7. Trend in R-value for Two Heating Seasons. (Normalized to Initial R-value for October 1996)
Weekly Average R-value of the Specimen Relative to the R-value for October 1996
0% 10% 20% 30% 40% 50% 60% 70% 80% 90% 100% 110% 120% 120 150 180 210 240 270 300 330 360 390 420 450 480 510 540 570 600 630 660 690 720 750 Days R e la tive R -va lue 6/5/96
Start date: East Wall - Specimen e6
Oct 3, '96 Jan 1, '97 Apr 1 May 31 Jul 30 Sep 28 Nov 27 Jan 26/98 Mar 27 May 26
Small temperature differences. Error margins are larger
Warmer soil temperatures
Warmer temps.