READ THESE TERMS AND CONDITIONS CAREFULLY BEFORE USING THIS WEBSITE.
https://nrc-publications.canada.ca/eng/copyright
Vous avez des questions? Nous pouvons vous aider. Pour communiquer directement avec un auteur, consultez la
première page de la revue dans laquelle son article a été publié afin de trouver ses coordonnées. Si vous n’arrivez pas à les repérer, communiquez avec nous à [email protected].
Questions? Contact the NRC Publications Archive team at
[email protected]. If you wish to email the authors directly, please see the first page of the publication for their contact information.
NRC Publications Archive
Archives des publications du CNRC
This publication could be one of several versions: author’s original, accepted manuscript or the publisher’s version. / La version de cette publication peut être l’une des suivantes : la version prépublication de l’auteur, la version acceptée du manuscrit ou la version de l’éditeur.
Access and use of this website and the material on it are subject to the Terms and Conditions set forth at
Sorption coefficients for interactions between volatile organic
compounds and indoor surface materials from small-scale, large-scale, and field tests
Won, D. Y.; Shaw, C. Y.; Corsi, R. L.
https://publications-cnrc.canada.ca/fra/droits
L’accès à ce site Web et l’utilisation de son contenu sont assujettis aux conditions présentées dans le site LISEZ CES CONDITIONS ATTENTIVEMENT AVANT D’UTILISER CE SITE WEB.
NRC Publications Record / Notice d'Archives des publications de CNRC:
https://nrc-publications.canada.ca/eng/view/object/?id=761336ab-7ecc-4756-a02b-9d77837df556 https://publications-cnrc.canada.ca/fra/voir/objet/?id=761336ab-7ecc-4756-a02b-9d77837df556
Sorption coefficients for interactions between
volatile organic compounds and indoor
surface materials from small-scale,
large-scale, and field tests
Won, D.Y.; Shaw, C.Y.; Corsi, R.L.
A version of this paper is published in / Une version de ce document se trouve dans : 4th International Conference on Indoor Air Quality, Ventilation and Energy Conservation
in Buildings, IAQVEC, 2001, pp. 1-8
www.nrc.ca/irc/ircpubs
SORPTION COEFFICIENTS FOR INTERACTIONS BETWEEN
VOLATILE ORGANIC COMPOUNDS AND INDOOR SURFACE
MATERIALS FROM SMALL-SCALE, LARGE-SCALE, AND FIELD
TESTS
D. Won and C.Y. Shaw
Institute for Research in Construction National Research Council
Ottawa, Ontario Canada K1A 0R6
R.L. Corsi
Department of Civil Engineering The University of Texas at Austin
Austin, Texas USA 78758 ABSTRACT
Adsorption and desorption by indoor surface materials can have significant impacts on the level of volatile organic compounds (VOCs) indoors. Models for the sink effects consist of two coefficients: sorption (ka) and desorption (kd). Two coefficients
were determined from 7 VOCs and 15 combinations of materials using small-scale chamber tests. Additionally, these coefficients were evaluated with data from scale-up experiments involving a large-scale laboratory chamber (10.4 m3), two rooms (9.7 and 28.4 m3) in a test house, and a second test house (500 m3). Conflicting results were obtained from large-scale laboratory and field experiments. Concentration measurements in a large-scale chamber were reasonably well predicted by
coefficients from small-scale experiments. Conversely, the level of sorption in field tests was observed at least 2.8 times greater than what was expected from small-scale experiments.
INTRODUCTION
Two factors affecting material emissions and subsequent indoor air quality are the adsorption and re-emission of volatile organic compounds (VOCs) by indoor surface materials, which are known as the sink effect. Sink effect is frequently modeled as a reversible surface phenomenon based on Langmuir theory. For a furnished
environment, the adsorption and emission of VOCs by building materials and furnishings can be governed by the mass balance equations; one for the air side (Equation 1) and the other for the material side (Equation 2).
dC dt Ein NC Ci k La i i k L M n d i i i i n = − − + = =
å
,å
, 1 1 (1) dM dt k C k M i a i d i i = , − , i = 1,. . ., n (2)where C is the VOC concentration in the air (mg m-3); Ein is the input rate of a
the ith material (m h-1); kd,i is the desorption coefficient of the ith material (h-1); Mi is the
chemical concentration on the ith material (mg m-2); Li is the specific area of the ith
material (m2 m-3); n is the number of materials.
To solve these equations, two key parameters, ka and kd, must be known. There
have been efforts to determine ka and kd by conducting a small-scale chamber tests
[1-3]. Little effort, however, has been made to validate the small-scale chamber results against field test results.
The purpose of this study was to determine the sorption rate coefficients of various building materials and furnishings for 7 VOCs using small-scale experiments. The validity of the determined coefficients was assessed with data obtained from both a large-scale chamber and two test houses.
METHOD
Small-scale experiments
The small-scale experimental system consisted of four 50-L electro-polished stainless steel chambers. During each experiment, one of the four chambers was used as a blank (no material added). A syringe pump was used to introduce a mixture of target VOCs into a stainless steel manifold, where the chemicals were volatilized into the supply air of the experimental system. The VOC laden supply air was split evenly for delivery to each chamber. Exhaust from each chamber was controlled to allow sequential sampling from each chamber. Samples were directed to an on-line gas chromatography system equipped with a flame ionization detector.
Each experiment allowed 10 hours of adsorption. Adsorption and desorption coefficients were determined by fitting the model from Equations 1 and 2 to a
concentration profile using a non-linear regression tool. Test materials included three carpets, two carpet pads (cushions), three types of gypsum board (virgin, painted, wallpapered), vinyl and wood flooring (maple plank with polyurethane coating), ceiling (acoustic) tile, fiberglass shower stall, upholstery (100% cotton), and apples (unwashed).
Target VOCs included methyl-tert-butyl ether (C5H12O), cyclohexane (C6H12),
isopropanol (C3H8O), toluene (C7H8), tetrachloroethene (C2Cl4), ethylbenzene
(C8H10), 1,2-dichlorobenzene (C6H4Cl2), and 1,2,4-trichlorobenzene (C6H3Cl3),
covering a range of boiling points from 55 to 213 oC. Standard experimental
conditions included 6-15 mg m-3 of inlet gas concentration, 0% final relative humidity, and 0.5 air change per hour. All experiments were completed at temperatures of 24 -25 oC.
Large-scale laboratory chamber test
A 10.4 m3 stainless steel chamber was assembled on a vinyl floor in a clean
environment. The chamber was maintained under negative pressure. Three different materials were tested: (a) LG-1, empty chamber, (b) LG-2, carpet with underlying pad, and (c) LG-3, carpet with underlying pad, gypsum board, pad attached to a chamber wall. The chamber was exposed to three chemicals with known sorption coefficients at a concentration of approximately 0.2 µL L-1 for 4 hours. The chemicals
include cyclohexane, toluene, and ethylbenzene.
These chemicals were prepared in 100 L Tedlar bags one day before each experiment. Two 2.2 m long Teflon tubes (6.4 mm O. D.) perforated with 0.28 cm holes 1 cm apart were used to distribute these chemicals inside the chamber. Two fans were used to facilitate instant mixing.
Samples were drawn through a 6.4 mm O. D. Teflon tubing inserted through the ceiling of the chamber. These collected on Carbotrap 300 multi-bed adsorbent tubes with a gas sample pump. Tubes were analyzed using a thermal desorber and a gas chromatograph with a flame ionization detector.
Field test #1
Field experiments were conducted in an unoccupied two-story test house. Two different rooms, i.e., bedroom #1 (28.4 m3) and bathroom (9.7 m3) on the second floor, were exposed to four chemicals including tetrachloroethene, ethylbenzene, ethyltoluene (C9H12), and 1,2-dichlorobenzene. SF6 was used to determine the air
change rate. Major identifiable surface materials were carpet with underlying pad, vinyl flooring, wall-papered gypsum board, and painted gypsum board.
Each room in the test house was used as a large-scale chamber. There were some differences in experimental methodology between large-scale and field experiments. First, the air change rate was not controlled in field tests. Secondly, the method of chemical injection was the pulse mode in field tests as opposed to the continuous mode in large-scale experiments.
Gaseous chemicals were introduced into each room for 12 minutes at a rate of 0.5 L min-1 through a 3.7 m long and 6.35 mm I. D. Teflon tubing, which was centred horizontally and vertically in the test room. After a short break for mixing (2 – 5
minutes), concentrations were measured over time. Doors and windows were closed and the HVAC system was turned off. One plastic box fan and one oscillating fan were used to promote mixing. SF6 samples were taken every 2 minutes using an
automated sampling system. Sorbent tube samples for sorptive gases were taken every 15 minutes for experiment # 1 and every 30 minutes for experiment # FD-2.
Field test #2
The second field test was conducted in another unoccupied two-storey research house, 500 m3 in volume. The identified materials included painted wood, painted gypsum board, painted concrete, unpainted gypsum board, and unpainted wood. Instead of using one room, the whole house was exposed to toluene for 4 weeks.
Prior to the test, the house was purged with outdoor air during a 4-day period. Measurements of background concentrations showed a low concentration of toluene. The air change rate of the test house was measured periodically during the conditioning period using NO2 tracer gas decay method. The air change rate was
0.16 h-1.
balance in the family room on the first floor. The recorded weight loss was led to an emission rate of 539 mg h-1 for the first 9 hours and zero afterwards. To facilitate mixing, the doors between rooms were left open and the furnace fan was operated continuously throughout the test.
Samples were collected several locations in the house: (a) family room, first floor, (b) dining room, first floor, (c) master bedroom, second floor, and (d) basement. Sample collection and analysis methods were similar to those described previously.
RESULTS
Small-scale laboratory experiments
A summary of adsorption and desorption coefficients is provided in Table 1. The extent of sorption is highly dependent on the types of indoor materials. Sorption capacities for non-polar VOCs were the greatest for carpet and carpet/pad systems followed by gypsum board and vinyl flooring. However, for the polar VOCs
(isopropanol and MTBE) virgin gypsum board exhibited the greatest sorption. For a given material, the level of sorption was observed to be sensitive to chemical properties. In general, the extent of sorption to a specific material was inversely related to vapor pressure.
Large-scale laboratory experiments
Figure 1 shows a relatively good agreement between the measured and predicted results for ethylbenzene. Similar results were obtained for the other two VOCs. The predicted results were obtained by solving Equations 1 and 2 numerically using the sorption coefficients in Table 1.
Field experiments in test house #1
Comparisons of measured and predicted data are shown in Figure 2 for tetrachloroethene and ethylbenzene. The predictions (Case #1) were obtained again by solving Equations 1 and 2 with Ein = 0 and a none-zero initial concentration.
Figure 2 illustrates that poor agreement was obtained. Figure 2 shows a consistently lower measured level, suggesting that either the test house had a stronger sink effect than the small chamber experiments or there were additional materials with stronger sorption capacity that were not accounted for. A best-fit curve for the measured data (Figure 2, Case #2) was obtained, assuming a single material for all sorptive surfaces. The result was used to determine the value of Keq (scale-up, average) for the single material surface. Keq (scale-up, average) was named to
reflect that the coefficient is the average of all sorptive surface.
Field experiments in test house #2
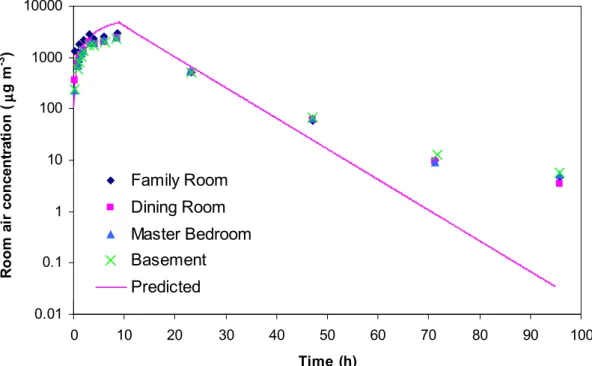
The predicted and measured toluene concentrations from Test house #2 are given in Figure 3. The prediction was made using Equations 1 and 2 with Ein = 539 mg h-1
until hour 9 and Ein = 0 afterwards. At the end of the adsorption phase (hours 4 – 9),
the predicted concentrations were slightly higher than the measured data. On the other hand, the measured results were higher than the predicted results after the 30th hour. Both observations suggest that the sorptive sink effects were higher than those expected from small-scale experiments. The best-fit Keq was also obtained using the
obtained for the adsorption and desorption phase.
Comparison of equilibrium coefficients
An equivalent to Keq (scale-up, average) for small-scale chamber experiments, Keq (small-scale, average), was obtained by the following equation.
K small scale average
K A A eq eq i i i n i i n ( , ) , − = = =
å
å
1 1 (3)where Keq,i is the equilibrium coefficient of the ith material (ka,i/kd,I), which was
obtained from small-scale chamber experiments. Ai is the area of the ith material.
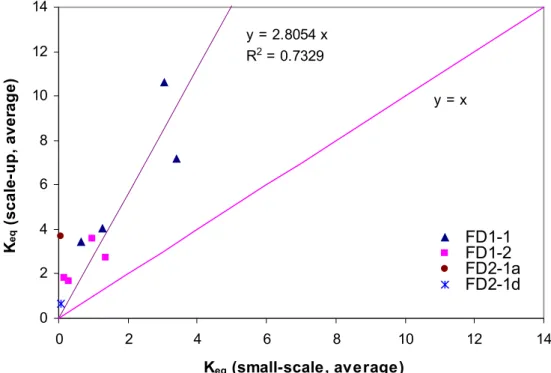
Figure 4 compares Keq (scale-up, average) to Keq (small-scale, average) for field
tests. The y = x line represents the case where Keq from scale-up experiments is
identical to that from small-scale experiments. The values of Keq from field test #1
are above the y = x line, suggesting that the sorption in field tests was greater than that predicted from small-scale experiments. The best-fit line for data from field test #1 implies that the sorption in field test #1 was 2.8 times greater than that based on small-scale experiments.
Different values of Keq were obtained for the adsorption and desorption phase from
field test #2. The equilibrium coefficient for the adsorption phase (FD2-1a) was situated well above the best-fit line ( y = 2.8054 x), suggesting that the sorption level in field test #2 was even greater than that observed in field test #1. On the other hand, Keq for the desorption phase (FD2-1d) agreed well with the best-fit line for field
test #1, which implies that the level of sorption for field test #2 was comparable to that for field test #1.
CONCLUSIONS
Adsorption and desorption coefficients for sink effects were determined from 15 combinations of materials for 7 VOCs using dynamic small-scale chamber tests. Three types of scale-up experiments were conducted to evaluate the accuracy for applying the coefficients from small-scale chambers to actual building. The predicted levels of sorption were generally lower than the measured results for field tests.
REFERENCES
1. B.A. Tichenor, Z. Guo, J.E. Dunn, L.E. Sparks, M.A. Mason, “The interaction of vapor phase organic compounds with indoor sinks”, Indoor Air, Vol 1., 23-35, 1991.
2. Y. An, J.S. Zhang, C.Y. Shaw, “Measurements of VOC adsorption/desorption characteristics of typical interior building materials”, HVAC&R Research, Vol 5., 297-316, 1999.
3. D. Won, R.L. Corsi, and M. Rynes, “New indoor carpet as an adsorptive reservoir for volatile organic compounds”, Environmental Science and Technology, Vol. 34, 4193-4198.
Table 1 Summary of average adsorption and desorption coefficients (ka / kd) Chemical Mate -rial C5H12O C6H12 C3H8O C7H8 C2Cl4 C8H10 C6H4Cl2 C6H3Cl3 Cp1 ns ns - 0.11/0.56 0.17/0.47 0.30/0.62 0.52/0.25 0.58/0.10 Cp2 nc nc - 0.26/0.44 0.31/0.32 0.41/0.34 0.80/0.17 0.91/0.13 Cp3 nc ns - 0.18/0.65 0.16/0.42 0.17/0.37 0.43/0.21 0.49/0.16 Cp1.p 0.76/4.9 0.39/1.7 0.75/1.1 0.49/0.29 0.44/0.25 0.48/0.15 0.60/0.08 1.5/0.46 Cp2.p 0.10/0.45 0.10/0.67 0.36/1.2 0.42/0.23 0.45/0.22 0.49/0.15 0.96/0.15 2.1/0.36 Cp3.p 0.10/0.69 0.10/0.60 0.27/0.47 0.23/0.16 0.23/0.17 0.29/0.14 0.62/0.13 1.4/0.42 G.v 0.46/1.6 ns 0.79/0.11 0.21/1.7 0.12/1.1 0.21/0.87 0.54/0.49 0.68/0.32 G.p 0.07/0.12 0.01/0.18 0.08/0.24 0.10/0.60 0.06/0.45 0.07/0.27 0.26/0.25 0.50/0.29 G.wp nc ns - 0.04/0.12 0.09/0.50 0.11/0.19 0.54/0.24 1.1/0.28 FL.v ns ns nc 0.09/0.66 0.07/0.39 0.06/0.22 0.23/0.13 0.53/0.17 FL.w nc ns nc ns ns 0.01/0.01 0.09/0.74 0.09/0.60 Uphol ns ns nc ns ns ns 2.0/10 1.8/3.2 Ceil 0.01/0.34 ns nc 0.01/0.03 0.01/0.17 0.09/1.0 0.48/0.73 0.63/0.52 SS.fg ns ns nc ns ns ns ns 2.2/7.8 App ns ns nc 0.02/0.18 0.01/0.05 0.07/0.72 0.32/0.62 4.8/3.8
ka in m/hr. kd in 1/hr. Values are averages of "ne" experiments. "ns" = no sorption. "nc" = little sorption with indeterminate sorption parameters (no convergence). "-" = failure of quality assurance protocols relative to variations in inlet concentrations. CpX = carpet X. CpX.p = carpet X with padding. G.v = virgin gypsum board. G.p = painted gypsum board. G.wp = wallpapered gypsum board. FL.v = vinyl flooring. FL.w = wood flooring. Uphol = upholstery. Ceil = ceiling (acoustic) tile. SS.fg = fiberglass shower stall. App = apples.
Figure 1 Ethylbenzene profiles for large-scale chamber experiments.
0.0 0.2 0.4 0.6 0.8 1.0 1.2 0 1 2 3 4 Time (h) C/ Cin
Measured (LG-1) Measured (LG-2) Measured (LG-3) Predicted (LG-1) Predicted (LG-2) Predicted (LG-3)
Figure 2 Comparison of measured and predicted concentrations (tetrachloroethene and ethylbenzene in bedroom #1, test house #1).
Figure 3 Comparison of measured and predicted concentrations of toluene in test house #2. 0.01 0.1 1 10 100 1000 10000 0 10 20 30 40 50 60 70 80 90 100 Time (h) R oom a ir c onc e nt ra ti on ( µµµµ g m -3 ) Family Room Dining Room Master Bedroom Basement Predicted 0 3 6 9 12 0 1 2 3 4 5 Time (h) R oom a ir c onc . ( m g m -3 ) C2Cl4 (measured) C2Cl4 (predicted, case #1) C2Cl4 (predicted, case #2) C8H10 (measured) C8H10 (predicted, case #1) C8H10 (predicted, case #2)
Figure 4 Comparison of Keq from small-scale chamber and scale-up experiments. 0 2 4 6 8 10 12 14 0 2 4 6 8 10 12 14 Keq (small-scale, average) K eq ( scal e-u p , aver ag e) FD1-1 FD1-2 FD2-1a FD2-1d y = 2.8054 x R2 = 0.7329 y = x