Publisher’s version / Version de l'éditeur:
Applied Optics, 29, pp. 3240-3248, 1999
READ THESE TERMS AND CONDITIONS CAREFULLY BEFORE USING THIS WEBSITE.
https://nrc-publications.canada.ca/eng/copyright
Vous avez des questions? Nous pouvons vous aider. Pour communiquer directement avec un auteur, consultez la première page de la revue dans laquelle son article a été publié afin de trouver ses coordonnées. Si vous n’arrivez pas à les repérer, communiquez avec nous à PublicationsArchive-ArchivesPublications@nrc-cnrc.gc.ca.
Questions? Contact the NRC Publications Archive team at
PublicationsArchive-ArchivesPublications@nrc-cnrc.gc.ca. If you wish to email the authors directly, please see the first page of the publication for their contact information.
NRC Publications Archive
Archives des publications du CNRC
This publication could be one of several versions: author’s original, accepted manuscript or the publisher’s version. / La version de cette publication peut être l’une des suivantes : la version prépublication de l’auteur, la version acceptée du manuscrit ou la version de l’éditeur.
For the publisher’s version, please access the DOI link below./ Pour consulter la version de l’éditeur, utilisez le lien DOI ci-dessous.
https://doi.org/10.1364/AO.29.003240
Access and use of this website and the material on it are subject to the Terms and Conditions set forth at
Optical properties of UV transmitting acrylics for use in a heavy water
Cerenkov detector
Zwinkels, Joanne C.; Davidson, W. F.; Dodd, C. X.
https://publications-cnrc.canada.ca/fra/droits
L’accès à ce site Web et l’utilisation de son contenu sont assujettis aux conditions présentées dans le site
LISEZ CES CONDITIONS ATTENTIVEMENT AVANT D’UTILISER CE SITE WEB.
NRC Publications Record / Notice d'Archives des publications de CNRC: https://nrc-publications.canada.ca/eng/view/object/?id=b3ca3df4-59d0-401f-b2f4-b73579662b2d https://publications-cnrc.canada.ca/fra/voir/objet/?id=b3ca3df4-59d0-401f-b2f4-b73579662b2d
Optical properties of UV transmitting acrylics for use in a heavy
water Cerenkov detector
Joanne C. Zwinkels, W. F. Davidson, and C. X. Dodd
The absorption, refraction, and scattering properties of several UV transmitting acrylics have been investi-gated over the wavelength range 300-700 nm using a combination of near-normal incidence regular transmit-tance and reflectransmit-tance and diffuse-only reflectransmit-tance measurements, followed by a Fresnel and a Kubelka-Munk analysis. The samples were evaluated in the as-cast and thermoformed forms, and both before and after an accelerated aging procedure. The results show significant differences in the optical behavior of the various
acrylics in the UV region and stress the importance of carefully characterizing acrylic from different sources for each intended use. In our case, acrylic is the proposed material for a heavy water containment vessel for
the detection of solar neutrinos. The significance of our findings to the overall performance of this Cerenkov detector, known as the Sudbury neutrino observatory detector, is discussed.
1. Introduction
A deep underground neutrino observatory, known as the Sudbury neutrino observatory (SNO) detector, has been proposed.' It will be located at the Creighton mine of INCO, Ltd., near Sudbury, Ontario. A crucial component of this detector is the 1000 tons of enriched D20 as a neutrino detecting medium. As shown in Fig. 1, the D20 will be contained within a transparent
cylin-drical acrylic vessel of 5-cm wall thickness immersed in
a large volume of H20. The yield of Cerenkov radia-tion resulting from the interacradia-tion of solar neutrinos with D20 is low; for a 7-MeV neutrino only -1140 photons are generated. Successful reconstruction of an event dictates that attenuation of radiation in tran-sit from the initial interaction point to the photomulti-plier tubes be kept to a strict minimum. An investiga-tion on attenuainvestiga-tion of visible and UV radiainvestiga-tion in purified D20 and H20 was previously reported,2 and it was found that attenuation in these media was suffi-ciently low so as not to compromise the operation of the detector. In this paper we address the experimen-tal determination of the optical properties of the
acryl-ic vessel.
The material for the containment of the D20 must satisfy several criteria. First of all, the material must
When this paper was written the authors were with the National Research Council of Canada. NRC has undergone a reorganization since this paper was submitted. Joanne C. Zwinkels and C. X. Dodd are now with the Institute for National Measurement Standards and W. F. Davidson is with the Herzberg Institute of Astrophysics. Ottawa, Ontario KlA OR6, Canada.
Received 2 November 1989. 0003-6935/90/220000-09$02.00/0. © 1990 Optical Society of America.
have uranium and thorium concentrations at or below the 10-12 g/g level; it must have very high UV and near visible transmittance; it must retain its properties es-sentially unchanged over 5-10 yr exposure to pure water; it must be robust and retain its mechanical integrity; and because of its size (10 m diameter) its components must be easily joined in situ. The above considerations led to the selection of acrylic. Acrylic is the plastic equivalent of crown glass with respect to its optical properties. It is relatively inexpensive, tough, and has almost infinite design flexibility. It possesses the requisite low levels of radioactive contamination. Most commercially available acrylics are not suitable for our particular application as they contain UV ab-sorbing stabilizers to prevent tarnishing on exposure to sunlight. There does exist, however, an emerging class of premium high quality UV transmitting acrylics, but detailed information about their optical behavior is not available in the literature.3 The present paper reports our findings on the optical properties of several candidate UV transmitting acrylics, particularly as they relate to the performance of the SNO detector, but also as they have important implications for other technological applications, such as the design of UV optical systems.
The optical properties of acrylic3-6 exert a strong influence on how light is propagated from a neutrino interaction point within the D20 to the PMTs ar-ranged on the periphery of the H20 shield. The trans-mittance of the acrylic has to be the highest attainable, especially in the blue and near UV spectral regions where the PMT responsivity is a maximum7 and the yield of Cerenkov radiation is increasing. Not only is it necessary to characterize the UV absorption and scattering properties of the virgin acrylic but it is
im-ACCESS DRIFT
VESSEL SUPPORT~t-).? -d~s PHOTOMULTIPLIER| < 1
~~
'a E SP S G o POzTUBES ACRYLIC VESSEL
2--L
Iapp'o,' 14m 10M di. >XOw:S.) STAINLES STEELI LINER SULFURCEEE-R Z~ BLOCKSCONCRETE ROCK PMT SUPPORT FRAMEWORK
CROSS-SECTION OF NEUTRINO DETECTOR
Fig. 1. Conceptual design of proposed neutrino detector. The
heavy water is contained in a cylindrical acrylic vessel and is shielded from activity in the rock by low activity concrete and light water.
The Cerenkov radiation is detected by an array of photomultiplier tubes located in the light water. The dimensions of the cavity are 20 m diameter and 30 m height. The detector will be sited at a depth of
2070 m.
portant operationally to determine how these proper-ties are affected by thermoforming and by prolonged
immersion of the acrylic in liquids such as D20, H20, or
a weak solution of brine, to which it will be exposed at the observatory. The leaching action of ultrapure wa-ter on acrylic can deplete the acrylic surface of lighwa-ter molecular weight components leading to significant
environmental stress cracking,8 9 which increases
ab-sorption and scattering. However, experience with
large scale acrylic structures in sea water aquaria over
the long term indicates minimal deleterious effects with respect to environmental stress cracking.10
Spectral transmittance and reflectance measure-ments were selected for the optical characterization of the various candidate UV-grade acrylic specimens. From these measurements a consistent set of spectral optical properties-refractive index, absorption coef-ficient, and scattering coefficient-was derived. This spectrophotometric method was selected for its sim-plicity and its ability to provide reasonably accurate (within 10%) optical constant data for weakly absorb-ing materials over a wide spectral range and with mini-mum sample preparation." Both as-cast and thermo-formed acrylic specimens were evaluated as-received, and after being subjected to an accelerated aging pro-cess. These data will assist in selecting the optimum acrylic for the SNO facility and are already being used
as input in the Monte Carlo simulations of the neutrino detector response.
II. Acrylic Samples and Aging
A. Study on As-Cast Samples A, B, and C
Premium UV-grade cast acrylic sheets from three specialist suppliers: Polycast Technology Corpora-tion, CY/RO Industries, and Rohm GmbH (Germany) were selected for this initial study. Precise details of the processing histories, such as stabilization and poly-merization, of the various acrylics were kept propri-etary by the suppliers. In no particular order, these specimens are denoted here as A, B, and C. The thickness of the sheets was nominally 25 mm. Speci-mens of diSpeci-mensions 35 X 35 mm were cut and the protective paper removed. Apart from careful clean-ing of the exposed surfaces with a nonfluorescent soap solution, no optical polishing of the exposed faces was performed so that conditions similar to those that would prevail operationally in dealing with a 30-ton acrylic vessel in the field would be approximated as
closely as possible.
For the aging study, the acrylic samples were totally immersed in solutions of ultrapure H20, D20, and a 2.3% NaCl aqueous solution in quartz beakers, each covered with a quartz lid. The ultrapure H20 was taken from a double distillation system made of fused silica. The D20 was of similar high chemical purity. The brine was made up from the ultrapure H20 with 2.3% reagent grade NaCl. The concentration of NaCl is 1oX that which is envisaged for the SNO detector. The beakers plus contents were placed in a constant temperature oven for 46 days at 660 C, a temperature safely below the onset of complicating phase changes
(glass transition) known to occur around 90-105'C in commercial acrylic.12 Thereafter, all samples re-mained immersed in their respective beakers except when a particular sample was removed for the purpose of measurement. Assuming that chemical reactivity increases for every 10'C rise in temperatures by
be-tween a factor of 2 or 3, we can simulate the operation
of the SNO detector at 10'C over 10-15 yr by a 1-2 month exposure under these aging conditions. Acrylic blanks were not subjected to elevated temperature but were kept in air at room temperature.
B. Study on As-Cast and Thermoformed Samples D, E A second batch of premium UV-grade cast acrylic samples was provided in duplicate by two of the spe-cialist suppliers for tests connected with the thermo-forming process. In one case the thickness was 50 mm, and in the other 69 mm. Each supplier furnished us
with two slabs of dimensions 90 X 20 cm, from which
our samples were cut. These samples, denoted D and E, were subjected to thermoforming procedures simi-lar to those that will prevail when the cylindrical seg-ments of the acrylic vessel are formed. The thermo-forming was carried out over a metallic form in two ways: the bare metal was used in one batch and, in the other, a rubber flocking coated the form. The surfaces 1 August 1990 / Vol. 29, No. 22 / APPLIED OPTICS 3241
were kept in the as-delivered state, except for mild cleaning with nonfluorescent soap. For the aging study, the acrylic samples were immersed only in the ultrapure H20 as described in Sec. II.A.
I1. Experimental Methods
To predict accurately the path and attenuation of the Cerenkov photons in the acrylic vessel and the losses at the acrylic-water interface, it is necessary to characterize the absorbing, scattering, and refracting properties of the acrylic. The theoretical models used for determining the optical properties are described below, as are the details of the instrumentation and the verification of the experimental and computational procedures.
A. Refractive Index and Absorption Coefficient
The absorbing and refracting properties of a homo-geneous, isotropic material are described by the ex-tinction coefficient K and the refractive index n
respec-tively, which are functions of wavelength. These are termed the optical constants and are intimately con-nected with the constitutive nature of the material. Several experimental methods exist for the determina-tion of n and K,'4 with the method of choice usually
being determined by the magnitudes of n and K, the
desired wavelength range, and the instrumentation available.
In our case, we wanted to characterize the optical constants of a weakly absorbing material-acrylic-over a wide wavelength range-from 300 nm to 700 nm. The most commonly used method under these circum-stances is the measurement of normal incidence regu-lar transmittance and near-normal incidence reguregu-lar (specular) reflectance, followed by a Fresnel analysis, often referred to as the (RT) method.'5 Since we have a high precision spectrophotometer with which to per-form these photometric measurements, this was the method we adopted.
The Fresnel relationships connecting the front-sur-face primary reflectance R and the bulk or internal transmittance T for normal incidence, with the optical constants n and K at each wavelength X are:
R (n -1)1 + X2~~~~~~~~~~~(1 (n + 1)2 + K2
T
=expl47Kd) (2)where d is the sample thickness.
In Eq. (2), the term 47rK/X is often described by the
absorption coefficient a giving the familiar Lambert's
law:
T = exp(-ad). (3)
The measured sample reflectance and transmit-tance usually differ from the Fresnel quantities in Eqs. (1) and (2) because of multiple internal reflections which augment the primary reflectance and reflection losses, respectively. It is possible to restrict the reflec-tance measurement to reflecreflec-tance from the front sur-face by making the sample wedge-shaped, or grinding
the back surface and blackening it, and to reduce the reflection losses in a transmission measurement by immersing the sample in a medium of similar refrac-tive index. However, aside from the obvious inconve-nience of these procedures, it was considered advanta-geous to include the reflectance contribution from the back face, and to measure the samples in air. This enhances the measured reflectance, thereby improving its measurement accuracy, and also provides a more sensitive indicator of the sample's refracting proper-ties.
For a plane-parallel sample, the relationship con-necting the measured normal-incidence reflectance R* and transmittance T* with the quantities, R and T are:
T* (1 -R)2T 1-R2T2
R* = R(1 + TT*).
(4) (5) This is the model we assumed for the analysis of the
R*T* data. Since analytic solutions to n(R,T) and
K(R,T) do not exist, we obtained a numerical solution by a successive approximation procedure. The values of n and K, at each wavelength, were optimized to be
consistent with the measured reflectance, transmit-tance, and thickness data, within their experimental uncertainties. The convergence criterion used was that both the calculated reflectance and transmittance agree with the measured values to better than 0.004 and +0.008 units, respectively.
B. Scattering Coefficient
The path and attenuation of the Cerenkov photons in the acrylic vessel are largely determined by regular reflections and absorption, i.e., by the optical con-stants of the acrylic. However, if the acrylic does not have an optically smooth surface or contains inhomo-geneities, such as bubbles or impurities or other densi-ty fluctuations, these imperfections will act as light scattering centers, perturbing the photon's travel, and hence will contribute to losses. It was therefore im-portant to obtain an estimate of these scattering losses in the candidate acrylics.
A common method of estimating scattering coeffi-cients in turbid media is to measure the diffuse reflec-tance and to apply a Kubelka-Munk (K-M) analysis. Diffuse reflection comes about through penetration of a portion of the incident flux into the interior of the sample where it undergoes absorption and multiple scattering at uniformly and randomly distributed par-ticles before finally emerging back through the surface through which it entered.16 According to K-M theory, the diffuse reflectance (R.,) for an infinitely thick (op-tically opaque) sample depends exclusively on the ra-tio of the absorpra-tion to scattering coefficient called the K-M remission function,6"7F(R,),
(1 Rj2
S 2R&, (6)
Thus the scattering coefficients S may be deter-mined from measurements of R. if the corresponding a values are known. In our case we have the
complica-tion that the acrylic samples are not optically opaque. An approximation to the opaque reflectance R. can, however, be obtained from one of the K-M solutions,18
which is:
1 = a -(a2 1)1/2, (7)
where a is given by
a= 0.5R+ RoR ]' (8)
and Ro is the reflectance of the translucent sample over an ideal black background; R is the sample reflectance over a white background; and Rg is the reflectance of the white background material itself. This was the procedure used to determine the scattering properties
of the candidate acrylics.
C. Instrumentation and Verification of Methods
The spectral transmittance and reflectance data were obtained with a Perkin-Elmer Lambda-9 (PE X-9) spectrophotometer equipped with the appropriate sampling accessory. Measurements were carried out from 300 to 700 nm at 5-nm intervals, and at ambient temperature.
The regular transmittance spectra were measured at normal incidence in a near-collimated beam (the maxi-mum angle of convergence is 4) with an irradiated sample area of -2 X 10 mm. Two independent mea-surements were recorded on each specimen, oriented in two mutually orthogonal directions. This proce-dure, followed for all the spectrophotometric measure-ments reported here, checked for sample nonuniformi-ties. Since the instrument possesses a high degree of polarization,'9 this procedure also checked for sample birefringence, which was of particular concern for the thermoformed specimens. The agreement between these two curves was typically 0.003 transmittance units and in the worst case 0.006 transmittance units. The average result was therefore used in the optical constant calculations.
The regular reflectance spectra were measured with a VW accessory in the PE X-9 sample compartment, which gives a direct measure of the square of the abso-lute specular reflectance for a 7.5° incidence angle. This assumes that the optical path lengths traversed with and without the sample in the beam are identical. The accuracy of the method is therefore optimum for highly reflecting opaque materials but can produce accurate results for low reflecting transparent materi-als if suitable precautions, discussed below, are taken. The optical alignment of the VW accessory was checked with a calibrated second-surface aluminum mirror (NIST SRM 2023), which is -80% reflecting. Two different thicknesses (1.6 and 9.6 mm) of plane-parallel Suprasil, which are -7% reflecting, were used to check the photometric accuracy at low reflectance levels and the effect of sample thickness on the detect-ed fraction of second surface reflection. To eliminate reflections from surfaces behind a transparent speci-men, such as Suprasil, it must be backed with an ab-sorbing material. We used a piece of black felt which
is <0.5% reflecting from 300 to 700 nm, and the acrylic specimens were measured in an identical manner. The average difference between the NIST calibration values for SRM 2023 and those obtained with the VW
accessory was ±0.002 reflectance units. The agree-ment between the Suprasil reflectance values comput-ed from the Amersil catalog optical constant data, and the measured data for both the thin and thick speci-mens was better than 0.003 reflectance units. This is the estimated uncertainty of the VW accessory at the -10% reflectance level, and a second-surface recess of <10 mm. However this error will increase for samples that are not optically plane and parallel or are further recessed.
The (RT) analysis requires plane-parallel samples and an accurate measure of the sample thickness. Each acrylic specimen was measured at the four cor-ners with a high accuracy micrometer (0.01 mm) and the average result was used in the optical constant calculations. The thickness uniformity varied from +0.01 mm to + 0.16 mm depending upon the sample. This thickness nonuniformity introduces negligible er-ror in the calculated transmittance because of the large sample thicknesses involved here but may have a seri-ous effect on the calculated reflectance because the condition of parallelism is no longer satisfied.
Diffuse reflectance spectra were measured on the PE X-9 equipped with a 150-mm diam integrating sphere accessory coated with BaSO4. The measure-ment geometry was 8° incidence, hemispherical collec-tion with the specular component excluded. The irra-diated area of the specimen was -5 X 15 mm and the reference standard was pressed polytetrafluoroethyl-ene (PTFE) powder, whose absolute reflectance is cer-tified with a relative uncertainty of +0.5%. For the measurements of acrylic over a white and black back-ground, a 3-mm thick white Russian opal glass and a piece of black felt were used, respectively. The repro-ducibility of these measurements was typically better than +0.003 reflectance units.
The procedure for determining n and a values from combined RT measurements and using the a values to calculate the scattering coefficient from diffuse reflec-tance measurements is not new and has been applied successfully by Kortum et al.17 to several colored glass filters. However, in that study, the specular reflection component in the diffuse reflectance measurement was eliminated by grinding the samples to a powder and diluting with a nonabsorbing powder. Since we did not want to alter destructively the physical proper-ties of the acrylic samples, we performed diffuse-only reflectance measurements, relying on the ability of the instrument's gloss trap to exclude the specular compo-nent. To verify this approach, we performed an iden-tical set of measurements and opiden-tical constant analysis on a -2 mm-thick didymium glass filter. Since this is a translucent specimen, it was necessary to estimate its opaque reflectance in the manner described for the acrylics. This test specimen is perhaps an extreme example since it is highly spectrally selective, exhibit-ing many sharp minima and maxima. However, the computed refractive index at 590 nm of 1.69 is in 1 August 1990 / Vol. 29, No. 22 / APPLIED OPTICS 3243
0.8 E 0 4. Cc U .4-0 C,§ C 0 . C-0 U) 1n 0.6 0.4 0.2 0 .0 e 300
Fig. 2. Absorption coef C as deteri
excellent agreemen
1.69 (567.6 nm) an coefficient curve (1 mission curve [log J ably good agreeme
reported by Kortur crepancy occurs at
regular transmitti
-0.0001 units. IV. Results A. Aging Study onbeam be identical. For a thick transparent sample,
A where the reflectance contribution from the back
sur-_ B face is relatively large, this condition is not satisfied. --- c This situation occurs for those acrylic specimens which are -25-mm thick, although the associated systematic error decreases with decreasing wavelength (due to increasing absorption). To reduce this error in n, the (RY) measurements should be performed on a thinner specimen so that the actual displacement of the back surface is minimal. Unfortunately, this measurement is then a less sensitive indicator of a because of reduced absorption losses. An obvious solution to the dilemma is to determine n from an (RT) analysis on a thin acrylic specimen and to use these values as good initial estimates in a Lambert's law analysis of transmittance , I ,,,I ,,,, I, i measurements on two different sample thicknesses to
350 400 450 500 obtain a consistent set of n and a values for the three Wave length (nm) independentphotometric measurements. This
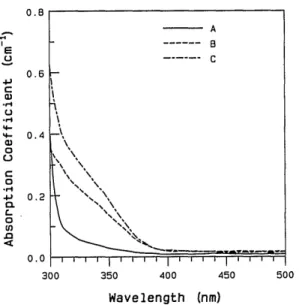
proce-ficients for unaged acrylic samples A, B, and dure is referred to here as the (RTT') method.
nined using the (RT) method. A comparison between the (RT7) method and the
(RT) method is shown in Table I for acrylic sample A at selected wavelengths. The n and a values were de-t wide-th de-the Schode-tde-t cade-talogue value of rived from R and T measurements on a 25-mm thick d the logarithm of the absorption specimen for the (RT) method and from R and T og a) and the logarithm of the re- measurements on a 10-mm thick specimen and T
mea-F(R) = log a - log S] are in reason- surements on a 25-mm thick specimen for the (RTT') ent with the corresponding curves method. Where available, literature n values have n et al.' 7 The only significant dis- been included for comparison. It can be seen that the
-580 nm where both the measured (RTT') method provides n values much closer to those ince and diffuse reflectance are obtained by more direct means (e.g., measurements of prism refraction or total internal reflection) than the
(R7) method. This is not a serious error for our appli-cation, since the n values are only needed to compute 3arnples A, B, and C the reflection losses at the acrylic-water interface
___£j!!_!_ s_
r
v1.
which are -0.4%. The reliability of the a values is a The asorption coeficients a or as-cast acrylicsamples A, B, and C, determined by the (RT) method
are shown graphically in Fig. 2 from 300 to 500 nm. While there is essentially very little change in absorp-tion above 400 nm where the curves are relatively
featureless, there exist very large variations in the range 300-400 nm, the extent of which is sample de-pendent. The increased absorption at the shorter wa-velengths is largely due to the tail of the UV absorption peak, known as the Urbach edge, which has a wave-length dependence approximated by:
a ao exp( )i (9)
where A and a0 are constants.2 0
The corresponding values of refractive index n de-rived for the acrylic samples by the (RY) method were in poor agreement with the literature values. For example, at 400 nm, the computed n values for the three samples ranged from 1.42 to 1.45 compared with a literature value of 1.507.21 This result is not
surpris-ing, since the (RT) method is known to be particularly
sensitive to minor experimental errors in the measured reflectance and transmittance. As discussed in Sec. III.C the accuracy of the VW measurements of abso-lute regular reflectance requires that the optical path
lengths traversed with and without the sample in the
Table 1. Comparison of UV Optical Constants Obtained for Unaged Acrylic Sample A by (RT) and (RTT') Methods,
n(A) a(,) cm-l A (nm) (RT) (RTT') litO (RT) (RTT') 300 1.524 1.492 0.410 0.424 310 1.478 1.509 0.091 0.093 320 1.470 1.516 0.061 0.059 335 1.463 1.514 0.038 0.037 350 1.456 1.514 0.025 0.022 365 1.452 1.510 1.514 0.017 0.014 385 1.450 1.511 0.010 0.007 405 1.448 1.505 1.507 0.009 0.006
a For details of measurements, see text.
0.5 0.4 0.3 0.2 0. 1 .0 r0 300 E 4., C a) U .4-a) 0 LI C 0 0. 4-) 0 U) .0 0.8 0.6 0.4 0.2 I , I I I 0.01-320 340 360 380 400 300 Wavelength (nm)
Fig. 3. Absorption coefficients for acrylic sample A following aging
in various liquids.
320 340 360 380 400
Wavelength (nm)
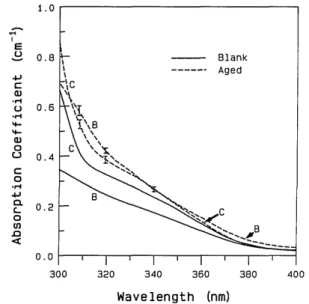
Fig. 4. Absorption coefficients for acrylic samples B and C follow-ing agfollow-ing in water.
more serious concern since they have a greater impact
on the overall detection efficiency. For a 2.5-cm thick
acrylic vessel, the relative difference in attenuation predicted by the two sets of a values in Table I is <5%.
Consequently, we adopted the set of n(G) values deter-mined for acrylic sample A by the (RTT') method as representative of the various UV transmitting acrylics and used the simpler (RY) method to obtain a(X) data for each of the acrylic specimens, before and after
aging.
Figure 3 gives the a values derived for acrylic sample A, after aging in ultrapure H20, D20, and a brine solution, as described in Sec. II.A. Comparison with the as-received specimen indicates a similar signifi-cant increase in absorption irrespective of the particu-lar liquid into which the acrylic was immersed. Thick-ness measurements showed that the sample had swollen by -0.1 mm. These observations were
gener-ally true for acrylic samples A, B, and C. However, the
extent of the increased absorption upon aging was sample dependent, as can be seen in Fig. 4 which compares a curves for as-received and aged samples B and C. The error bars indicate the range of a values measured for the different immersion liquids.
To obtain complementary data about the degree of light scattering from the various candidate acrylics, diffuse reflectance measurements were carried out as discussed in Sec. III.B. Figure 5 gives an illustration of the procedure for estimating the opaque diffuse reflectance R., of the acrylic by Eq. (7) from measure-ments of the diffuse reflectance of the acrylic over a black background Ro, over a white background R, and of the white background itself Rg.
Since K-M theory does not take account of regular reflection, the K-M equations are only valid for mea-surements of the diffuse component of reflected flux. Here we have assumed that the instrument's gloss trap excludes this regular component. The validity of this basic approach has been checked (Sec. III.C), but even
1.0 cm cc ¢ Ca) C0 4., U '-.4 4-am cc a} U) c: .4-
.-0
0.8 0.6 0.4 0.2 0.0 0. 10 cc8 0.08 a qa 0.06 C X 4., U a) 0.04 4-a1) cc a) U) 0.02 ' .4-0 ..4-0.4-0 300 400 500 600 700 Wavelength (nm)Fig. 5. Opaque diffuse reflectance, R., of unaged acrylic sample A from 300 to 700 nm as derived from one of the Kubelka-Munk solutions in which Ro is sample reflectance over black felt back-ground, R is the sample reflectance over a white opal backback-ground, and Rg is reflectance of white opal glass. See text for further details.
a small systematic error can be significant when the sample reflectance is low. To evaluate the magnitude of this error we performed diffuse reflectance measure-ments on a piece of high optical quality quartz. This test sample should be representative of the error in-curred with the acrylics since its regular reflectance is of the same order as that of the acrylic samples (-7%). If the gloss trap was perfect, its diffuse reflectance should measure zero. Instead, we found this system-atic error to be measurably small but increasing with decreasing wavelength, being 0.0002-reflectance units at 700 nm and 0.0007 reflectance units at 300 nm. Since the measured diffuse reflectance of the acrylics 1 August 1990 / Vol. 29, No. 22 / APPLIED OPTICS 3245
-E ., 4 C a) U .- .4-a, 0 0 4., L. 0 U) .0 i.0
over black backing is very low (< 1%) this error term is significant. We therefore corrected these diffuse re-flectance measurements before computing the acry-lic's opaque reflectance, R,.
The scattering coefficients S were then calculated directly from Eq. (6), after substitution of the previ-ously determined a values from the (RT) analysis. The computed S curves for acrylic sample A, before and after immersion in the various liquids, are shown in Fig. 6 from 300 to 500 nm. The reproducibility of this procedure was independently checked by subject-ing a second acrylic specimen to immersion in H20 and evaluating its S curve in an identical manner. It can be seen that the agreement of this repeat measurement is extremely good, being within 0.0002 cm-' of the first set of measurements. Similar S data were determined for acrylic samples B and C. However, their obviously poorer UV optical transmittance characteristics pre-clude their further consideration for our purposes. All three evaluated acrylics exhibit a large increase in scattering with decreasing wavelength suggesting a predominance of Rayleigh scattering which has a X-4
dependence, but, unlike the a curves, the extent of the increased scattering in the aged samples depends upon the particular immersion liquid. For example, at 300 nm, sample B exhibits a 2.5 X increase in scattering for all three immersion liquids compared with the blank specimen, whereas, sample A exhibits a 2 X increase for immersion in D20 and a 3 X increase for immersion in H20 and in brine. In the visible region, the computed S values for all three unaged acrylic samples range from (2-5) X 10-4 cm-', with the lowest value being in excellent accord with that determined by Crist and Marhic4 at 570 nm using a light scattering goniometer
(S = 2.3 X 10⁻⁴). However, these authors also report a
values of -10-4 cm'1 from 488 to 680 nm which are almost an order of magnitude smaller than those
deter-0.005 I E 4) C a, U . 4-a) 0 Cn L a, .4-) .4., 'U U Uf) 0.004 0.003 0.002 0.001 0.000 e 300 350 400 450 500 Wavelength (nm)
Fig. 6. Scattering coefficients for unaged acrylic sample A
comput-ed from Kubelka-Munk remission function and from a-data derivcomput-ed from (RT) analysis. See text for further details.
mined in this study. There are two plausible explana-tions for this discrepancy. First, Crist and Marhic's study was conducted on extremely pure optical grade acrylic and not on commercially available UV-grade acrylic. Second, the inherent accuracy of the (R7) method is insufficient to determine extremely small a
values of
-10-4cm-'. However, it is adequate at
extracting a data (to better than 10%) at the level of 10-2 cm-' assuming relatively small experimental er-rors in R and T (<1%). This is the situation encoun-tered here in the characterization of UV optical con-stants of UV transmitting acrylics and, therefore, does not pose a serious impediment to our application.
B. Aging Study on Samples D and E
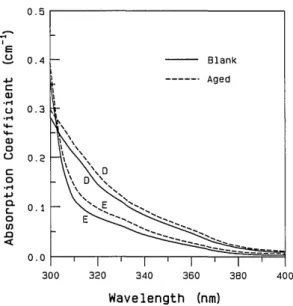
The values of a derived for as-cast acrylic samples D and E, before and after aging in ultrapure H20 are shown in Fig. 7 from 300 to 400 nm. It can be seen that these specimens are generally superior to the previous candidates A, B, and C, both in terms of their reduced absorption losses in the UV region, and also their re-tention of these favorable characteristics after aging. The aged samples D and E also increased by only
-0.1% and -0.2%, respectively, in thickness as
com-pared with an -0.4% increase with aged samples A, B, and C. The absorption coefficient results for the aging study on the thermoformed versions of samples D and E are shown in Figs. 8 and 9. The designations BM and RF refer to the thermoforming procedure used, i.e., over bare metal or over metal coated with rubber flocking, respectively. It can be seen that the RF process produces a slightly superior acrylic, although both thermoformed samples exhibit improved reten-tion of their optical properties compared with the unthermoformed samples. While the optical trans-mittance of the as-cast and thermoformed versions of sample D are closely similar, those of sample E are
0.5 C E ,% 4J U -4 .4--a) 0 LI C 0 .4. 0. C-0 U1) .0 0.4 0.3 0.2 0.1 0.0 300 320 340 360 380 400 Wavelength (nm)
Fig. 7. Absorptioncoefficients for blank and aged specimens of
0.5 I.-E U .4., 4J C IU .- 4-a, 0 LI C 0 .4. 0 Uf) .0 0.4 0. 3 0.2 0. 300 Fig. 8. Absorption c specimens of acrylic thermoforming took 1.0 I.-E C 4- .4-a, 0 LI C 0 .4,l .,, 4) 0 U) .0 0.8 0.6 0.4 0.2 0. O-300 Fig. 9. Absorption cl specimens of acrylic s thermoforming took p profoundly differ exhibiting signific V. Discussion This investigat grade acrylics ha regarding its use which also have systems. The op
significantly, part
samples from diffE ent formulations turer. For examp
nm for as-cast unaged acrylics vary by a factor of 2.5,
Thermoformed ranging from 0.29 to 0.72 cm-'. Since it is impractical Sample D to evaluate all of the acrylic raw material to be used in
the SNO detector, the material and processing
vari-Blank ables will have to be carefully controlled by the
manu--- Aged facturer. Regarding the weatherability of the acrylics,
it was found generally that prolonged immersion of the as-cast specimens in the various liquids led to an over-all deterioration in optical transmittance, and an in-crease in scattering, the extent depending on the
par-%BM
ticular acrylic under study, with the greatest
differences occurring in the wavelength interval
300-RF 400 nm. However, sample D exhibited minimal
dete-rioration in its optical transmittance upon aging or upon thermoforming. It is important to note that the
| | , I surfaces of the acrylics did not visibly craze due to long
320 340 360 380 400 term exposure to ultrapure water, heavy water or
Wavelength (nm) brine. It is also interesting that the thermoformed
coefficients for thermoformed blank and aged acrylics appeared to be more durable than the
corre-Sample D. BM and RF refer to whether the sponding as-cast samples in retaining their optical
lace over bare metal or rubber flocked metal, properties after long-term liquid immersion.
respectively. The acrylic absorption data obtained in this study,
in conjunction with the previously determined D20
and H20 absorption data,2 has enabled the perfor-mance of the proposed SNO neutrino detector to be
Thermoformed modeled. Given a hypothetical neutrino event at the
Sample E center of the D20 volume, the resultant Cerenkov
radi-Blank ation traverses 5 m of D20, 5 cm of acrylic wall, and 2.5 --- Aged m of H20 before being recorded at the photomultiplier
tubes. Using absorption data for thermoformed spec-imens of samples D and E [Figs. 8 and 9] and normaliz-ing to the photomultiplier quantum efficiency
re-3M sponse,7 the transmittance of Cerenkov radiation is
0.685 (sample D) and 0.668 (sample E). Since the transmittance for 5-cm thick acrylic alone is 0.843
(sample D) and 0.815 (sample E), absorption losses are shared approximately equally between water and acrylic. While the transmittances for aged and blank unthermoformed versions of sample E are 0.899 and
| I I I 0.918, respectively, the thermoforming process
drasti-320 340 360 380 400 cally lowers the transmittances for aged and blank Wavelength (nm) specimens to a value of 0.815 + 0.003. In contrast, for
)efficients for thermoformed blank and aged sample D, there was essentially little difference in
ample E. BM and RF refer to whether the transmittance for thermoformed and
unthermo-lace over bare metal or rubber flocked metal, formed specimens and for aged and blank specimens;
respectively. the value for transmittance was 0.843 0.008. Since the acrylic vessel will be largely thermoformed, this 3.4% gain in transmitted radiation for thermoformed mnt, with the thermoformed samples sample D over thermoformed sample E is important :antly higher absorption. for optimizing the neutrino detector, and is
consider-ably more cost-effective than increasing the photo-cathode coverage.
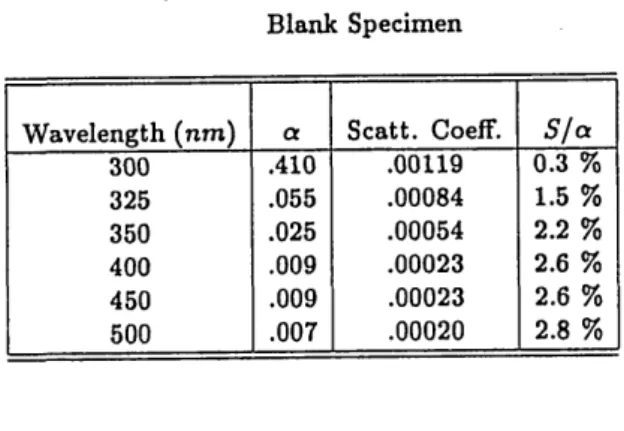
[on of the optical properties of UV- The Monte Carlo reconstruction of neutrino events s answered a number of questions in the SNO detector also requires information on the in the proposed SNO detector, but relative amounts of absorption and scattering of Ce-bearing on design of other optical renkov photons. In Table II, the absorption and scat-tical transmittance properties vary tering coefficients, and S/a percentages for blank and icularly in the UV region, for acrylic immersed (in D20) specimens of sample A acrylic are ,rent manufacturers and even differ- summarized. In current simulations, input
parame-r batches fparame-rom the same manufac- ters of S/a which vary from 0.5% at 300 nm up to -4.1% le, the absorption coefficients at 300 in the visible region for immersed acrylic, are used.
Table 11. Absorption and Scattering Coefficients for Sample A
Blank Specimen
Wavelength (nm) ct Scatt. Coeff. S/c 300 .410 .00119 0.3 % 325 .055 .00084 1.5 % 350 .025 .00054 2.2 % 400 .009 .00023 2.6 % 450 .009 .00023 2.6 % 500 .007 .00020 2.8 % Specimen Immersed in D20
Wavelength (nm) a Scatt. Coeff. S/a 300 .488 .00250 0.5 % 325 .099 .00186 1.9 % 350 .043 .00112 2.6 % 400 .013 .00045 3.5 % 450 .009 .00037 4.1 % 500 .006 .00025 4.2 % Note: a and S in cm 1. VII. Conclusions
Optical properties of several premium UV transmit-ting acrylics have been determined as a function of wavelength via spectrophotometric methods. These acrylic specimens are proposed for use in a heavy water Cerenkov detector (SNO). The results suggest that the optical properties, particularly in the UV region, depend on the manufacturer, the fabrication, and the aging history. While immersion aging in H20, D20, and brine similarly affect their absorption properties, this is not necessarily the case for the scattering prop-erties. Thermoformed specimens appear to display greater integrity of their optical properties to immer-sion aging compared with unthermoformed specimens. Acrylic samples A and D tested here exhibit the best optical performance for the SNO detector and their measured absorption, scattering and refractive data have been used in Monte Carlo simulations of the detector response with respect to reconstruction of neutrino events. The proposed SNO detector has re-ceived (Jan. 1990) final approval with respect to fund-ing, and has moved to project status.
The authors acknowledge the contributions of R. S. Storey in the initial phases of this study, I. P. Powell for a complementary measurement of the refractive index of acrylic, and B. R. Hollebone for assistance in aging the samples.
References
1. Sudbury Neutrino Observatory Proposal, G. T. Ewan et al., October 1987, unpublished: G. Aardsma et al., "A Heavy Water Detector to Resolve the Solar Neutrino Problem," Phys. Lett. B
194, 321-325 (1987).
2. L. P. Boivin, W. F. Davidson, R. S. Storey, D. Sinclair, and E. D.
Earle, "Determination of the Attenuation Coefficients of Visible and Ultraviolet Radiation in Heavy Water," Appl. Opt.
25,877-882 (1986).
3. N. J. Mills, "Optical Properties" section, Encyclopedia of Poly-mer Science and Technology (Interscience, New York, 1987),
Vol. 10, p. 493.
4. B. Crist and M. Marhic, "Light-Scattering and Absorption by Glassy Poly(Methyl Methacrylate)(PMMA) and Polystyrene (PS)," Proc. Photo-Opt. Instrum. Engr. 297, 169-172 (1981).
5. R. W. Jans, "Acrylic Polymers for Optical Applications," Proc.
Photo-Opt. Instrum. Engr. 204, 2-10 (1979).
6. R. G. Griskey, "Optical and Mechanical Behavior of Polymers,"
Proc. Photo-Opt. Instrum. Engr. 204, 11-18 (1979).
7. K. Hume et al., "20 Inch Diameter Photomultiplier," Nucl.
Instrum. Methods, 205, 443-449 (1983).
8. H. H. Kausch and J. G. Williams, "Fracture and Fatigue" sec-tion, Encyclopedia of Polymer Science and Engineering (Wiley
Interscience, New York, 1987), Vol. 7, p. 328; P. I. Vincent,
"Fracture" section, Encyclopedia of Polymer Science and
Technology (Wiley Interscience, 1st Edition, New York) Vol. 7,
p. 261.
9. "Selecting Plastics for Chemical Resistance," section Modern
Plastics Encyclopedia (McGraw Hill, New York, 1986-1987),
Vol. 63, pp 419-424.
10. J. D. Stachiw, Acrylic Plastic Viewports-Ocean Engineering and Other Hyperbaric Applications, Ocean Engineering Series,
N. T. Monney, Ed., Naval Ocean Systems Center, (Marcel Dek-ker Inc, New York, 1982).
11. Y. Lu and A. Penzhofer, "Optical Constants Measurements of
Strongly Absorbing Media," Appl. Opt. 25, 221-225 (1986).
12. R.-J. Roe, "Glass Transition," section, Encyclopedia of Polymer
Science and Technology (Wiley Interscience, New York, 1987),
Vol. 7, p. 531.
13. S. Glasstone, Textbook of Physical Chemistry (D. Van
Nos-trand, New York, 1946), p. 1087.
14. E. Denton, R. D. Campbell, and S. G. Tomlin, "The
Determina-tion of the Optical Constants of Thin Films from Measurements of Reflectance and Transmittance at Normal Incidence," J.
Phys. D 5, 852-863 (1972).
15. A. Hjortsberg, "Determination of Optical Constants of Absorb-ing Materials UsAbsorb-ing Transmission and Reflection of Thin Films on Partially Metallized Substrates: Analysis of the New (TRm)
Technique," Appl. Opt. 20, 1254-1263 (1981).
16. W. W. Wendlandt and H. G. Hecht, in Reflectance Spectrosco-py, Chap. III, Theory II-"Diffuse Reflectance," (Interscience,
New York, 1966).
17. G. Kortum, W. Braun, and G. Herzog, "Principles and
Tech-niques of Diffuse-Reflectance Spectroscopy," Angew. Chem. Int. Ed. Engl. 2, 333-341 (1963).
18. J. N. Etters and M. D. Hurwitz, "Opaque Reflectance of
Trans-lucent Fabric," Text. Chem. Color. 18(6), 19-26 (1986). 19. J. C. Zwinkels and C. X. Dodd, "Determination of
Spectropho-tometer Polarization and its Application to Rapid Accurate Polarized Transmission Measurements," Appl. Opt. 28,
2381-2388 (1989).
20. R. M. Glen, "Polymeric Optical Fiber," Chematronics 1,98-106
(1986).
21. R. M. Altman and J. D. Lytle, "Optical Design Techniques for
Polymer Optics," Proc. Phot. Opt. Instrum. Engr. 237, 380-385