FINAL REPORT FROM TASK 7 OF MEWS PROJECT AT THE INSTITUTE FOR RESEARCH IN CONSTRUCTION Long-Term Performance Predict the Moisture Management Performance of Wall Systems as a Function of Climate, Material
Properties, etc. Through Mathematical Modelling
Mukhopadhyaya, P.; Kumaran, K.; Tariku, F.; van Reenen, D.
IRC-RR-132
February 2003
IMPORTANT NOTICE TO READERS
The main emphasis of the MEWS project was to predict the hygrothermal responses of several wall assemblies that are exposed to North American climate loads, and a range of water leakage loads. Researchers used a method based on both laboratory experimentation and 2-D modeling with IRC’s benchmarked model, hygIRC. This method introduced built-in detailing deficiencies that allowed water leakage into the stud cavity - both in the laboratory test specimens and in the virtual (modeling) “specimens”- for the purpose of investigating water entry rates into the stud cavity and the drying potential of the wall assemblies under different climate loads. Since the project was a first step in investigating a range of wall hygrothermal responses in a parametric analysis, no field study of building characteristics was performed to confirm inputs such as water entry rates and outputs such as wall response in a given climate. Rather, ranges from ‘no water entry and no response’ to ‘too much water entry and too wet for too long’ were investigated.
Also, for the sake of convenience, the project used the generic cladding systems (e.g., stucco, masonry, EIFS, and wood and vinyl siding) for labeling and reporting the results on all wall assemblies examined in the study. However, when reading the MEWS publications, the reader must bear in mind that the reported results are more closely related to the nature of the deliberately introduced deficiencies (allowing wetting of the stud cavity) and the construction details of the wall systems investigated (allowing wetting/drying of the assembly) than to the generic cladding systems themselves. As a general rule, the reader must assume, unless told otherwise, that the nature of the deficiencies and the water entry rates into the stud cavity were different for each of the seventeen wall specimens tested as well as for each of the four types of wall assemblies investigated in the modeling study. For this reason, simply comparing the order of magnitude of results between different cladding systems would take the results out of context and likely lead to erroneous conclusions.
MEWS PROJECT REPORT - TASK 7: FEBRUARY 2003
FINAL REPORT FROM TASK 7 OF MEWS PROJECT AT THE INSTITUTE FOR RESEARCH IN CONSTRUCTION
Long-term Performance: Predict the Moisture Management Performance of Wall Systems as a Function of Climate, Material Properties, etc. Through Mathematical
Modelling
IRC Research Team
Peter Beaulieu Mostafa Nofal
Mark Bomberg Nicole Normandin
Steve Cornick Mike Nicholls
Alan Dalgliesh Tim O’Connor
Guylaine Desmarais David Quirt
Reda Djebbar Madeleine Rousseau
Kumar Kumaran Nady Said
Michael Lacasse Mike Swinton
John Lackey Fitsum Tariku
Wahid Maref David van Reenen
Phalguni Mukhopadhyaya
MEWS Steering Committee
David Ritter, Louisiana Pacific Corporation Eric Jones, Canadian Wood Council Fred Baker, Fortifiber Corporation Gary Sturgeon, Masonry Canada Michael Bryner, EI DuPont de Nemours & Co Sylvio Plescia, CMHC
Gilles Landry, Fiberboard Manufacturers
Association of Canada Fadi Nabhan, IRC, NRC Canada Stephane Baffier, CPIA David Quirt, IRC, NRC Canada Paul Morris, Forintek Canada Corporation Kumar Kumaran, IRC NRC Canada Greg McManus, Marriott International Inc. Michael Lacasse, IRC NRC Canada Stephan Klamke, EIMA
List of Contents
Page
Summary 8
CHAPTER A - Stucco Walls 11
1.0 Parameters under consideration 12
2.0 hygIRC and Input for Simulation 12
2.1 Basic Wall Construction Details 13
2.2 Material Properties 15 2.2.1 Air permeability 15 2.2.2 Thermal conductivity 16 2.2.3 Dry density 16 2.2.4 Heat capacity 17 2.2.5 Sorption isotherm 17 2.2.6 Suction curve 17
2.2.7 Water vapour permeability 17
2.2.8 Liquid diffusivity 17
2.3 Boundary Conditions 38
2.3.1 Indoor Environment 38
2.3.2 Outdoor Environment 38
2.4 Exposure Duration 39
2.5 Initial Moisture Content and Temperature 39
2.6 Accidental Moisture Entry - Quantity and Location 39
3.0 Results from hygIRC Simulation 40
3.1 Results from Parametric Studies 43
3.1.1 Exterior cladding (3 types of stucco) 43
3.1.2. Sheathing membrane (3 types) 48
3.1.3. Sheathing board (3 types of oriented strand board (OSB), fibre board (FB), Plywood) 48
3.1.4. Vapour barrier (3 types) 48
3.1.5. Locations with seven different Moisture Indices (MI) 49 3.1.6. Yearly climate variation (Wet-Wet-Average (WWA) and Wet-Wet-Dry (WWD)) 50
3.1.7. Accidental moisture entry inside the wall 50
3.1.8. Quantity of accidental moisture entry 50
3.1.9. Presence of a ventilation cavity inside the wall (i.e. behind the exterior cladding) 51
3.1.10. Interior RH 51
3.1.11. Air leakage 52
3.1.12. Elimination of 1mm air gap between sheathing board and sheathing membrane 53
3.1.13. Optimization of stucco properties 53
3.1.14. Best & Worst combination of materials 53
3.1.15. Removal of vapour barrier 53
3.1.16. Use of coated gypsum board with no vapour barrier 54
3.1.17. Alternate Wet and Average years 54
4.0 Concluding Remarks 54
Page
CHAPTER B - EIFS Walls 56
1.0 Parameters under consideration 57
2.0 hygIRC and Input for Simulation 57
2.1 Basic Wall Construction Details 57
2.2 Material Properties 59 2.2.1 Air permeability 59 2.2.2 Thermal conductivity 59 2.2.3 Dry density 60 2.2.4 Heat capacity 60 2.2.5 Sorption isotherm 60 2.2.6 Suction curve 60
2.2.7 Water vapour permeability 60
2.2.8 Liquid diffusivity 60
2.3 Boundary Conditions 69
2.4 Exposure Duration 69
2.5 Initial Moisture Content and Temperature 69
2.6 Accidental Moisture Entry - Quantity and Location 69
3.0 Results from hygIRC Simulation 70
3.1 Results from Parametric Studies 72
3.1.1 Base and finish coat thickness of EIFS cladding 72
3.1.2 Sheathing Membrane 76
3.1.3 Sheathing Board 76
3.1.4 Vapour Barrier 76
3.1.5 Insulation 77
3.1.6 Moisture Entry Location 78
3.1.7 Quantity of Moisture Entry 78
3.1.8 Yearly climate variation (Wet-Wet-Average (WWA) and Wet-Wet-Dry (WWD)) 78
3.1.9 Interior RH 80
3.1.10 Use of coated gypsum board with no vapour barrier 80 3.1.11 Locations with seven different Moisture Indices (MI) 81
3.1.12 Air leakage 81
4.0 Concluding Remarks 83
Page
CHAPTER C - Masonry Walls 84
1.0 Parameters under consideration 85
2.0 hygIRC and Input for Simulation 85
2.1 Basic Wall Construction Details 85
2.2 Material Properties 85 2.2.1 Air permeability 87 2.2.2 Thermal conductivity 87 2.2.3 Dry density 88 2.2.4 Heat capacity 88 2.2.5 Sorption isotherm 88 2.2.6 Suction curve 88
2.2.7 Water vapour permeability 88
2.2.8 Liquid diffusivity 88
2.3 Boundary Conditions 91
2.4 Exposure Duration 91
2.5 Initial Moisture Content and Temperature 91
2.6 Accidental Moisture Entry - Quantity and Location 91
3.0 Results from hygIRC Simulation 91
3.1 Results from Parametric Studies 98
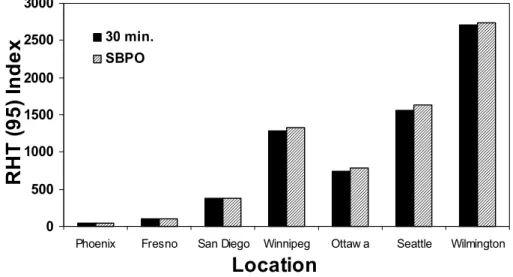
3.1.1 Brick cladding (3 types: Clay brick, Concrete brick and Calcium silicate brick) 98 3.1.2 Two sheathing membranes (2 types: 30 minute building paper and SBPO polymeric
membrane) 98
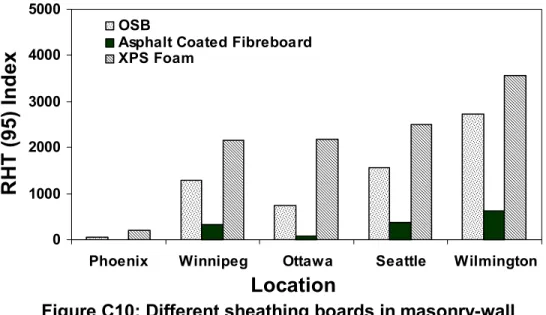
3.1.3 Three sheathing boards (OSB, Asphalt coated fibreboard and XPS foam sheathing board) 99
3.1.4 Three vapour barriers 100
3.1.5 Width of drainage cavity behind exterior cladding (25mm and 50mm) 101
3.1.6 Quantity of accidental moisture entry 101
3.1.7 Locations with seven different Moisture Indices (MI) 102
4.0 Concluding Remarks 103
Page
CHAPTER D - Siding Walls (Hardboard & Vinyl) 104
1.0 Parameters under consideration 105
2.0 hygIRC and Input for Simulation 105
2.1 Basic Wall Construction Details 106
2.2 Material Properties 106 2.2.1 Air permeability 106 2.2.2 Thermal conductivity 110 2.2.3 Dry density 110 2.2.4 Heat capacity 111 2.2.5 Sorption isotherm 111 2.2.6 Suction curve 111
2.2.7 Water vapour permeability 111
2.2.8 Liquid diffusivity 111
2.3 Boundary Conditions 124
2.4 Exposure Duration 124
2.5 Initial Moisture Content and Temperature 124
2.6 Accidental Moisture Entry - Quantity and Location 124
3.0 Results from hygIRC Simulation 124
3.1 Results from Parametric Studies 135
Hardboard Siding:
3.1.1 Sheathing board (4 types: OSB, Plywood, Uncoated fibre board, Asphalt coated fibre board) 135 3.1.2 Sheathing membrane (2 types: SBPO polymeric membrane and 60 minute building paper) 136
3.1.3 Vapour barrier (2 types: Type I, Variable) 136
3.1.4 Locations with seven different Moisture Indices (MI) 136
3.1.5 Accidental moisture entry inside the wall 137
3.1.6 Quantity of accidental moisture entry 137
3.1.7 Use of coated gypsum board with no vapour barrier 137 3.1.8 Presence of a19mm ventilation cavity inside the wall (i.e. behind the exterior cladding) 140 Vinyl Siding:
3.1.9 Accidental moisture entry inside the wall 140
3.1.10 Quantity of accidental moisture entry 140
3.1.11 Locations with seven different Moisture Indices (MI) 141 3.1.12 Sheathing board (2 types: OSB and Extruded Polystyrene (XPS) foam board) 141 3.1.13 Sheathing membrane (2 types: SBPO polymeric membrane and 30 minute building paper) 141 3.1.14 Vapour barrier (2 types: Type I and Type II) 142 3.1.15 Use of coated gypsum board with no vapour barrier 142 3.1.16 Presence of a19mm ventilation cavity inside the wall (i.e. behind the exterior cladding) 142
4.0 Concluding Remarks 142
APPENDICES
PageAppendix A1 Drying Curves - Stucco Wall 143
Appendix A2 RHT Indices - Stucco Wall 206
Appendix B1 Drying Curves - EIFS Wall 209
Appendix C1 Drying Curves - Masonry Walls 264
Appendix D1 Drying Curves - Siding Walls 304
Summary
This document is one of the major outcomes from the consortium project called MEWS (Moisture Management in Exterior Wall Systems), carried out at the Institute for Research in Construction (IRC) of National Research Council (NRC), Canada. This report deals with the parametric analyses of four different types of wall assemblies in a building envelope. The four types of walls considered are (1) Stucco walls, (2) EIFS walls, (3) Masonry walls, and (4) Siding walls. The parametric analysis was done using IRC's hygrothermal modelling tool hygIRC. hygIRC is a 2-dimensional numerical modelling tool specifically developed for research purposes and it is continuously evolving at the IRC/NRC. The utility and reliability of hygIRC outputs have been established through laboratory measurements and benchmarking exercises.
This report has all the necessary information for hygIRC input (e.g. material properties, construction details, assumptions made for indoor and outdoor boundary conditions etc.) and the outputs obtained from the hygIRC simulations. A total of around 450 hygIRC simulations were done. The parameters studied here involve a wide range of options that represent the variation in material properties, construction details, boundary (indoor and outdoor) conditions, geographical location of the construction and many others. The basic output data are presented in the form of drying curves over a time period of two years. Drying curves present the change in moisture content with time in the wall and in each of its major components. These drying curves indicate the overall moisture response of the wall assembly. However, most of the moisture related problems in building envelopes or wall systems manifest initially in a concentrated localised area of the wall. In the MEWS project this localised area for moisture related problems is termed as the 'region of focus'. In other words, a small area of the wall cross section has been selected, based on the relative humidity (RH) and temperature (T) distribution pattern, and the hygrothermal conditions of this selected area was closely monitored over a period of two years. In order to quantify the hygrothermal response of the 'region of focus', a novel hygrothermal performance indicator, aptly named the 'RHT index', has been introduced in this study. The RHT index captures the duration of the coexistence of moisture and thermal conditions above a set of threshold values (see Chapter A for more details). This RHT index was used as a measure to do parametric analyses. In fact a methodology, the MEWS methodology, to compare the long-term hygrothermal performance of various wall systems, and its components, at various geographical locations has been evolved from the results of the parametric analyses. The RHT index introduced in task 7 and Moisture index (MI) developed in Task 4 are the two fundamental building blocks of the MEWS methodology.
There are four chapters in this document and each of them exclusively deals with one of the four types of wall systems considered in MEWS. These four chapters are:
Chapter A: Parametric Studies - Stucco Walls Chapter B: Parametric Studies - EIFS Walls Chapter C: Parametric Studies - Masonry Walls
Chapter D: Parametric Studies - Siding Walls (Hardboard & Vinyl) In Chapter A, seventeen (17) parameters have been investigated for wood-frame stucco-walls. These parameters are:
(i) Exterior cladding, (ii) Sheathing membrane, (iii) Sheathing board,
(iv) Vapour barrier,
(v) Geographic locations with seven different Moisture Indices (MI), (vi) Yearly climate variation,
(vii) Accidental moisture entry inside the wall, (viii) Quantity of accidental moisture entry,
(ix) Presence of a ventilation cavity behind the stucco cladding, (x) Interior relative humidity (RH),
(xi) Air leakage,
(xii) Elimination of 1mm air gap between sheathing board and sheathing membrane, (xiii) Optimization of stucco properties,
(xiv) Best and worst combination of materials, (xv) Removal of vapour barrier,
(xvi) Use of coated gypsum board with no vapour barrier, and (xvii) Alternate, wet and average years.
In Chapter B, twelve (12) parameters have been investigated for EIFS-walls. These parameters are:
(i) Base and finish coat thickness of EIFS cladding, (ii) Sheathing membrane,
(iii) Sheathing board, (iv) Vapour barrier, (v) Insulation,
(vi) Moisture entry location, (vii) Quantity of moisture entry, (viii) Yearly climate variation, (ix) Interior RH,
(x) Use of coated gypsum board with no vapour barrier,
(xi) Geographic locations with seven different Moisture Indices (MI), and (xii) Air leakage.
In Chapter C, seven (7) parameters have been investigated for masonry-walls. These parameters are:
(i) Brick cladding,
(ii) Two sheathing membranes, (iii) Three sheathing boards, (iv) Three vapour barriers,
(v) Width of drainage cavity behind exterior cladding, (vi) Quantity of accidental moisture entry, and
(vii) Geographic locations with seven different Moisture Indices (MI).
In Chapter D, a total of sixteen (16) parameters have been investigated for siding-walls. Hardboard siding and vinyl siding are the two types of walls considered in this study. Each wall type has eight (8) parameters and these parameters are:
Hardboard Siding-
(i) Sheathing board,
(ii) Sheathing membrane, (iii) Vapour barrier,
(iv) Geographic locations with seven different Moisture Indices (MI), (v) Accidental moisture entry inside the wall,
(vi) Quantity of accidental moisture entry,
(vii) Use of coated gypsum board with no vapour barrier, and (viii) Presence of a 19mm ventilation cavity.
Vinyl Siding-
(i) Accidental moisture entry inside the wall, (ii) Quantity of accidental moisture entry,
(iii) Geographic locations with seven different Moisture Indices (MI), (iv) Sheathing board,
(v) Sheathing membrane, (vi) Vapour barrier,
(i) Use of coated gypsum board with no vapour barrier, and (ii) Presence of a 19mm ventilation cavity.
It is to be noted that parametric analyses results, depicted in a concise fashion, in the aforementioned four chapters are the basis for a major part of the MEWS Task 8 reports on various wall systems. This report contains all the information relevant to parametric studies and the analysis of outcome from the hygIRC simulations. For further and detailed analysis of the results, in global MEWS context, readers should refer the relevant chapters in MEWS Task 8 report.
Chapter A
Chapter A
Parametric Studies - Stucco Walls
1.0 Parameters under Consideration
Following are the major parameters considered in this study and presented in the MEWS task group meetings.
1. Exterior cladding (3 types of stucco) 2. Sheathing membrane (3 types)
3. Sheathing board (3 types of oriented strand board (OSB), fibre board (FB), Plywood)
4. Vapour barrier (3 types)
5. Locations with seven different Moisture Indices (MI) (Wilmington: 1.13, Seattle: 0.99, Ottawa: 0.93, Winnipeg: 0.86, San Diego: 0.74, Fresno: 0.49 & Phoenix: 0.13)
6. Yearly climate variation (Wet-Wet-Average (WWA) and Wet-Wet-Dry (WWD)) 7. Accidental moisture entry inside the wall
8. Quantity of accidental moisture entry
9. Presence of a ventilation cavity inside the wall (i.e. behind the exterior cladding) 10. Interior RH
11. Air leakage
12. Elimination of 1mm air gap between sheathing board and sheathing membrane 13. Optimization of stucco properties
14. Best & Worst combination of materials 15. Removal of vapour barrier
16. Use of coated gypsum board with no vapour barrier 17. Alternate Wet and Average years
These parameters were chosen by MEWS research team to investigate various moisture management issues related to stucco-walls. These chosen parameters also encompass the suggestions and comments obtained from the representatives of the MEWS partners.
2.0 hygIRC and Input for Simulation
hygIRC is IRC's modelling tool for hygrothermal simulation. Interested readers are
referred to Karagiozis, 1993,1997; Karagiozis et al., 1996; and Djebbar et al., 2002a,b which document, in detail, the formulation of the combined heat, air and moisture transport equations used in hygIRC and the techniques used to solve them numerically.
hygIRC accommodates many advanced features, such as transient heat, air and moisture
(liquid and vapour) transport, 2 -dimensional spatial formulation, variable material properties with moisture content and temperature, air flow through building materials, effect of solar radiation, presence of moisture source inside the material, freezing-thawing effect, as well as other useful features.
hygIRC also has the capability to define accidental moisture entry of any quantity as a
function of time at any location of the wall. This accidental moisture entry feature of
hygIRC has been widely used in this study.
hygIRC has a pre-processor that allows the user to divide a wall into a number of layers,
both in the horizontal and vertical directions. Using this tool a wall-section can be divided in several layers to accommodate its material and geometrical specifications and specific construction details. Each of these layers is 'meshed' into rectangular elements by dividing each layer horizontally and vertically. The pre-processor allows the division of each layer into a number of elements that can be each of equal size or either expanded or contracted towards the boundary or centre, as specified by the user, according to designated stretching factor. This provision helps to obtain more efficient solutions derived from numerical modelling, by selecting an optimum number of elements for the model. Several preliminary simulations have been carried out to determine the optimum mesh size required for this study.
However, the effective use of such type of advanced numerical tools to analyse and obtain meaningful results demands both the proper physical understanding of the problem, appropriate definition of input parameters and the ability to judiciously interpret the results.
There are a number of major input parameters required for hygIRC simulation and they are:
1. Basic wall construction details, 2. Material properties,
3. Boundary conditions, 4. Exposure duration,
5. Initial moisture content and temperature, and 6. Accidental moisture entry - quantity and location
These major input parameters are described in the following paragraphs.
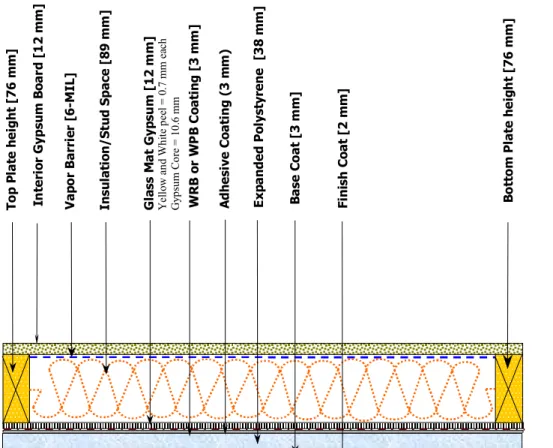
2.1 Basic Wall Construction Details
The basic stucco-wall construction details are shown in Figure A1. This wall did not have a drainage/ventilation cavity behind the exterior cladding. This wall was used for all the parametric studies, except where specific parametric analyses were conducted for the introduction of cavity behind the stucco cladding. The stucco-wall with a cavity behind the exterior cladding is shown in Figure A2.
M EWS T ask-7 Fi na l Rep ort Feb ru ary 2003 - -14 Fi gu re A 1 : S tu c c o -w a ll w ith ou t a c a vi ty Fi gu re A 2: S tu cco-wall wi th a cav ity beh in d th e cla ddin g G yp sum [ 1 2 mm] Va p o r B a rr ie r In su la ti o n /S tu d S p ac e [8 9 m m ] O S B S h ea th ing [ 1 1 mm] Sh ea th in g M em b ra n e S tuc co C la d d ing [ 1 9 m m ] B o tto m Pl a te h ei g h t [7 6 m m ] 2400 m m T o p P la te he ig ht [ 7 6 m m ] Gy ps u m [ 1 2 .5 mm] V apo r bar rier In su la ti o n /S tu d S p ac e [ 8 9 mm] OS B S h eath in g [ 1 1 mm] Sh e a th in g M e m b ra n e o n O S B A ir C a vi ty [19 m m ] Stu cc o C laddin g [1 9 mm] T o p P la te he ig ht [ 7 6 m m ] Bo tto m Plate h e igh t [ 7 6 mm] B o tto m V e n t Op en in g [ 1 9 m m] T o p v en t op en in g [ 3 mm] m 2400m Ai r Ga p i n OS B [ 3 m m ] Sh e a th in g M e m b ra n e o n St u cc o 12 m m
2.2 Material Properties
The basic materials used for the wall construction are: 1. Stucco
2. Sheathing membrane 3. Oriented strand board 4. Glass fibre
5. Spruce
6. Vapour barrier 7. Gypsum board
8. Natural fibre board (Uncoated) 9. Plywood
10. Coated gypsum board
In addition, another material, appropriately named as 'modified stucco', has also been used to demonstrate how modifying specific material properties can optimize the hygrothermal response of the wall. The changes that are to be made in the properties of 'Modified stucco' will be discussed in section 3.0.
The material properties used for simulations were taken from the MEWS material property database (Kumaran et al. 2002). These properties were carefully determined in the IRC's Thermal and Moisture Performance Laboratory following the standard test procedures (Kumaran et al. 2002). The materials considered are also representative of currently available building materials commonly used in North America.
The eight distinct sets of material properties required for hygIRC simulation are: (i) Air permeability (m2) in the X and Y-direction (kg water kg-1dry weight) (ii) Thermal conductivity (W m-1 K-1) in the X and Y-direction
(iii) Dry density (kg m-3) (iv) Heat capacity (J K-1 kg-1)
(v) Sorption characteristics (i.e. change of moisture content with relative humidity) (vi) Suction pressure (Pa)
(vii) Water vapour permeability (kg m-1 s-1 Pa-1) in the X and Y-direction (viii) Liquid diffusivity (m2 s-1) in the X and Y-direction
The aforementioned material properties are documented in the following sections.
2.2.1 Air permeability
The air permeability properties of the materials, as used for simulations, are shown in Table A1. The values shown in the Table A1 are the product of air permeability and dynamic viscosity of air.
Table A1: Air permeability of materials
Material Air permeability (m2)
Stucco I,II,III 6.87x10⁻¹⁷, 1.67x10⁻¹⁶, 4.19x10⁻¹⁶ Sheathing Membrane I,II,III 2.22x10⁻¹⁴, 1.18x10⁻¹⁴, 1.69x10⁻¹⁴
Vapour Barrier I, II, III 1.00x10⁻²⁰, 1.00x10⁻²⁰, 1.00x10⁻²⁰ OSB I,II,III 7.89x10⁻¹⁵, 1.65x10⁻¹⁵, 4.28x10⁻¹⁵
Gypsum Board 6.78x10⁻¹⁴
Spruce 1.00x10⁻¹³
Glass Fibre 1.10x10-09
Natural Fibre Board (Uncoated) 4.67x10⁻¹²
Plywood 8.50x10⁻¹⁵
Coated Gypsum Board 6.78x10⁻¹⁴
2.2.2 Thermal conductivity
Measurements were made on dry materials alone. The thermal conductivity of the material changes in relation to the moisture content of the material. Approximate combining rules are used to account for the effect of moisture on thermal conductivity. The thermal conductivity of the dry materials is shown in Table A2.
Table A2: Thermal conductivity of materials (dry)
Material Thermal Conductivity (W m-1K-1)
Stucco I,II,III 3.52x10-01, 4.07x10-01, 3.81x10-01 Sheathing Membrane I,II,III 1.09x10-01, 1.09x10-01, 2.00x10-01 Vapour Barrier I, II, III 1.59x10-01, 1.59x10-01, 1.59x10-01 OSB I,II,III 9.42x10-02, 9.34x10-02, 9.78x10-02
Gypsum Board 1.60x10-01
Spruce 9.01x10-02
Glass Fibre 4.33x10-02
Natural Fibre Board (Uncoated) 4.60x10-02
Plywood 9.05x10-02
Coated Gypsum Board 1.60x10-01
2.2.3 Dry density
The measured dry density of all the materials are provided in the Table A3.
Table A3: Dry density of materials
Material Dry density (kgm-3)
Stucco I,II,III 1.86x10³, 2.01x10³, 1.81x10³ Sheathing Membrane I,II,III 8.10x10² , 8.70x10², 8.40x10² Vapour Barrier I, II, III 8.40x10², 8.40x10² , 8.40x10² OSB I,II,III 5.94x10², 6.28x10², 6.71x10²
Gypsum Board 7.00x10²
Spruce 4.25x10²
Glass Fibre 1.10x10²
Natural Fibre Board (Uncoated) 2.42x10²
Plywood 5.00x10²
2.2.4 Heat capacity
The heat capacity of all the materials are given in the Table A4.
Table A4: Heat capacity of materials
Material Heat Capacity (J K-1 kg-1)
Stucco 1,2,3 8.40x10², 8.40x10², 8.40x10² Sheathing Membrane 4,5,6 1.88x10³, 1.88x10³, 1.47x10³ Vapour Barrier 7, 8, 9 1.26x10³, 1.26x10³, 1.26x10³ OSB 10,11,12 1.88x10³, 1.88x10³, 1.88x10³ Gypsum Board 8.70x10² Spruce 2.39x10³ Glass Fibre 1.26x10³
Natural Fibre Board (Uncoated) 2.10x10³
Plywood 1.88x10³
Coated Gypsum Board 8.70x10²
2.2.5 Sorption isotherm
The relation between relative humidity and moisture content of all the materials are shown in Figures A3a to A3j.
2.2.6 Suction curve
The plots of moisture content as a function of suction pressure are shown in Figures A4a to A4j.
2.2.7 Water vapour permeability
Water vapour permeability of the building material is one of the most critical properties influencing the overall drying characteristics of the wall. In fact, in this study, the selection of materials for the parametric study was done on the basis of its water vapour permeability characteristics. The variations of water vapour permeability in relation to relative humidity for all the materials are shown in Figures A5a to A5j. Three specimens of Stucco, Sheathing Membrane, Vapour Barrier and OSB have been chosen to represent the upper limit, average and lower limit of the water vapour permeability, as provided by the MEWS database (Kumaran et al. 2002). The influence of this selection criterion will be discussed in section 3.0.
2.2.8 Liquid diffusivity
The plots of liquid diffusivity vs. moisture content, for all materials used in this study, are shown in Figures A6a to A6j. The diffusion of liquid through the material takes place when moisture content of the material is close to the corresponding relative humidity of 100% (refer to the sorption isotherm plots).
(a) Stucco
(b) Sheathing membrane
Figure A3: Sorption Isotherm
Relative Humidity vs. Moisture Content
0.00 0.02 0.04 0.06 0.08 0.10 0.12 0.14 0.16 0.18 0% 20% 40% 60% 80% 100%
Relative Humidity
M
o
is
tu
re
C
ont
en
t
[k
g
(w
)/
k
g
(d
)]
Stucco 1 Stucco 2 Stucco 3 I II IIIRelative Humidity vs. Moisture Content
0.00 0.20 0.40 0.60 0.80 1.00 1.20 0 10 20 30 40 50 60 70 80 90 100
Relative Humidity (%)
M
o
is
tu
re
C
o
n
te
n
t
[k
g(
w
)/
k
g(
d)
]
Sheathing Membrane 4 Sheathing Membrane 5 Sheathing Membrane 6I
II
III
(c) OSB
(d) Vapour barrier
Figure A3: Sorption Isotherm
Relative Humidity vs. Moisture Content
0.00 0.20 0.40 0.60 0.80 1.00 1.20 1.40 1.60 0 10 20 30 40 50 60 70 80 90 100
Relative Humidity [% ]
Mo
is
tu
re
C
on
te
nt
[k
g(
w
)/k
g(
d)
]
OSB 10 OSB 11 OSB 12I
II
III
Relative Humidity vs. Moisture Content
0
0.2
0.4
0.6
0.8
1
1.2
0
20
40
60
80
100
Relative Humidity (% )
Mo
is
tu
re
C
o
n
te
n
t
[k
g(
w
)/k
g(
d)
]
Vapor Barrier 7 Vapor Barrier 8 Vapor Barrier 9I
II
III
(e) Gypsum board
(f) Spruce
Figure A3: Sorption Isotherm
Relative Humidity vs. Moisture Content
0.00 0.10 0.20 0.30 0.40 0.50 0.60 0% 20% 40% 60% 80% 100%
Relative Humidity
Mo
is
tu
re
C
o
n
te
n
t
[k
g
(w)/
k
g
(d
)]
Gypsum BoardMoisture Content vs. Relative Humidity
0.00 0.10 0.20 0.30 0.40 0.50 0.60 0.70 0.80 0% 20% 40% 60% 80% 100%
Relative Humidity
M
o
is
tu
re
C
o
n
te
n
t
[k
g
(w
)/
k
g
(d
)]
Spruce(g) Glass fibre
(h) Natural fibreboard (Uncoated)
Figure A3: Sorption Isotherm
Moisture Content vs. Relative Humidity
0.00 10.00 20.00 30.00 40.00 50.00 60.00 70.00 80.00 90.00 100.00 0% 20% 40% 60% 80% 100%
Relative Humidity
M
o
is
tu
re
C
o
n
te
n
t
[k
g
(w
)/
k
g
(d
)]
Glass FibreMoisture Content vs. Relative Humidity
0.00 0.20 0.40 0.60 0.80 1.00 1.20 1.40 1.60 0% 20% 40% 60% 80% 100% Relative Humidity M o is tu re C o n te n t [k g (w )/ k g (d )] Natural Fibreboard
(i) Plywood
(j) Coated gypsum board
Figure A3: Sorption Isotherm
Moisture Content vs. Relative Humidity
0.00 0.10 0.20 0.30 0.40 0.50 0.60 0.70 0.80 0.90 0% 20% 40% 60% 80% 100% Relative Humidity M o is tu re C o n te n t [ k g (w )/k g (d )] Plywood
Moisture Content vs. Relative Humidity
0.00 0.10 0.20 0.30 0.40 0.50 0.60 0.70 0% 20% 40% 60% 80% 100% Relative Humidity M o is tu re C o nt e n t [ k g( w )/ k g (d) ]
(a) Stucco
(b) Sheathing membrane
Figure A4: Suction Curve
Moisture Content vs. Suction Pressure
0.E+00 1.E+08 2.E+08 3.E+08 4.E+08 5.E+08 6.E+08 7.E+08 8.E+08 0 0.05 0.1 0.15 0.2 Moisture Content [kg(w)/kg(d)] S u cti o n P ressu re [ P a] Stucco 1Stucco 2 Stucco 3 I II III
Moisture Content vs. Suction Pressure
0.E+00 1.E+08 2.E+08 3.E+08 4.E+08 5.E+08 6.E+08 7.E+08 8.E+08 0.00 0.20 0.40 0.60 0.80 1.00 1.20 Moisture Cotent [kg(w)/kg(d)] S u ct io n P re ssu re ( P a) Sheathing Membrane 4 Sheathing Membrane 5 Sheathing Membrane 6
I
II
III
(c) Vapour barrier
(d) OSB
Figure A4: Suction Curve
Moisture Content vs. Suction Pressure
0.E+00 1.E+08 2.E+08 3.E+08 4.E+08 5.E+08 6.E+08 0 0.2 0.4 0.6 0.8 1 1.2
Moisture Content [kg(w)/kg(d)]
Suc
tion Pr
es
su
re
(P
a)
Vapor Barrier 7Vapor Barrier 8Vapor Barrier 9
I
II
III
Moisture Content vs. Suction Pressure
0.E+00 1.E+08 2.E+08 3.E+08 4.E+08 5.E+08 6.E+08 7.E+08 8.E+08 0.0 0.2 0.4 0.6 0.8 1.0 1.2 1.4 M oisture Content [kg(w)/kg(d)]
S
u
ct
io
n
P
res
su
re
[P
a]
OSB I OSB II OSB III(e) Gypsum board
(f) Spruce
Figure A4: Suction Curve
Moisture Content vs. Suction Pressure
0.0E+00 1.0E+08 2.0E+08 3.0E+08 4.0E+08 5.0E+08 6.0E+08 7.0E+08 8.0E+08 0 0.1 0.2 0.3 0.4 0.5 0.6
Moisture Content [kg(w)/ kg(d)]
S
u
ct
io
n
P
re
ssur
e
[P
a]
Gypsum BoardMoisture Content vs. Suction Pressure
0.0E+00 1.0E+08 2.0E+08 3.0E+08 4.0E+08 5.0E+08 6.0E+08 7.0E+08 8.0E+08 0 0.1 0.2 0.3 0.4 0.5 0.6 0.7 0.8
Moisture Content [kg(w)/kg(d)]
S
u
ct
io
n
P
ressur
e
[
P
a]
Spruce(g) Glass fibre
(h) Natural fibreboard (Uncoated)
Figure A4: Suction Curve
Moisture Content vs. Suction Pressure
0.0E+00 1.0E+08 2.0E+08 3.0E+08 4.0E+08 5.0E+08 6.0E+08 7.0E+08 8.0E+08 0 20 40 60 80 100
Moisture Content [kg(w)/kg(d)]
S
u
ct
io
n
P
re
ssu
re
[
P
a]
Glass FibreSuction Pressure vs. Moisture Content
0.0E+00
1.0E+08
2.0E+08
3.0E+08
4.0E+08
5.0E+08
6.0E+08
0
0.2
0.4
0.6
0.8
1
1.2
1.4
1.6
Moisture Content [kg(w)/kg(d)]
S
u
ct
io
n
P
res
su
re
[
P
a]
Natural Fibreboard(i) Plywood
(j) Coated gypsum board
Figure A4: Suction Curve
Suction Pressure vs. Moisture Content
0.E+00 1.E+08 2.E+08 3.E+08 4.E+08 5.E+08 6.E+08 7.E+08 8.E+08 0 0.2 0.4 0.6 0.8 1 Moisture Content [kg kg-1] Suc ti o n Pr es su re [ P a] Plywood
Suction Pressure vs. Moisture Content
0.0E+00 1.0E+08 2.0E+08 3.0E+08 4.0E+08 5.0E+08 6.0E+08 7.0E+08 8.0E+08 0 0.1 0.2 0.3 0.4 0.5 0.6 0.7
Moisture Content [kg(w)/kg(d)]
S u c ti o n P ressu re [ P(a) Stucco
(b) Sheathing membrane
Figure A5: Water Vapour Permeability
Relative Humidity vs. Water Vapour Permeability
0 1E-12 2E-12 3E-12 4E-12 5E-12 6E-12 7E-12 8E-12 0% 20% 40% 60% 80% 100%
Relative Humidity
W at er Va p o u r Pe rm ea b ilit y [kg m -1 s -1 Pa -1 ] Stucco 1 Stucco 2 Stucco 3I
II
III
Relative Humidity vs. Water Vapor Permeability
0.00E+00 2.00E-13 4.00E-13 6.00E-13 8.00E-13 1.00E-12 1.20E-12 1.40E-12 0 0.2 0.4 0.6 0.8 1 Relative Humidity (x100%) Wa te r V ap o r P er m ea b il it y (k g m -1 s -1 Pa -1 ) Sheathing Membrane 4 Sheathing Membrane 5 Sheathing Membrane 6
I
II
III
(c) OSB
(d) Vapour barrier
Figure A5: Water Vapour Permeability
Relative Humidity vs. Water Vapor Permeability
0.E+00 1.E-12 2.E-12 3.E-12 4.E-12 5.E-12 6.E-12 7.E-12 8.E-12 9.E-12 1.E-11 0.0 0.2 0.4 0.6 0.8 1.0 Relative Humidity [%] W at er V ap ou r P er m ea b ilit y (k g m -1 s -1 Pa -1 ) OSB 10 OSB 11 OSB 12 I II III
Relative Humidity vs. Water Vapor Permeability
0 1E-14 2E-14 3E-14 4E-14 5E-14 6E-14 7E-14 0 0.2 0.4 0.6 0.8 1 Relative Humidity [x100%] W at er V ap o r P erm ea b il it y [k g m -1 s -1 Pa -1 ] Vapor Barrier 7 Vapor Barrier 8 Vapor Barrier 9 I II III
(e) Gypsum board
(f) Spruce
Figure A5: Water Vapour Permeability
Relative Humidity vs. Water Vapor Permeability
0 1E-11 2E-11 3E-11 4E-11 5E-11 6E-11 7E-11 0% 20% 40% 60% 80% 100% Relative Humidity W a te r V a p u r P er m e ab ilit y [k g m -1 s -1 Pa -1 ] Gypsum Board
Water Vapour Permeability vs. Relative Humidity
0 2E-12 4E-12 6E-12 8E-12 1E-11 1.2E-11 0% 20% 40% 60% 80% 100% Relative Humidity W a te r Va pour Pe rm e a b ilit y [kg m -1 s -1 Pa -1 ] Spruce
(g) Glass fibre
(h) Natural fibreboard
Figure A5: Water Vapour Permeability
Relative Humidity vs. Water Vapour Permeability
0.0E+00 2.0E-11 4.0E-11 6.0E-11 8.0E-11 1.0E-10 1.2E-10 1.4E-10 1.6E-10 1.8E-10 2.0E-10 0% 20% 40% 60% 80% 100% Relative Humidity
W
at
er V
ap
o
r P
erm
ea
b
ili
ty
[k
g
m
-1s
-1Pa
-1]
Glass FibreWater Vapour Permeability vs. Relative Humidity
0.0E+00 5.0E-12 1.0E-11 1.5E-11 2.0E-11 2.5E-11 3.0E-11 3.5E-11 4.0E-11 4.5E-11 0% 20% 40% 60% 80% 100% Relative Humidity W at er V ap o u r P er m ea b ilit y [kg m -1 s -1 Pa -1 ] Natural Fibreboard
(i) Plywood
(j) Coated gypsum board
Figure A5: Water Vapour Permeability
Water Vapour Permeability vs. Relative Humidity
0.0E+00 5.0E-12 1.0E-11 1.5E-11 2.0E-11 2.5E-11 3.0E-11 0% 20% 40% 60% 80% 100% Relative Humidity Wa te r Va pou r Pe rm ea bilit y [k g m -1 s -1 Pa -1 ] Plywood
Water Vapour Permeability vs. Relative Humidity
0 1E-11 2E-11 3E-11 4E-11 5E-11 6E-11 7E-11 0% 20% 40% 60% 80% 100%
Relative Humidity
W a te r V a pour P e rm ea bi li ty [k g m -1 s -1 Pa -1 ]Coated Gypsum (X-dir) Coated Gypsum (Y-dir)
(a) Stucco
(b) Sheathing membrane
Figure A6: Liquid Diffusivity
Moisture Content vs. Liquid Diffusivity
0.0E+00 5.0E-09 1.0E-08 1.5E-08 2.0E-08 2.5E-08 3.0E-08 3.5E-08 4.0E-08 4.5E-08 0 0.05 0.1 0.15 0.2 Moisture Content [kg(w)/kg(d)] L iq u id D iff u siv iy [ m 2 s -1 ] Stucco 1 Stucco 2 Stucco 3 I II III
Moisture Content vs. Liquid Diffusivity
0.0E+00 1.0E-12 2.0E-12 3.0E-12 4.0E-12 5.0E-12 6.0E-12 0 0.2 0.4 0.6 0.8 1 1.2 Moisture content [kg(w)/kg(d)] L iq u id d iffu si vi ty [m 2 s -1 ] Sheathing Membrane 4 Sheathing Membrane 5 Sheathing Membrane 6 I II III
(c) OSB
(d) Vapour barrier
Figure A6: Liquid Diffusivity
Moisture Content vs. Liquid Diffusivity
0.0E+00 5.0E-12 1.0E-11 1.5E-11 2.0E-11 2.5E-11 3.0E-11 3.5E-11 0.0 0.2 0.4 0.6 0.8 1.0 1.2 1.4 Moisture Content [kg(w)/kg(d)] Li qu id D if fus iv it y i n X -di r [ m 2s -1] OSB 10 OSB 11 OSB 12 I II III
Moisture Content vs. Liquid Diffusivity
0.0E+00 2.0E-10 4.0E-10 6.0E-10 8.0E-10 1.0E-09 1.2E-09 1.4E-09 1.6E-09 1.8E-09 0.0 0.2 0.4 0.6 0.8 1.0 1.2 1.4 1.6 M oisture Content [kg(w)/kg(d)] Li qui d D if fu si vi ty i n Y -di r [ m 2s -1] OSB 10 OSB 11 OSB 12 I II III
Moisture Content vs. Liquid Diffusivity
0.0E+00 2.0E-17 4.0E-17 6.0E-17 8.0E-17 1.0E-16 1.2E-16 0.0 0.2 0.4 0.6 0.8 1.0 1.2 Moisture Content L iqui d D if fus iv it y (m 2 s -1 ) Vapor Barrier 7 Vapor Barrier 8 Vapor Barrier 9
I
II
III
(e) Gypsum board
(f) Spruce
Figure A6: Liquid Diffusivity
Moisture Content vs. Liquid Diffusivity
0.0E+00 1.0E-07 2.0E-07 3.0E-07 4.0E-07 5.0E-07 6.0E-07 0 0.1 0.2 0.3 0.4 0.5 0.6 Moisture Content [kg(w)/kg(d)] L iq u id D if fu si vi y [ m 2 s -1 ] Gypsum Board
Moisture Content vs. Liquid Diffusivity
0.0E+00 5.0E-11 1.0E-10 1.5E-10 2.0E-10 2.5E-10 3.0E-10 3.5E-10 0 0.1 0.2 0.3 0.4 0.5 0.6 0.7 0.8 Moisture Content [kg(w)/kg(d)] L iqui d D iff u si viy [m 2 s -1 ] Spruce
(g) Glass Fibre
(h) Natural fibre board (Uncoated)
Figure A6: Liquid Diffusivity
Liquid Diffusivity vs. Moisture Content
0.0E+00 2.0E-09 4.0E-09 6.0E-09 8.0E-09 1.0E-08 1.2E-08 0 20 40 60 80 100 Moisture Content [kg(w)/kg(d)] L iqu id D iffus iv iy [m 2 s -1 ] Glass Fibre
Liquid Diffusivity vs. Moisture Content
0.0E+00 2.0E-10 4.0E-10 6.0E-10 8.0E-10 1.0E-09 1.2E-09 0 0.1 0.2 0.3 0.4 0.5 0.6 0.7 0.8 0.9 1 1.1 1.2 1.3 1.4 1.5 1.6 Moisture Content [kg(w)/kg(d)] L iq u id D if fu s iv iy [ m 2 s -1 ] Natural Fibreboard
(i) Plywood
C
(j) Coated gypsum board
Figure A6: Liquid Diffusivity
Liquid Diffusivity vs. Moisture Content
0.0E+00 1.0E-07 2.0E-07 3.0E-07 4.0E-07 5.0E-07 6.0E-07 0 0.1 0.2 0.3 0.4 0.5 0.6 0.7
Moisture Content [kg(w)/kg(d)]
Li
qui
d D
iff
us
iv
iy
[
m
2s
-1]
♦ Coated GypsumLiquid Diffusivity vs. Moisture Content
0.0E+00 2.0E-11 4.0E-11 6.0E-11 8.0E-11 1.0E-10 1.2E-10 1.4E-10 1.6E-10 1.8E-10 0 0.2 0.4 0.6 0.8 Moisture Content [kg(w)/kg(d)] L iq u id D iffu s iv it y [m 2 s -1 ] Plywood (X-dir)
Liquid Diffusivity vs. Moisture Content
0.E+00 1.E-09 2.E-09 3.E-09 4.E-09 5.E-09 6.E-09 7.E-09 0 0.1 0.2 0.3 0.4 0.5 0.6 0.7 0.8 Moisture Content [kg(w)/kg(d)] L iq u id D iffu s iv ity [m 2 s -1 ] Plywood (Y-dir)
2.3 Boundary Conditions
The two main boundary conditions are the indoor/Interior condition, and the Outdoor/Exterior condition.
2.3.1 Indoor Environment
The interior boundary conditions considered are the indoor temperature (T) and the indoor relative humidity (RH). A summer and winter setting of RH and T are simulated in accordance with ASHRAE recommendations (ASHRAE Handbook of Fundamentals,
Chapter 3). The summer and winter seasons, identified according to the criteria specified
in the 'Specifications to National (Canada) Energy Code for Houses, (Swinton and
Sander, 1994)', as follows:
Winter: Mean monthly outdoor temperature < 11ºC Summer: Mean monthly outdoor temperature > 11ºC
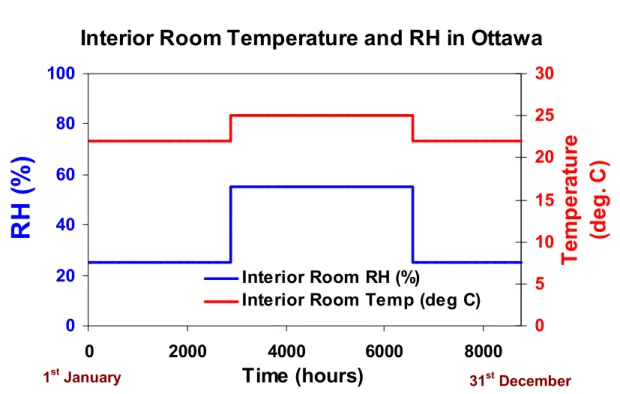
A typical variation of indoor RH and T at Ottawa in a calendar year is shown in Figure A7.
Figure A7: Typical Interior Room Temperature and Relative Humidity at Ottawa
2.3.2 Outdoor Environment
The external weather data as necessary for hygIRC modelling has seven components. They are:
(1) Temperature (2) Relative Humidity (3) Wind Velocity (4) Wind Direction
(5) Radiation (Direct, Diffused and Reflective components) (6) Horizontal rainfall
(7) Cloud index
Interior Room Temperature and RH in Ottawa
0 20 40 60 80 100 0 2000 4000 6000 8000
Time (hours)
RH
(
%
)
0 5 10 15 20 25 30T
em
p
er
at
ur
e
(d
e
g
. C
)
Interior Room RH (%)Interior Room Temp (deg C)
31st December
A typical format of exterior weather hourly-recorded data file is shown in the Table A5 below.
Table A5: Typical exterior weather data format Radiation (W/m2) Time (hr) Temp-erature (°C) Relative humidity (%) Wind velocity (km/hr) Wind direction (° ) Direct Diffu-sed Reflec -tive Rain (mm/hr) Cloud Index 1 -10.6 74.19 19.08 68 241.39 180.39 0 0 8 2 -5 86.45 8.90 126.39 126.39 125.45 0 5 6 ….. …….. ………. ……. ……..
Three typical years, representing the Wet, Average and Dry year respectively, have been selected for this study. The selection methodology for the Wet, Average and Dry years is described in the MEWS Task 4 report (Cornick et al. 2002).
2.4 Exposure Duration
A total of three years of exposure duration is considered in this study. In all cases, except one, the first two years are Wet years (same year repeated) and the third year is an
Average year. In one case for parametric study the third Average year is replaced by a Dry year.
2.5 Initial Moisture Content and Temperature
In any hygrothermal simulation, the user defines the initial moisture content of each wall component at the beginning of the first year. It is assumed in this study that the initial moisture content of each wall component is equivalent to the corresponding relative humidity of 50 percent, derived from the sorption isotherm of the respective materials. The first year of the simulation is considered to be an initial conditioning period, and all the observations are made on the basis of the hygrothermal response of the wall assembly during the second and third years. Similarly, the initial temperature across the entire wall cross section is assumed to be 20°C.
2.6 Accidental Moisture Entry - Quantity and Location
hygIRC has the capability to inject any quantity of accidentally entered moisture at any
location of the wall and at any time (hourly). The quantity of accidentally entered moisture inside the wall and its location were determined from the output of full-scale and small-scale laboratory tests done in MEWS Task 6 (Lacasse et al. 2002).
Quantity
An equation was derived from the full-scale lab results to estimate the moisture entry rate (Q). This equation depends on the pressure difference across the wall assembly (∆P) as well as the rate of water dRp striking the wall, as given below:
dQ/dRp= 0.0314 + 7.74 x 10⁻⁵ ∆P - 8.14 x 10⁻⁸ ∆P2 [Eqn. A1]
In real-life ∆P is a function of wind pressure and dRp is representative of wind driven
rain.
However, for the stucco-wall, initially, the aforementioned equation A1 was slightly modified to reduce the quantity of moisture entry inside the wall. It was felt at that time
that quantity of water derived from equation A1 might be too much for the parametric analysis. The modified equation is defined as:
dQ/dRp= 0.00314 + 7.74 x 10⁻⁵ ∆P - 8.14 x 10⁻⁸ ∆P2 [Eqn. A2]
All the parametric studies reported in this report are based on the quantity of moisture entry determined with the use of equation A2. However, similar studies for a selected number of parameters have also been done with the use of equation A1 and a different 'region of focus'. The results are shown in Appendix A2.
Location
As observed in the full and small-scale tests of MEWS Task 6, the worst-case scenario location of accidentally entered moisture is found to be at the bottom of the insulated stud cavity. Hence, the quantity of accidentally entered moisture determined from either equation A1 or A2 was injected at the bottom of the stud cavity, on the top of the bottom plate, at every hour.
3.0 Results from hygIRC Simulation
More than one hundred simulations were done for the parametric study on stucco-wall. An enormous amount of data was generated from hygIRC and subsequently post-processed for overall and critical evaluation of the simulated hygrothermal response of the wall. However, only selected amount of data are presented in this report that are pertinent to the discussion. If required and requested for a stated purpose then any particular aspect of the remaining data could be made available exclusively to the MEWS partners.
The following are the important points about the simulations that the authors feel should be clearly and unambiguously disclosed to the readers before presenting the results and the related discussions:
1. The main objective of this study is to determine the drying potential and characteristics of the wall assembly in the case of accidentally entered moisture inside the insulation cavity of the stucco-clad wood-frame wall assembly.
2. The materials used in the simulations are described in section 2.2.
3. Each simulation done in this study has a unique identification code and in order to make it clear to the readers the identification codes are explained at the end of Table A6, where hygIRC simulation results have been summarised.
4. A three-year simulation was done for each of the cases considered in this study. However, all the simulation results were analysed based on the results of second and third year. Hence, all the discussions presented in this chapter are based on the second and third year simulation results and all the graphs represent the data for that period only.
5. It is to be noted that all simulations done in this study have the first conditioning year (a wet year) without any accidental moisture entry. This was done to generate a realistic moisture distribution inside the wall at the end of first year and prior to accidental moisture entry in the subsequent two years.
6. All the simulations done in this study have accidental moisture entry inside the stud/insulation, except one simulation (with the letters BC at the end of the simulation ID) for each location which did not have any accidental moisture entry. The
accidental moisture enters inside the cavity from the beginning of second year till the end of 3rd year.
7. The wall with accidental moisture entry represents the real wall with deficiency. The wall without accidental moisture entry can be considered as an ideal wall.
8. Drying curves obtained from the simulations, after first year, are shown in Appendix A1. The moisture content in these graphs is expressed with the unit of mass of moisture per unit length (kg/m) of wall or its components entire cross section. These drying curves provide the overall drying characteristics of the whole wall and its major components.
9. More detailed study (microanalysis) of the hygrothermal response of the wall assembly was done by analysing the relative humidity(RH) and temperature (T) contour plots (Figure A8)
10. A novel concept called the RHT Index was introduced by the researchers at IRC/NRC that was used in the parametric study to quantify and compare the localized hygrothermal response of any part of the wall and its component. The RHT index is derived from the RH and T distribution pattern (Figure A8) over a period of time for any specific area of the wall cross-section. Hence, the RHT index as defined in this study:
Cumulative 2 year (2nd and 3rd year) RHT =∑ (RH-RHX) × (T-TX),
for RH>RHX% and T>TX°C at every 10 days interval [Eqn. A3]
(During any time step when either or both RH ≤ RHX% and T ≤ TX°C, the RHT
value for that time step is zero.)
Where user-defined threshold values for RHX = 95% and TX = 5°C have been
chosen for this parametric study. For general interest, RHT values for RHx=90% and 80% have also been derived and reported. The RHT values are referred to as RHT(95), RHT(90) or RHT(80) index according to the threshold RH (i.e. RHx) level.
11. 'Region of focus' is the area for which the RHT index is calculated and this area should be the wettest portion of the wall assembly most of the time (see Figure A8a). For all stucco-wall simulations, where quantity of moisture entry inside the wall was calculated from equation A2, the 'region of focus' is a thin slice (1.4 mm) of the OSB sheathing board, 600mm height from the bottom of the stud cavity, facing the insulation layer. However, when equation A1 was used the 'region of focus' was shifted to a thin slice (5 mm) of the top surface of the bottom plate, extending 53 mm from the sheathing board (see Figure A8a).
12. As can be seen from the description of RHT index, it brings out the overall localized combined moisture and temperature response of the selected area of the material or wall assembly. For overall drying and wetting pattern of the stucco-wall assembly, at any point of time, the readers should look at the drying curves shown in Appendix A1.
(a) Typical relative humidity contour plot (width of the wall expanded)
(b) Typical temperature contour plot (width of the wall expanded)
Figure A8: RH and T Contour X Y 0.05 0.1 0.5 1 1.5 2 T 23.1374 19.9231 16.7087 13.4944 10.2801 7.0657 3.8514 0.6371 -2.5772 -5.7916 -9.0059 -12.2202 -15.4346 -18.6489 -21.8632 X Y 0.05 0.1 0.5 1 1.5 2 RH 0.9230 0.8615 0.8000 0.7384 0.6769 0.6154 0.5538 0.4923 0.4307 0.3692 0.3077 0.2461 0.1846 0.1231 0.0615
OTOS10
0.0445 m 0. 6 m Exterior faceOSB layer facing stud cavity
Bottom Plate; Top layer ; Half-width
0.00494 m 0.053 m
3.1 Results from Parametric Studies
Results from the parametric studies are to be discussed here primarily with the RHT(95) values shown in Table A6 calculated for a thin layer of OSB using equation A2. However, in qualitative sense, the observations would be same if RHT(80) or RHT(90) is to be used instead of RHT(95).
It is to be mentioned here that the 'region of focus' for the stucco-wall results discussed here is the thin OSB layer (Figure A8a). Changing the 'region of focus' from the OSB to the bottom plate can and will change the results. The conclusions regarding the effects of specific parameters may also vary. Readers interested in the results for the bottom-plate as the 'region of focus' should refer Task group 8 report (Beaulieu et al. 2002).
3.1.1 Exterior cladding (3 types of stucco)
Stucco cladding is the first component of the wall assembly, in the line of defence, to protect the living indoor climate from the outdoor or external climate. Three stucco materials (Stucco I, II and III) were chosen for this parametric study. All the material properties of these three stucco materials, determined in the laboratory, are shown in section 2.2. The simulation identification code for these three types of stucco (I, II and III) are **S1M2O1V1, **S2M2O1V1 and **S3M2O1V1 (Table A6).
It can be seen from Table A6 that variation of stucco properties can have significant influence on RHT(95) values at every location, except in very dry location (e.g. Phoenix) where it becomes insignificant. Stucco III with the lowest liquid diffusivity has caused the lowest RHT(95) values (i.e. the least severe hygrothermal response) in all locations.

![Table A9 lists the MI for 41 North American locations, calculated with hourly historical weather records, using equation [A3]](https://thumb-eu.123doks.com/thumbv2/123doknet/14195128.478916/50.918.140.774.570.966/table-american-locations-calculated-historical-weather-records-equation.webp)