Changing available energy for extratropical cyclones and
associated convection in Northern Hemisphere summer
The MIT Faculty has made this article openly available.
Please share
how this access benefits you. Your story matters.
Citation
Gertler, Charles G. and Paul A. O’Gorman. "Changing available
energy for extratropical cyclones and associated convection in
Northern Hemisphere summer." Proceedings of the National
Academy of Sciences of the United States of America 116 (2019):
4105-4110 © 2019 The Author(s)
As Published
10.1073/pnas.1812312116
Publisher
Proceedings of the National Academy of Sciences
Version
Final published version
Citable link
https://hdl.handle.net/1721.1/124441
Terms of Use
Article is made available in accordance with the publisher's
policy and may be subject to US copyright law. Please refer to the
publisher's site for terms of use.
Changing available energy for extratropical cyclones
and associated convection in Northern
Hemisphere summer
Charles G. Gertlera,1and Paul A. O’Gormana
aDepartment of Earth, Atmospheric and Planetary Sciences, Massachusetts Institute of Technology, Cambridge, MA 02139
Edited by Dennis L. Hartmann, University of Washington, Seattle, WA, and approved January 18, 2019 (received for review July 17, 2018)
The circulation of the Northern Hemisphere extratropical tropo-sphere has changed over recent decades, with marked decreases in extratropical cyclone activity and eddy kinetic energy (EKE) in summer and increases in the fraction of precipitation that is con-vective in all seasons. Decreasing EKE in summer is partly explained by a weakening meridional temperature gradient, but changes in vertical temperature gradients and increasing moisture also affect the mean available potential energy (MAPE), which is the energetic reservoir from which extratropical cyclones draw. Furthermore, the relation of changes in mean thermal structure and moisture to changes in convection associated with extratropical cyclones is poorly understood. Here we calculate trends in MAPE for the Northern extratropics in summer over the years 1979–2017, and we decompose MAPE into both convective and nonconvective components. Nonconvective MAPE decreased over this period, consistent with decreases in EKE and extratropical cyclone activity, but convective MAPE increased, implying an increase in the energy available to convection. Calculations with idealized atmospheres indicate that nonconvective and convective MAPE both increase with increasing mean surface temperature and decrease with de-creasing meridional surface temperature gradient, but convec-tive MAPE is relaconvec-tively more sensiconvec-tive to the increase in mean surface temperature. These results connect changes in the atmo-spheric mean state with changes in both large-scale and convec-tive circulations, and they suggest that extratropical cyclones can weaken even as their associated convection becomes more energetic.
climate change
|
available energy|
extratropical cyclones|
convectionD
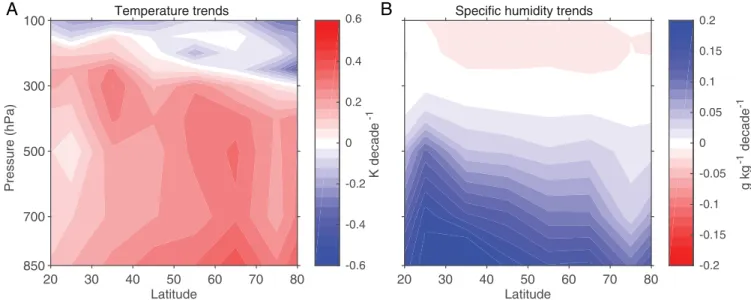
istinct patterns of change have emerged in the thermal structure and moisture content of the Northern Hemisphere extratropical troposphere (1–4), as seen from homogenized radio-sonde data (seeMethods) for the summer season in Fig. 1. Notably, the meridional temperature gradient has weakened in the lower-and middle troposphere (Fig. 1A), lower-and the troposphere has expe-rienced a general moistening (Fig. 1B). The weakening of the meridional temperature gradient is thought to contribute to the observed weakening of eddy kinetic energy (EKE) and cyclone activity levels (5, 6), with implications for regional climate and air quality (7). However, eddy behavior is also affected by changes in moisture content and static stability. For example, amplified low-level warming (Fig. 1A), which is more clearly evident in reanalysis trends that extend to the surface (SI Appendix, Fig. S1A), implies decreased static stability in the lower troposphere, which together with increasing specific humidity (Fig. 1B) would tend to increase the growth rates of eddies, opposing the weakening effect from the meridional temperature gradients. Projections of 21st century cli-mate change with coupled clicli-mate models also show a decrease in EKE in the Northern Hemisphere in summer that has been linked to weakening lower-tropospheric meridional temperature gradients (8) and increases in extratropical static stability that occurs in the projections in this season (9). The changes in mean thermal struc-ture and moisstruc-ture could also cause changes in the energy availableto convection; large increases in the convective fraction of precipi-tation have been observed for all seasons over Eurasia (10), and there is some evidence for increases in convective available potential energy (CAPE) as the climate has warmed (11). However, CAPE is calculated from instantaneous vertical profiles of temperature and humidity and cannot be directly related to changes in mean temperature and moisture in the extratropics.
Mean available potential energy (MAPE) provides a useful framework with which to connect the mean thermal structure (in-cluding both meridional temperature gradients and static stability) and moisture content of the extratropical atmosphere to EKE and, as discussed below, to available energy for convection. MAPE is defined as the difference in enthalpy between an atmosphere’s mean state and the minimum-enthalpy state possible from re-versible, adiabatic parcel rearrangements (12). MAPE may be calculated neglecting latent heating (dry MAPE) (12) or taking it into account (moist MAPE) (13, 14). EKE scales linearly with dry and moist MAPE in extratropical, baroclinic environments in a wide range of idealized climate model experiments (15–17). A re-cent study (18) that imposed isolated thermal forcings at different latitudes and levels found that the scaling of EKE with MAPE can break down in some cases, but that it generally performs better than considering the change in meridional temperature gradient or static stability alone. Importantly, EKE also scales linearly with MAPE over the seasonal cycle in the extratropics in both hemispheres based on reanalysis data, and under climate change in coupled model projections, including for intermodel differences (9).
Here, we calculate changes in moist MAPE over recent decades and use the results to better understand observed changes in the circulation. Some recent studies suggest an increasing trend in
Significance
Extratropical cyclones and their associated convection play a cen-tral role in the weather of the midlatitudes and are changing with global warming. By analyzing trends in the energy of the mean state of the atmosphere that is available to be converted to kinetic energy, we show how the warming and moistening of the Northern Hemisphere extratropics relates to the observed weak-ening of extratropical summer cyclones. We also show that the component of this energy that can be released through convection has increased, despite the weakening of extratropical cyclones. Our results provide a unified framework that illustrates how the observed weakening of the extratropical cyclones in summer can occur while at the same time convection becomes more energetic.
Author contributions: C.G.G. and P.A.O. designed research; C.G.G. performed research; C.G.G. analyzed data; and C.G.G. and P.A.O. wrote the paper.
The authors declare no conflict of interest. This article is a PNAS Direct Submission. Published under thePNAS license.
1To whom correspondence should be addressed. Email: cgertler@mit.edu.
This article contains supporting information online atwww.pnas.org/lookup/suppl/doi:10. 1073/pnas.1812312116/-/DCSupplemental.
Published online February 19, 2019.
EARTH, ATMOSPHERIC, AND PLANETARY SCIENC ES
global eddy kinetic energy, but these changes are dominated by the Southern Hemisphere and their magnitude is dataset dependent (19, 20). We focus on the Northern Hemisphere extratropics in June– July–August (JJA), given the clear reported trends in cyclonic activity (5, 6) and convective precipitation fraction (10) in that season and hemisphere. Using moist rather than dry MAPE allows us to consider the role of latent heating and the implications for moist convection.
MAPE
We use zonal- and seasonal-mean temperatures and humidities from the ERA-Interim Reanalysis (21) to calculate MAPE for JJA and the latitude band 20–80N over the years 1979–2017. ERA-In-terim provides complete spatial and temporal coverage, and trends in mean temperature from ERA-Interim are similar to those from homogenized radiosonde data when subsampled to those data (compare Fig. 1A andSI Appendix, Fig. S2A). However, the sub-sampled humidity trends do not agree well with a homogenized radiosonde humidity dataset (compare Fig. 1B andSI Appendix, Fig. S3B), and this issue with ERA-Interim relative humidity trends could partly relate to the use of unhomogenized radiosonde hu-midities as input to the reanalysis (4). To avoid this bias in humidity trends, we hold relative humidity constant in time using its clima-tological values from ERA-Interim. This gives mean specific hu-midity trends that are more consistent with the radiosonde data (SI Appendix, Fig. S2B; seeMethods for details).
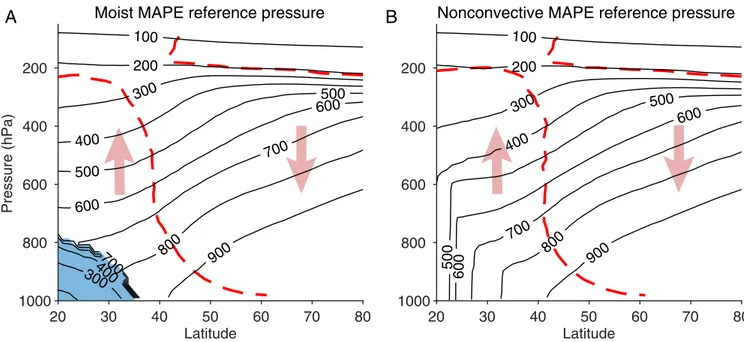
The air-parcel rearrangement in the calculation of moist MAPE for JJA is illustrated in Fig. 2A based on climatological temperatures and humidities. The general pattern is of rising air originating at lower latitudes and sinking air originating at higher latitudes, cor-responding to large-scale slantwise motion in baroclinic eddies in the atmosphere. In addition, there is a substantial air mass (highlighted in blue in Fig. 2A) that moves from the boundary layer to the upper troposphere and which is bounded by a discontinuity in the mapping of the parcel rearrangement. The ascent of this air mass to the upper troposphere results in a vertical reordering of air parcels originating at low latitudes which we interpret as corresponding to deep con-vection in the atmosphere. While the air mass originates at low latitudes, its ascent can occur in the midlatitudes, since extratropical cyclones advect air poleward before deep ascent occurs (22, 23). The parcel rearrangement for winter (SI Appendix, Fig. S4A) also shows deep ascent but with a weaker signature of convection and no dis-continuity, consistent with deep ascent in winter predominantly oc-curring as slow ascent in warm conveyor belts rather than rapid deep convection, as seen in recent high-resolution simulations (23).
Following previous work (9), we also calculate nonconvective MAPE which allows for latent heating but does not allow for release of convective instability as represented by vertical reor-dering of air originating at a given latitude (seeMethods and Fig. 2B). We expect EKE to scale with nonconvective MAPE rather than the full moist MAPE because release of convective instability involves local dissipation of kinetic energy without necessarily contributing to large-scale EKE, and because convection is as-sociated with mixing and diffusion of water vapor which acts as a sink of moist MAPE (24).
Nonconvective MAPE is always less than or equal to moist MAPE (9), and here we introduce the concept of convective MAPE, defined as the moist MAPE minus nonconvective MAPE. Convective MAPE provides a link between convection and the mean state of the atmosphere, in contrast to CAPE which must be calculated from instantaneous soundings. Conditional instability of the mean state of the atmosphere is limited to low latitudes and does not contribute strongly to convective MAPE (Methods), and thus convective MAPE must be primarily generated by the large-scale circulation driven by the meridional temperature gradient. The weak conditional instability of the mean state of the atmo-sphere also implies that the alternative approach of calculating moist MAPE at each latitude in isolation (without allowing me-ridional movement) and then averaging in latitude would give a much smaller value than the convective MAPE.
Convective MAPE is calculated using adiabatic rearrangements, and therefore it does not account for convective instability driven by surface fluxes or radiative cooling. We interpret convective MAPE as the energy available for moist convection driven by large-scale ascent in extratropical cyclones, and our study of changes in convective MAPE is complementary to previous studies that have investigated the physical basis of changes in tropical CAPE (25–27) and changes in midlatitude extreme CAPE driven by surface fluxes over land (28).
Changing Energetic Reservoirs
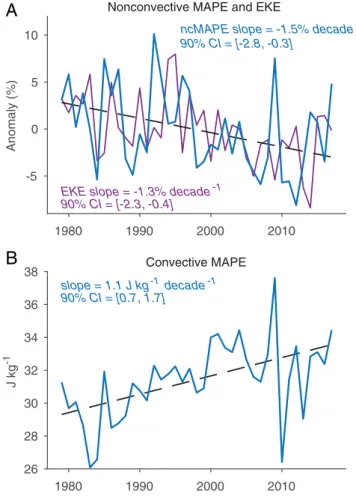
Time series and trends in MAPE for JJA over 20–80N and 1979– 2017 are shown in Fig. 3. Nonconvective MAPE demonstrates a downward trend of−1.5% per decade, with a 90% confidence in-terval of [−2.8, −0.3] % per decade, consistent in terms of percentage change with the downward trend in EKE (also calculated from ERA-Interim data) of−1.3% per decade, as seen in Fig. 3A. Therefore, changes in mean temperature and humidity, combined into non-convective MAPE, are sufficient to explain the sign and magnitude
Temperature trends 20 30 40 50 60 70 80 Latitude 100 300 500 700 850 -0.6 -0.4 -0.2 0 0.2 0.4 K decade -1
0.6 Specific humidity trends
20 30 40 50 60 70 80 Latitude -0.2 -0.15 -0.1 -0.05 0 0.05 0.1 0.15 0.2 g k g -1 decade -1 Pressure (hPa)
A
B
Fig. 1. Observed changes in summer (JJA) temperature and moisture of the Northern extratropics. (A) Median JJA temperature trend in 10° latitude bands from the IUKv2 radiosonde dataset (3) (1979–2015), and (B) median JJA specific humidity trend in 10° latitude bands from the homoRS92 radiosonde dataset (4) (1979–2010). See Methods for datasets and calculation details.
of the change in EKE. The trends in dry and moist MAPE are also downward and the trend of dry MAPE is similar in magnitude to that of nonconvective MAPE (SI Appendix, Fig. S5 B and E).
Interestingly, EKE and nonconvective MAPE are not posi-tively correlated for year-to-year variability when the time series in Fig. 3A are detrended. This different behavior for year-to-year variability compared with longer-term trends is likely because EKE and MAPE have a different relationship for unforced variability compared with forced variability. For forced variabil-ity, such as the seasonal cycle of the storm tracks or the response of the storm tracks to climate change, an increase in EKE is associated with an increase in MAPE (9). For unforced vari-ability of the storm tracks, an increase in EKE is associated with amplified heat fluxes which lead to a subsequent decrease in baroclinicity and MAPE (29–31).
In contrast to the decreasing trend in nonconvective MAPE, convective MAPE demonstrates an upward trend of 1.1 J kg−1 per decade, with a 90% confidence interval of [0.7, 1.7] J kg−1 per decade (Fig. 3B). This increase in the energy available to moist convection associated with extratropical cyclones implies a tendency toward more convective precipitation in summer in midlatitudes. Observations show a robust increase in the con-vective fraction of precipitation over Northern Eurasia (10), and it would be interesting to study changes in the convective fraction of precipitation in other midlatitude regions.
The signs and magnitudes of the trends in nonconvective and convective MAPE and in EKE are similar for narrower (30–70N) and wider (10–90N) latitude bands (SI Appendix, Fig. S5). We report the absolute rather than percentage changes in convective MAPE because the absolute changes are less sensitive to the latitude band chosen. Absolute values for all types of MAPE are shown inSI Appendix, Fig. S6.
Relation to Surface Temperatures in Idealized Atmospheres To better understand how climate change can cause changes of opposite sign in nonconvective MAPE and convective MAPE, we next consider how changes in mean surface temperature and me-ridional surface temperature gradient affect these energetic reser-voirs in idealized atmospheres that are representative of Northern Hemisphere summer. We prescribe simple meridional profiles of
surface temperature and vary the mean surface temperature and meridional surface temperature gradient independently. Given that the middle- and lower troposphere are frequently close to neutral to moist convection in summer in the Northern extratropics (32), we construct vertical temperature profiles in idealized atmospheres with prescribed relative humidity such that the virtual temperatures in the troposphere match the virtual temperatures in a reversible moist adiabat of a parcel lifted from the surface (seeMethods for details). By this construction each individual column in isolation is not con-ditionally unstable and has no available potential energy, and thus nonzero convective MAPE must arise because of the meridional temperature gradient and the resulting lateral and vertical motion.
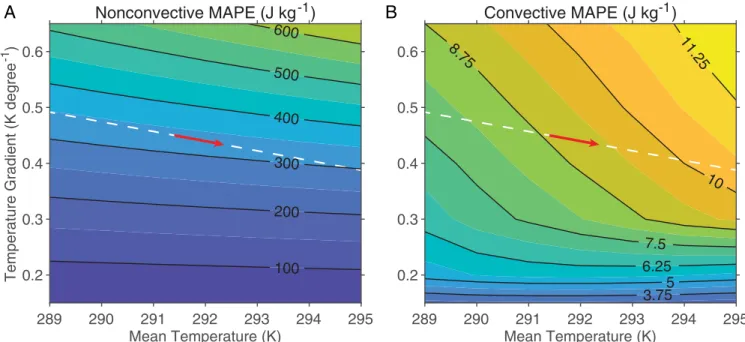
Fig. 4 shows the variations in MAPE as a function of mean sur-face temperature and the mean meridional sursur-face temperature gradient over 20–80N in the idealized atmospheres. The ranges shown are roughly centered on the ERA-Interim mean tempera-tures and temperature gradients for Northern Hemisphere JJA of 292 K and 0.44 K degree−1. Based on the ERA-Interim trends for JJA, we find that surface temperature increased by roughly 1 K and the surface meridional temperature gradient decreased by roughly 0.02 K degree−1over the whole period (SI Appendix, Fig. S7), and the observed changes in this time period are indicated by the red arrows in Fig. 4. Nonconvective MAPE increases with the meridi-onal temperature gradient as would be expected given that it be-haves similarly to dry MAPE, which increases as the meridional temperature gradient squared with some compensation from in-creases in static stability (33). Nonconvective MAPE also inin-creases with mean surface temperature which likely reflects both increases in latent heating and induced changes in meridional temperature gradients aloft. On the other hand, convective MAPE has two dif-ferent behavior regimes. For very weak meridional temperature gradients and thus weak large-scale overturning circulation, con-vective MAPE primarily increases with the meridional temperature gradient because the amount of air that reaches saturation increases with the strength of ascent at lower latitudes. For stronger meridi-onal temperature gradients and thus stronger large-scale over-turning, convective MAPE is more strongly a function of mean temperature, and this is the regime in which the observed JJA parameters fall. To understand why convective MAPE is sensitive to mean temperature, we first note that the vertical gradient in
20 30 40 50 60 70 80 Latitude 200 400 600 800 1000 Pressure (hPa)
Moist MAPE reference pressure
100 200 300 300 400 400 500 500 600 600 700 700 800 900 20 30 40 50 60 70 80 Latitude 200 400 600 800Nonconvective MAPE reference pressure
100 200 300 400 0 0 5 500 0 0 6 600 700 800 900 1000B
A
Fig. 2. Visualization of MAPE calculations. Parcel rearrangements in the calculation of (A) moist MAPE and (B) nonconvective MAPE based on climatological JJA zonal-mean temperatures and relative humidities from the ERA-Interim reanalysis (1979–2017). Black contours (contour interval 100 hPa) show the pressure of a given air parcel in the minimum-enthalpy state, referred to as the reference pressure. Arrows schematically indicate vertical motion of parcels. The red dashed lines show where the reference pressure is equal to the pressure. Blue shading in A indicates a region of lower-tropospheric air bounded by a discontinuity in the reference pressure distribution, whose ascent to the upper troposphere corresponds to the release of convective instability.
EARTH, ATMOSPHERIC, AND PLANETARY SCIENC ES
potential temperature along a moist adiabat increases with surface temperature (34), which implies that the ability of a given amount of large-scale ascent to cool the free troposphere and destabilize the column will also increase with temperature. The additional depen-dence on meridional temperature gradient reflects the ability of stronger temperature gradients to drive more ascent. The idealized atmosphere results show that convective MAPE is relatively more sensitive to mean surface temperature compared with noncon-vective MAPE, and this helps explain why connoncon-vective MAPE can increase in response to mean warming and a weakening meridional temperature gradient even though nonconvective MAPE decreases.
Discussion
Our results show that there have been opposite-signed changes in the energy available to large-scale circulations and associated moist convection in recent decades in Northern extratropical summer, and that these changes are consistent with decreases in EKE and also consistent in sign with observed increases in the convective precipitation fraction. The changes in MAPE thus serve as a bridge between changes in the mean temperature and moisture of the atmosphere and changes in extratropical circulations. The MAPE framework may also be useful for considering past climate states based on surface temperature proxies to the extent that we can assume a vertical stratification in Northern midlatitude summer that is close to moist adiabatic.
While the link between changes in MAPE and EKE has been extensively studied in previous studies (15–18), our results suggest a need for more investigation into connections between the mean state of the extratropical atmosphere (including both mean tem-perature and temtem-perature gradients) and its convective behavior. For example, future work could compare convective MAPE with other measures of convection, such as instantaneous CAPE and the convective fraction of precipitation, across the seasonal cycle, in idealized simulations, and in warming scenarios. It is also important to investigate the contribution of zonal asymmetries to trends in nonconvective and convective MAPE since these asymmetries are not included in the zonal-mean MAPE considered here.
Decreasing nonconvective MAPE and increasing convective MAPE are consistent with model projections for Northern mid-latitude summer over the 21st century (9). However, the large de-crease of roughly 6% in nonconvective MAPE found here over recent decades is of similar magnitude to the multimodel-mean projected decrease in nonconvective MAPE over the whole 21st century––a finding consistent with the observed decrease in cyclone activity being near the extreme end of what different climate models simulate for recent decades (6). Substantial components of regional Arctic amplification may result from unforced variability, for example as a result of the Atlantic Multidecadal Oscillation (35) or via teleconnection to tropical Pacific variability (36), and future work could also investigate the contributions of anthropogenic forcing versus unforced variability to trends in MAPE.
Methods
Trends. All trends of time series are calculated using the Theil–Sen estimator, and 90% confidence intervals are calculated using the bootstrapping per-centile method. Zonal average trends in temperature and humidity from radiosonde datasets, and reanalysis products subsampled to radiosonde lo-cations, are calculated as follows: stations are binned in 10° latitude bands, and the trend for each pressure level and latitude band is determined as the median trend of the seasonal average at that pressure level among the stations in that latitude band. The use of the median trend in latitude bands limits the influence of outlier trends in the radiosonde data (3).
Temperature and Humidity Data. For the calculation of MAPE, monthly mean temperature and humidity data from 1979 to 2017 with a grid resolution of 2.5° by 2.5° are taken from the ERA-Interim dataset, a global atmospheric reanalysis produced by the European Centre for Medium-Range Weather Forecasts (21). Seasonal-mean temperature and humidity are first calculated at each gridpoint. The zonal mean is then taken for a given year excluding any gridpoints at which the monthly pressure is greater than the monthly surface pressure at that point by more than 25 hPa (the pressure spacing near the surface) for any of the months in the season. The mean surface temperatures and surface meridional temperature gradients shown inSI Appendix, Fig. S7are calculated from the zonal and seasonal mean of the 1,000-hPa temperatures at each latitude as calculated above, and then meridionally averaged with area weighting.
Observational temperature data are taken from IUKv2 (3), a radiosonde dataset homogenized by Iterative Universal Kriging to correct for time-varying instrument biases. For direct comparison with IUKv2, ERA-Interim data are subsampled in space and time to the coordinates closest to the station data in the IUKv2 dataset and trends are calculated as described above. We chose ERA-Interim for use in this paper because of its relatively good agreement with the radiosonde data in terms of temperature trends when subsampled to the station locations (compare Fig. 1A withSI Appen-dix, Fig. S2A), whereas other reanalysis products that we analyzed were found to have less good agreement, resulting in MAPE trends different from those presented here, including differences of sign in some cases.
Observational specific humidity data are taken from the homoRS92 dataset, a homogenized global, twice-daily humidity dataset that consists of the dataset described in Dai et al. (4), supplemented with dry-bias corrected data from Vaisala RS92 soundings (37). In reporting relative humidity and specific humidity, this dataset employs a separate homogenized air temperature radiosonde product (38) combined with the homogenized dewpoint depression. Due to missing data in this dataset (which unlike IUKv2 is not iteratively filled), the following processing procedure is applied when determining trends: (i) at indi-vidual stations and pressure levels, only days with two measurements are con-sidered, (ii) only months with at least 70% of days are concon-sidered, (iii) only JJA averages with all three months present are considered, and (iv) only trends based on at least 70% of years are considered. The zonal-median trend following this
1980 1990 2000 2010 -5 0 5 10 Anomaly (%)
Nonconvective MAPE and EKE
ncMAPE slope = -1.5% decade-1 90% CI = [-2.8, -0.3]
EKE slope = -1.3% decade-1
90% CI = [-2.3, -0.4] 1980 1990 2000 2010 26 28 30 32 34 36 38 J kg -1 Convective MAPE slope = 1.1 J kg-1 decade-1 90% CI = [0.7, 1.7]
B
A
Fig. 3. Time series and trends of energetic reservoirs for summer in the Northern extratropics. (A) Percent anomaly from climatological (1979–2017) mean for nonconvective MAPE (blue line) and EKE (purple line). (B) Con-vective MAPE, which is defined as the difference between moist MAPE and nonconvective MAPE. All results shown are for JJA over 20–80N based on ERA-Interim reanalysis. Trends and associated 90% confidence intervals are given in each panel. The dashed black lines show the linear best-fit trends for (A) nonconvective MAPE and (B) convective MAPE.
procedure is shown in Fig. 1B. Trends in ERA-Interim specific humidity data are compared with the observations by subsampling to the homoRS92 dataset station locations. Comparing the radiosonde humidity trends (Fig. 1B) to the subsampled ERA-Interim humidity trends (SI Appendix, Fig. S3B) reveals a large discrepancy with much too weak moistening in ERA-Interim. To avoid this bias, we instead use the climatological JJA-mean relative humidity from ERA-Interim (averaged over 1979–2017) as the humidity input to the JJA MAPE calculation for a given year. This approach is consistent with expectations of small trends in relative humidity in the troposphere (39), and it implies trends in specific hu-midity that are more consistent with the homogenized radiosonde trends in specific humidity (compare Fig. 1B andSI Appendix, Fig. S2B). In calculating the JJA specific humidities forSI Appendix, Fig. S2Band in our calculations of MAPE, we use the saturation vapor pressure formulae over ice and liquid de-scribed in Simmons et al. (40) but with the ice and liquid phases merged using the method described in Wang and Randall (41). The same saturation vapor pressure formulation is also used in calculating the moist adiabats in the ide-alized atmospheres (see below).
MAPE Calculations. The moist MAPE and its components are calculated for each year using the zonal- and JJA-mean temperatures and relative hu-midities from ERA-Interim. The temperature for a given year is the JJA-mean temperature for that year. As discussed above, the relative humidity is the climatological (1979–2017) JJA-mean relative humidity. Performing MAPE calculations using time-varying relative humidity (instead of climatological values) from ERA-Interim results in qualitatively similar results (SI Appendix, Fig. S8), but the increase in convective MAPE is 0.6 J kg−1per decade (SI Appendix, Fig. S8B), which is roughly half the rate of increase that constant relative humidity implies. The zonal-mean temperatures and relative hu-midities for each JJA are first interpolated to a 40× 40 equal-area staggered grid (13) to convert a 2D problem in pressure and latitude coordinates into a 1D problem in pressure coordinates only, although the original latitude for each parcel is stored for use in the calculation of nonconvective MAPE.
To calculate moist MAPE, we use the divide-and-conquer algorithm (14), which is a recursive algorithm that builds a low-enthalpy reference state by dividing the atmospheric domain into smaller subdomains. At each division, the pressure de-rivative of enthalpy is evaluated at the midpressure of the subdomain and used to order the parcels from top to bottom of the subdomain; the top and bottom halves are then assigned to new subdomains. The divide-and-conquer algorithm has been found to work well in practice (14, 42), and in particular it gives a moist MAPE that is almost identical to that calculated using the exact Munkres algo-rithm for a similar case to the one considered here (14). We use divide and
conquer rather than Munkres because divide and conquer is faster and more straightforward to adapt to calculate convective and nonconvective MAPE.
To calculate nonconvective MAPE (9), the divide-and-conquer algorithm is modified such that when sorting parcels from top to bottom in a subdomain, parcels from a given initial latitude may not change their vertical ordering (i.e., whether one parcel is above the other). This condition that parcels cannot“leapfrog” in pressure over other parcels from the same initial lati-tude leads to the continuous remapping of parcel pressure shown in Fig. 2B, in which the reference pressure (the pressure in the minimum-enthalpy state) is a monotonic function of pressure at a given latitude.
To calculate convective MAPE, we simply subtract the nonconvective MAPE from the moist MAPE. The magnitude of convective MAPE is reported per unit mass of the entire atmosphere in the specified latitude band (rather than the mass of a lifted parcel as is the case for CAPE), and as a result the reported values are much smaller than typical CAPE values in convective conditions. For JJA and 20– 80N, the mass of the lifted air in the moist MAPE calculation (the blue-shaded region in Fig. 2A) is roughly 6% of the mass of the atmosphere over 20–80N, and the value of convective MAPE of roughly 32 J kg−1becomes 530 J kg−1when normalized by the mass of lifted air, which is comparable to typical CAPE values. Convective MAPE should not be confused with generalized CAPE (GCAPE) which is the moist available potential energy of a column of air in isolation (41, 43). The moist available potential energy of the climatological and zonal mean at each latitude in isolation is only nonzero equatorward of 30N, and its meridional average with area weighting over 20–80N is only 1.3 J kg−1compared with
convective MAPE of 32 J kg−1for the same latitude band. Thus, conditional in-stability of the mean state does not contribute strongly to convective MAPE.
To calculate dry MAPE, the divide-and-conquer algorithm is used as for the moist MAPE calculation but with the input relative humidity set to zero. EKE Calculations. To calculate EKE, we first apply a 2.5–6-d Butterworth bandpass filter to four-times-daily horizontal winds on a 2.5°× 2.5° grid from ERA-Interim reanalysis over 1979–2017. Data below the surface pressure are removed (we do not use the approach described above for the monthly temperature and hu-midity because here we are using instantaneous data). A mass-weighted vertical integral of kinetic energy of the filtered wind time series is calculated at each latitude–longitude grid point to give the local vertically integrated EKE. A JJA-and area-weighted mean of the EKE is then calculated to give the time JJA-and spatial mean EKE over the specified latitude band for a given year.
Idealized Atmospheres. Idealized atmospheres are constructed by first imposing profiles of surface air temperature, Ts, as a function of latitude,ϕ:
Temperature Gradient (K degree
-1
)
Convective MAPE (J kg
-1)
3.75
5
6.25
7.5
8.75
10
11.25
289
290
291
292
293
294
295
Mean Temperature (K)
0.2
0.3
0.4
0.5
0.6
Nonconvective MAPE (J kg
-1)
100
200
300
400
500
600
289
290
291
292
293
294
295
Mean Temperature (K)
0.2
0.3
0.4
0.5
0.6
A
B
Fig. 4. Energetic reservoirs of idealized atmospheres. (A) Nonconvective MAPE and (B) convective MAPE in idealized atmospheres over the latitude band 20– 80°N as a function of mean surface temperature and mean surface meridional temperature gradient in that latitude band. The idealized atmospheres are representative of Northern Hemisphere summer (see Methods for details). Contour intervals are 100 J kg−1in A and 1.25 J kg−1in B. Red arrows indicate changes in the JJA atmosphere based on ERA-Interim trends over 1979–2017 (seeSI Appendix, Fig. S7and Methods for details), and white dashed line extends
these changes along the same slope for clarity. EARTH,
ATMOSPHERIC,
AND
PLANETARY
SCIENC
TsðϕÞ = Teq− ΔTsin2ϕ,
where Teqis the surface temperature at the equator andΔTis a parameter controlling the meridional surface temperature gradient. Vertical temperature profiles in the atmosphere based on the surface temperatures are then de-termined as follows. First, reversible moist adiabatic parcel ascents with an as-sumed initial surface relative humidity of 85% are constructed in which the temperature profile follows a dry adiabat until saturation, after which it fol-lows a saturated moist adiabat. A stratosphere with a constant temperature of 240 K is imposed above the tropopause, with the tropopause defined as the level at which the parcel ascents reach 240 K. While warmer than the real tropopause, this choice limits the extent to which upper-level meridional temperature gradients become much steeper than in the real atmosphere, inflating MAPE values. Next, vertical relative-humidity profiles are imposed with boundary-layer relative humidity of 85% from the surface up to 900 hPa, free-tropospheric relative humidity of 45% between 900 hPa and the tropo-pause, and stratospheric relative humidity of 0.01%. Using one value of free-tropospheric relative humidity at all latitudes is a simplification, and we chose a value close to the climatological value at lower latitudes where ascending air originates. Lastly, temperature profiles are constructed such that the virtual temperature profile with the imposed relative humidity values matches the virtual temperature profile of the moist adiabat. This procedure allows us to produce a subsaturated atmosphere that is neutral to moist convective in-stability. As a result, the convective MAPE is driven by the large-scale pattern of ascent and descent rather than having a contribution from conditional in-stability in the initial condition at a given latitude. In particular, the moist available potential energy of a column of air at a given latitude in isolation, the GCAPE (43), is zero.
We solve for TeqandΔTto produce an evenly spaced grid of mean sur-face temperatures and sursur-face temperature gradients averaged with area
weighting over the latitude band 20–80N. The mean surface temperatures are 289–295 K at increments of 0.5 K, and the mean meridional surface tempera-ture gradients are 0.15–0.65 K degree−1at increments of 0.05 K degree−1. The
moist MAPE and nonconvective and convective components are calculated for each of these idealized atmospheres over 20–80N. The resulting values of moist MAPE and its convective and nonconvective components are shown in Fig. 4.
Based on ERA-Interim over JJA and 20–80N, the mean surface temperature is 292 K and the mean meridional surface temperature gradient is 0.44 K degree−1 (SI Appendix, Fig. S7). At these values, the nonconvective MAPE for the ideal-ized atmosphere is 325 J kg−1compared with 185 J kg−1from ERA-Interim, and the convective MAPE for the idealized atmosphere is 9 J kg−1compared with 32 J kg−1from ERA-Interim. The larger nonconvective MAPE in the idealized atmosphere likely relates to the meridional temperature gradients aloft being too steep because the idealization of moist-adiabatic lapse rates becomes less accurate at higher latitudes. The smaller convective MAPE in the idealized atmosphere may relate to inaccuracy in the idealized relative-humidity struc-ture since convective MAPE only receives a small contribution from conditional instability of the mean state in ERA-Interim. However, these discrepancies in absolute values are not problematic because our aim in using the idealized atmosphere is to better understand the relative changes in convective and nonconvective MAPE as a function of the surface parameters.
ACKNOWLEDGMENTS. We thank three anonymous reviewers for valuable comments. We are grateful to T. Cronin, H. Wernli, E. Chang, and S. Schemm for helpful discussions; to A. Dai and J. Huang for use of the homoRS92 Dataset; to S. Sherwood for use of the IUK2 dataset; and to the European Center for Medium-Range Weather Forecasts for use of the ERA-Interim reanalysis. C.G.G. acknowledges support from the National Science Foundation Graduate Research Fellowship Program under NSF Grant 1122374. P.A.O. acknowledges support from NSF Grants AGS 1552195 and AGS 1749986.
1. Screen JA, Simmonds I (2010) The central role of diminishing sea ice in recent Arctic temperature amplification. Nature 464:1334–1337.
2. McCarthy MP, Thorne PW, Titchner HA (2009) An analysis of tropospheric humidity trends from radiosondes. J Clim 22:5820–5838.
3. Sherwood SC, Nishant N (2015) Atmospheric changes through 2012 as shown by it-eratively homogenized radiosonde temperature and wind data (IUKv2). Environ Res Lett 10:054007.
4. Dai A, et al. (2011) A new approach to homogenize daily radiosonde humidity data. J Clim 24:965–991.
5. Coumou D, Lehmann J, Beckmann J (2015) The weakening summer circulation in the Northern Hemisphere mid-latitudes. Science 348:324–327.
6. Chang EKM, Ma CG, Zheng C, Yau AMW (2016) Observed and projected decrease in Northern Hemisphere extratropical cyclone activity in summer and its impacts on maximum temperature. Geophys Res Lett 43:2200–2208.
7. Leibensperger EM, Mickley LJ, Jacob DJ (2008) Sensitivity of US air quality to mid-latitude cyclone frequency and implications of 1980-2006 climate change. Atmos Chem Phys 8:7075–7086.
8. Harvey BJ, Shaffrey LC, Woollings TJ (2014) Equator-to-pole temperature differences and the extra-tropical storm track responses of the CMIP5 climate models. Clim Dyn 43:1171–1182.
9. O’Gorman PA (2010) Understanding the varied response of the extratropical storm tracks to climate change. Proc Natl Acad Sci USA 107:19176–19180.
10. Ye H, Fetzer EJ, Wong S, Lambrigtsen BH (2017) Rapid decadal convective pre-cipitation increase over Eurasia during the last three decades of the 20th century. Sci Adv 3:e1600944.
11. Riemann-Campe K, Fraedrich K, Lunkeit F (2009) Global climatology of convective available potential energy (CAPE) and convective inhibition (CIN) in ERA-40 reanalysis. Atmos Res 93:534–545.
12. Lorenz EN (1955) Available potential energy and the maintenance of the general circulation. Tellus 7:157–167.
13. Lorenz EN (1979) Numerical evaluation of moist available energy. Tellus 31:230–235. 14. Stansifer EM, O’Gorman PA, Holt JI (2017) Accurate computation of moist available
potential energy with the Munkres algorithm. Q J R Meteorol Soc 143:288–292. 15. Schneider T, Walker CC (2008) Scaling laws and regime transitions of
macro-turbulence in dry atmospheres. J Atmos Sci 65:2153–2173.
16. O’Gorman PA, Schneider T (2008) Energy of midlatitude transient eddies in idealized simulations of changed climates. J Clim 21:5797–5806.
17. O’Gorman PA (2011) The effective static stability experienced by eddies in a moist atmosphere. J Atmos Sci 68:75–90.
18. Yuval J, Kaspi Y (2017) The effect of vertical baroclinicity concentration on atmo-spheric macroturbulence scaling relations. J Atmos Sci 74:1651–1667.
19. Pan Y, et al. (2017) Earth’s changing global atmospheric energy cycle in response to climate change. Nat Commun 8:14367.
20. Kim W, Choi Y-S (2017) Long-term change of the atmospheric energy cycles and weather disturbances. Clim Dyn 49:3605–3617.
21. Dee DP, et al. (2011) The ERA-Interim reanalysis: Configuration and performance of the data assimilation system. Q J R Meteorol Soc 137:553–597.
22. Madonna E, Wernli H, Joos H, Martius O (2014) Warm conveyor belts in the ERA-Interim dataset (1979-2010). Part I: Climatology and potential vorticity evolution. J Clim 27:3–26.
23. Rasp S, Selz T, Craig GC (2016) Convective and slantwise trajectory ascent in convection-permitting simulations of midlatitude cyclones. Mon Weather Rev 144:3961–3976. 24. Pauluis O (2007) Sources and sinks of available potential energy in a moist
atmo-sphere. J Atmos Sci 64:2627–2641.
25. Seeley JT, Romps DM (2015) Why does tropical convective available potential energy (CAPE) increase with warming? Geophys Res Lett 42:10429–10437.
26. Singh MS, Kuang Z, Maloney ED, Hannah WM, Wolding BO (2017) Increasing po-tential for intense tropical and subtropical thunderstorms under global warming. Proc Natl Acad Sci USA 114:11657–11662.
27. Singh MS, O’Gorman PA (2013) Influence of entrainment on the thermal stratification in simulations of radiative-convective equilibrium. Geophys Res Lett 40:4398–4403. 28. Agard V, Emanuel K (2017) Clausius-Clapeyron scaling of peak CAPE in continental
convective storm environments. J Atmos Sci 74:3043–3054.
29. Thompson PD (1987) Large-scale dynamic response to differential heating: Statistical equilibrium states and amplitude vacillation. J Atmos Sci 44:1237–1248.
30. Ambaum MHP, Novak L (2014) A nonlinear oscillator describing storm track vari-ability. Q J R Meteorol Soc 140:2680–2684.
31. Thompson DWJ, Barnes EA (2014) Periodic variability in the large-scale Southern Hemisphere atmospheric circulation. Science 343:641–645.
32. Korty RL, Schneider T (2007) A climatology of the tropospheric thermal stratification using saturation potential vorticity. J Clim 20:5977–5991.
33. Schneider EK (1981) On the amplitudes reached by baroclinically unstable distur-bances. J Atmos Sci 38:2142–2149.
34. Betts AK, Harshvardhan (1987) Thermodynamic constraint on the cloud liquid water feedback in climate models. J Geophys Res Atmos 92:8483–8485.
35. Chylek P, Folland CK, Lesins G, Dubey MK, Wang MY (2009) Arctic air temperature change amplification and the Atlantic multidecadal oscillation. Geophys Res Lett 36:L14801. 36. Ding Q, et al. (2014) Tropical forcing of the recent rapid Arctic warming in
north-eastern Canada and Greenland. Nature 509:209–212.
37. Wang J, et al. (2013) Radiation dry bias correction of Vaisala RS92 humidity data and its impacts on historical radiosonde data. J Atmos Ocean Technol 30:197–214. 38. Haimberger L, Tavolato C, Sperka S (2008) Toward elimination of the warm bias in
historic radiosonde temperature records–Some new results from a comprehensive intercomparison of upper-air data. J Clim 21:4587–4606.
39. Sherwood SC, et al. (2010) Relative humidity changes in a warmer climate. J Geophys Res Atmos 115:D09104.
40. Simmons AJ, Untch A, Jakob C, Kållberg P, Undén P (1999) Stratospheric water vapour and tropical tropopause temperatures in ECMWF analyses and multi-year simulations. Q J R Meteorol Soc 125:353–386.
41. Wang J, Randall DA (1994) The moist available energy of a conditionally unstable atmosphere. Part II. Further analysis of GATE data. J Atmos Sci 51:703–710. 42. Harris BL, Tailleux R (2018) Assessment of algorithms for computing moist available
potential energy. Q J R Meteorol Soc 144:1501–1510.
43. Randall DA, Wang J (1992) The moist available energy of a conditionally unstable atmosphere. J Atmos Sci 49:240–255.