Publisher’s version / Version de l'éditeur:
Journal of the Illuminating Engineering Society, 24, 1, pp. 3-12, 1995
READ THESE TERMS AND CONDITIONS CAREFULLY BEFORE USING THIS WEBSITE. https://nrc-publications.canada.ca/eng/copyright
Vous avez des questions? Nous pouvons vous aider. Pour communiquer directement avec un auteur, consultez la
première page de la revue dans laquelle son article a été publié afin de trouver ses coordonnées. Si vous n’arrivez pas à les repérer, communiquez avec nous à [email protected].
Questions? Contact the NRC Publications Archive team at
[email protected]. If you wish to email the authors directly, please see the first page of the publication for their contact information.
NRC Publications Archive
Archives des publications du CNRC
This publication could be one of several versions: author’s original, accepted manuscript or the publisher’s version. / La version de cette publication peut être l’une des suivantes : la version prépublication de l’auteur, la version acceptée du manuscrit ou la version de l’éditeur.
Access and use of this website and the material on it are subject to the Terms and Conditions set forth at
Development of atrium daylighting prediction : from an algorithm to a
design tool
Atif, M. R.; Boyer, L. L.; Degelman, L. O.
https://publications-cnrc.canada.ca/fra/droits
L’accès à ce site Web et l’utilisation de son contenu sont assujettis aux conditions présentées dans le site
LISEZ CES CONDITIONS ATTENTIVEMENT AVANT D’UTILISER CE SITE WEB.
NRC Publications Record / Notice d'Archives des publications de CNRC:
https://nrc-publications.canada.ca/eng/view/object/?id=28c04027-7198-4f94-a12d-45e8027807a0 https://publications-cnrc.canada.ca/fra/voir/objet/?id=28c04027-7198-4f94-a12d-45e8027807a0
http://www.nrc-cnrc.gc.ca/irc
De ve lopm e nt of a t rium da ylight ing pre dic t ion: from a n a lgorit hm t o a
de sign t ool
N R C C - 3 8 5 0 4
A t i f , M . R . ; B o y e r , L . L . ; D e g e l m a n , L . O .
A u g u s t 1 9 9 4
A version of this document is published in / Une version de ce document se trouve dans:
Journal of the Illuminating Engineering Society,
24, (1), pp. 3-12, 1995 (Also
published in the Proc. of the Illuminating Engineering Society (IES) Annual
Conference, Miami, Aug. 7-11, 1994, pp. 587-612).
The material in this document is covered by the provisions of the Copyright Act, by Canadian laws, policies, regulations and international agreements. Such provisions serve to identify the information source and, in specific instances, to prohibit reproduction of materials without written permission. For more information visit http://laws.justice.gc.ca/en/showtdm/cs/C-42
Les renseignements dans ce document sont protégés par la Loi sur le droit d'auteur, par les lois, les politiques et les règlements du Canada et des accords internationaux. Ces dispositions permettent d'identifier la source de l'information et, dans certains cas, d'interdire la copie de documents sans permission écrite. Pour obtenir de plus amples renseignements : http://lois.justice.gc.ca/fr/showtdm/cs/C-42
I.
I
[
joャヲヲセal
.. Illuminating
Engineering
Society
VOLUME 24 NUMBER 1 WINTER 1995
Development of Atrium Daylighting Prediction: From an Algorithm to a Design TooL
00.. 0.3
MoR.Atif,1.1.Boyer,andL.I).Degel"",.
UV Emission from General Lighting Lamps.
0
0
0
13
B.S. Bergman, T.G. Parh4m, and T.K. McGowan
Effects of Lighting, Zoning, and Control Strategies on Energy Use in Commercial Buildings 0
.25
A. Mahdavi,P.Mathew,S.Kumar, V. Hartkopf, and V. LoftnessObstacle Detection Rationale for Vehicle Headlamps
00
0
00
36
If(Komuztka
A Study of HID Lamp Life when Operated by Electronic Ballasts 0 • • • • • • • • • • • • • • • • • • • • • 0 • • •
41
N. Fukumori, H. Nishimura, K. Uchiluuhi, and M.FukuluJm
Dependency of Cathode Temperature on Operation Frequencies in Fluorescent Lamps
48
Y. WaItlnab.
On the Photometry of Integrated Compact Fluorescent Lamps 0 • • • • • • • • • • • • • • • • • • • • • • •
58
A.Jv. SerresDesign Considerations for New Highly Loaded High.Frequency Fluorescent Lamp Systems
63
T.a Leyh .
Visual Performance and Visual Clarity under Electric Light Sources:
Part I-Visual Performance
0
0069
PoL Vrabel, C.A. Berneclun; and R.G. Mistrid
Statements and opinions expressed in contributed papers intheJournal o/the Illuminating Engineer-fng Society are expressions of contributors and do not necessarily represent the policies or
opinions of the Society.
Published twice yearly (winter and summer) in the United States of America by the Illuminating Engineering Society of North America, 120 Wall Street, 17th Floor, New York, NY 10005·4001. Copyright, Illuminating Engineering Society of North America. 1995. Bulk rate postage paid at Hanover, NH. and additional mailing offices. This publication is indexed regularlyby the Engineeringlndex, Inc. and is available on micronIm from University Microfilm. Ann Arbor, MI 48106. Subscription rates: $195.00 per year, plus$3.00postage outside the United States, Canada, and Mexico. Single copies: $125.00. Editorial office: 120 Wall Street, 17th Floor, New York, NY 10005-4001. Printing office: Hanover, NH. ISSN 0099·4480.
VOLUME 24
NUMBER 1
WINTER 1995
PublisherWilliam Hanley, CAE
Editor LoisI. Burgner Assistant Editor Kenneth
J.
Che Assistant Editor Roslyn Lowe 'lfpesetter Dorothy Roebuck Artist Gregg Russitano...
3
Development of Atrium Daylighting Prediction:
From an Algorithm to a Design Tool
M.R. Atif(1), L.L. Boyer (2), andL.O. Degelman (2) THIS PAPER WAS PRESENTED AT THE 1994 IESNA ANNUAL CONFERENCE
Introduction
Figure I-Daylight distribution (DF at the center) on top-lit atrium floor
The algorithm in Equation I was validated by measurements in several real, four-sided atria, up to eight stories high.lO
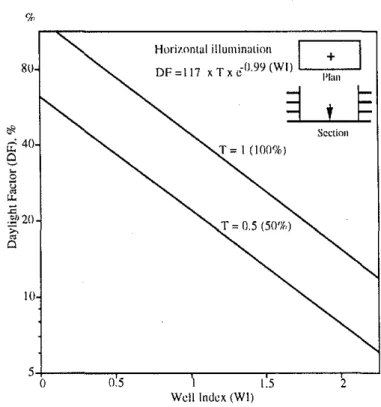
This algorithm applies to a four· sided atrium, and was developed only for planar walls with a fixed reflectance of 30 percent. Therefore, it does not take into account different wall configura-tions or reflectances. It is limited only to the predic-tion of the DF at the center of the floor, rather than an indicator of the overall daylight distribution. Final· ly, it is important to transform any daylighting algorithm into a design tool to be used at the preliminary stage of design.
(2)
Section T=0.5 (511%) T=1 (100%)2
x length x width Hnrii',ontal illuminationI
+
I
DF =117 x T x 0 11.99 (WI) '---:-::--_. Planl t i
height x (length
+
width) WI = well index 5+---:,..,---r----.----.,.---'o
11.5 1 1.5 2 Wclilndex (WI) 10 80 (I) DF(center)=1l7xTxe-99 (WI)where DF =daylight factor at the center of the atrium floor
T=transmittance of fenestration system
Previously validared atrium daylighting algorithm
A preliminary atrium daylighting algorithm was developed for clear and overcast sky conditions using physical modeling in an artificial sky. Figure 1 shows the daylight factor (DF) at the center of the atrium floor as a function of the well index, and can be ex-pressed as follows:'
Daylighting prediction tools in atria
The atrium has become a popular architectural feature in buildings. An atrium provides high marketing value, an environmentally controlled space,
natural lighting, and shelter from rain, snow, and セ
wind.1.2 Daylighting represents one of the most aesthetic values of an atrium. However, today's atria are found in continuous need of artificial lighting, or are overlit with excessive solar gains.M This is due to
a lack of daylighting prediction tools, which would allow designers to determine at the preliminary
design stage the optimal transmittance for
daylighting.
Most daylighting calculations do not work well for atrium buildings. The approaches for daylight model-ing differ from one program to another, accordmodel-ing to the program's level of sophistication, and in the degree to which daylight modeling is implemented in-to the thermal and solar gain simulations.' Although computer-based tools were developed for daylighting alternatives, the materials available to designers have not fundamentally changed. At present, the most popular method is the physical scale model. Artificial sky facilities are also available in many research and educational institutions.6-s
Authors' a./filiations: I.National lUsearch CouncilCanadtJ, Ottawa,
ON, Canada. 2.Tems A&M University, Co/kgeStation, TX..
Objectives
The objectives of this study are to extend the daylighting prediction algorithm to include atrium
4
wall configuration and reflectance, and to determine the applications of the daylighting algorithm as a design tool for choosing optimal fenestration and wall configuration for daylighting.
Method
Procedure
Illuminance ュ・。セオイ・ュ・ョエウ were collected in
physical scale models in a sky simnlator. The scale of the foam core models was I to 24. Black foam core sheets were added to the perimeter of the physical models (around the adjacent spaces) to block the penetration of light from the sides of the atrium. The reflectance of the floor was 20 percent. View ports were used for the sensor probe and other types of
evaluation. Illumination levels were collected using an
illuminance data acquisition system, where each sen· sor has a unique calibration factor stored in the
pro-gram disk.
Description of artificial sky
The daylighting experiment was performed in the sky simulator of Texas A&M University. The facility consists of a dome 8.5 m (28 ft) in diameter with a clear height of 3.7 m (12 ft). Interior lighting is pro· vided by two separately switched perimeter bands of twin 122 em (48 inch) power groove fluorescent lamps and four stations of two 38 em (15 inch) long, high in-tensity discharge (HID) lamps, each individually con· trolled. The fluorescent lamps are fixed and the HID
lamps rotate.lO
Luminance distribution and sky conditions
Measurements were taken for clear sky with no sun
and completely overcast sky. In order to develop rules of thumb that account for average annual sky il-luminance (between clear with snn and completely overcast), only results with the clear-sky component are reported in this paper. The luminance distribu-tion of the overcast sky followed the mathematical model of Moon-Spencer, which has been adopted by the CIE and is commonly used to represent an over-cast sky." For the clear sky with no sun the settings in the sky simulator were set according to the other wide-ly accepted luminance distribution for clear sky, I.e., a
horizontal luminance that is three times セィ。エ of the zenith.12
'Sky conditions are defined according to the sky ratio method or the sky cover method."
...•...
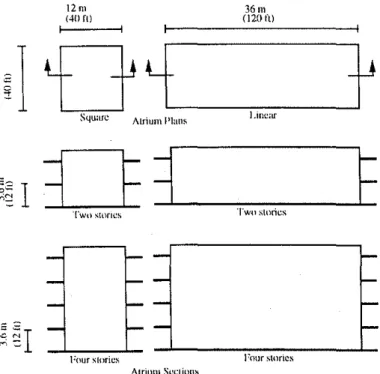
four-sided atrium types: two-story linear atrium (well index of 0.5), two-story' square atrium (well index of 0.75), four-story linear atrium (well index of 0.9), and four-story square atrium (well index of 1.35). Figure 2 shows a schematic description of these generic atria. Thble I shows the section aspect ration (SAR), plan aspect ratio (PAR), and the well index of
these atrium types.
Variations in the top glazing included config-uration and projected area of the glazing. Two types of top glazing were investigated: horizontal and tilted south-facing (45 degrees). The top-glazing openings run along the length of the atrium. The widths of all atria were constant 12 m (40 ft) and were divided into eight parts, each 1.5 m (5 ft) wide. The area of the top glazing was varied by blocking one or more openings. This produced four areas of 38, 50, 75, and 100 percent of the total horizontal projected area. Figure 3 shows the different alternatives for the south-facing top-glazing areas. By analogy, the same distribu-tion was used for the horizontal glazing, using the
same percentage.
Variations in the atrium walls included to-total area ratio and reflectance. Two different opaque-to-total area ratios were considered for each type of atria: 30 and 60 percent. Figure 4 shows a sample distribution of these areas for the square atrium. The
reflectance of the solid area was varied three times: 25,
40, and 90 percent. 12m 36m (40f\) (120ft) I -c
I
Oi
t
HBGセ」 -:!Square AtriumiGャ。ョセ l.inear
6-::;
I
Q
セ
E
セM
NNNNN[セ
Twoウャャャイゥ・セ TWIl stories
Figure 2-Dimensions of the generic shapes of atria for the daylighting experiment
Atrium physical parameters
Variations for the atrium physical parameters
in-cluded geometry, top glazing, and atrium walls.
Il-luminance measurements were collected in four
Four stories
AtriumSCl.:!iOllS
•••••••••••••••••••••••••••••••••••••••••••••
5
Table I-Dimension and proportion indexes of the four atria
Geometry Number of Height Width Length SAR PAR Well
stories (m) (m) (m) index
Square 2 9.1 12.2 12.2 0.75 1.0 0.75
4 16.4 12.2 12.2 1.35 1.0 1.35
Linear 2 9.1 12.2 36.6 0.75 0.33 0.5
4 14.4 12.2 36.6 1.35 0.33 0.9
Figure 3-Different alternatives for the top-glazing area
Results and discussion
Thble 3 shows the value of the transmittance for the Data analysis tools
The average DF at the atrium floor was used as the main index for results and analysis. The average DF at the atrium floor was the average of the DF's of all nine
point measurements at the atrium floor. The
transmit-tance of each top fenestration was calculated as the
ratio of the average horizontal illumination
measure-mentjust below the top fenestration to the horizontal "outdoor" illumination (measured in the sky simulator). This transmittance, as described in the IESNA Lighting Handbook Eighth Edition, accounts for
the overall configuration of each atrium cover
compo-nent. It should not be confused with the transmit-tance of the glass or with the transmittransmit-tance of the glazed area alone.
The variations in the atrium walls (i.e., the solid area
and its reflectance) were combined as one index
called the effective reflectance. The effective reflec-tance was calculated as an area·weighted value. Thble 2 shows the different values of the effective
reflectance.
17 test points for the four·story atrium, or 13 for the
two-story atrium. Anglc,;45
'"
GlazingArea'" 50% Glazing Area=37.5% Glazing Area;; 75% 12m (40ft) Glazing Area'" 100% Urn 3m (5fl) (i0 ft) セ セ Configuration I""
LLセLZセz
,
"'T5m
(5 ill Southj
Figure 4-Schematic description ofmasSdistributor for the square atria
Table 2-Calculated effective reflectance of the internal atrium walls (percent)
21.0 34.0 64.0
18.0 not tested not tested
20.8 31.7 65.0
17.8 not tested not tested Reflectance of solid area atria of
the walls (percent)
40 90
65.0 35.0 31.7
22.0
not tested not tested not tested not tested
25 20.8 17.8 21.0 18.0 60.0 30.0 66.7 27.8 66.7 27.8 60.0 30.0 Solid area walls (percent) Four-story square Two-story linear Four-story linear Two-story square Type of atria Test
points
Horizontal illuminance measurements were also
taken in the physical models for the selected tests. Nine horizontal test points were selected through a grid of 6 by 6 m (20 by 20 ft) for the square atria and through a grid of 6 by 18 m (20 by 60 ft ) for the linear
atria. Horizontal measurements were taken at a
workplane height of 0.75 m (2.5 ft) above the floor.
Ver-tical measurements (Le., on a verVer-tical plane) were
taken at the same workplane height but are not reported in this paper. The daylighting experiment in-cluded more than 120 tests. Each test inin-cluded either
6
...
100
(4)
Wclllnucx '" O.<J
211 411
no
XIITransmiuance(Ifthe tor-fenestralion,% • 65.0 II 35.0 .... 31.7 V 22.0 X 20,!'! • L7.' II HDF=BxTxeER SQィMMMMMMMMMMMMMMGtQAイMセ
Effective reflcclance (If the atriulIIキ。ャャセN %
where ER = the effective reflectance of the atrium walls, including both the solid area and its reflectance
B
=
a mathematical expression that is afunc-tion of the well index
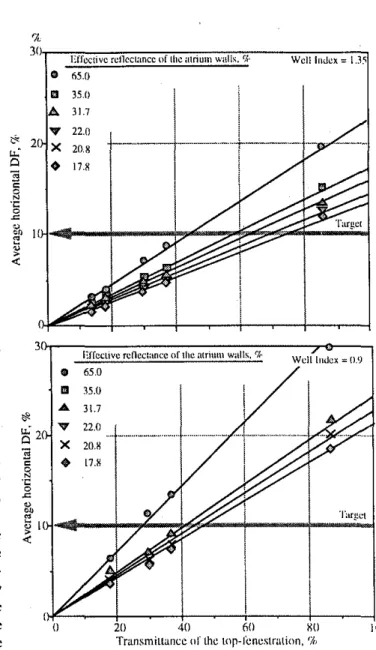
Average horizontal DF and the well index- Equation I shows that the DF at the center is a function of the in· verse of the exponential of the well index.s The average DF for the measured data verified this rela-examples of these plots for well indexes of 1.35 and 0.9 respectively. Both figures show that data for each transmittance fit parallel exponential curves with an R-square of about 95 percent. This indicates that Equation 3 can be transformed as follows:
Figure 5-Average horizontal DF at the atrium floor as a function of the transmittance for different effective reflectance values
(3)
HDF=AxT%
ThbJe 3-Measured overall transmittance for different top- 311
Effective rellccumcc of the atriumキhiャセN C,l, Wclllnucx '"QNSNセ
fenestration types under diffusesky(percent)
"
65.0Top'glazing area Atrium type Horizontal Vertical III 35.0
(percentage of top glazing south facing A 31.7
projected roof top glazing
..,
22.0area) & 21 X
u:
20,8 100.0 Linear 85.0 30.0"
•
17.S Square 86.0 29.0 "§ c 0 NLinear not tested 18.0 'C
50.0 0
Square not tested 19.0 セセ
on ((
Linear 37.0 15.0
t
37.5 >
Square 36.0 14.0
«
different top-fenestration systems. The transmittance of the top fenestrations tested varied from 14.0 per· cent (tilted south·facing with an area 37.5 percent of the total projected roof area) to 86.0 percent (hori-zontal with an area 100 percent of the total projected roof area).
A comprehensive daylighting prediction algorithm was developed based on the data listed above, and on
the previously validated algorithm of Equation 1.The
latter daylighting prediction tool did not include any physical characteristics of the atrium walls, except to assume a fixed effective reflectance of 30 percent.
Average horizontal DF and transmittance-Theaverage horizontal DF was plotted in Figure 5 against the transmittance for given well index and effective reflec· tance for well indexes of 0.9 and 1.35 for four·story atria. For a given effective reflectance the average horizontal DF was linearly proportional to the transmittance. This was in agreement with the
algorithm in Equation 1. Therefore, the average
horizontal DF can be expressed as follows:
where HDF= the average horizontal DF at the atrium floor, in percent
T = the top'fenestration system transmittance A=a mathematical expression that is a func-tion of the well index and the effective reflectance
The lowest R-square obtained with the linear regres-sion was about 95 percent. As expected, the curves can· verge to zero: with a null transmittance there is no light penetration.
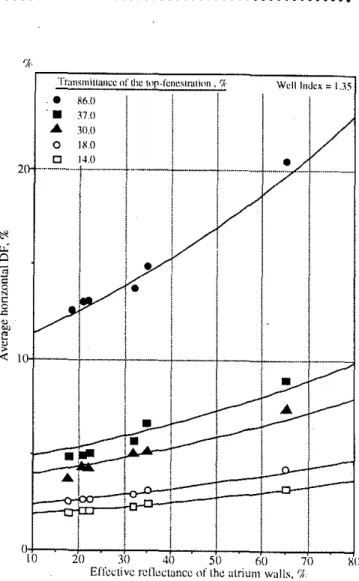
Average horizontal DF and effective rejlectance-The average horizontal DF was not linearly proportional to the effective reflectance of the atrium walls. The best fit was obtained with exponential curves. The average horizontal DF was plotted against the effective reflectance of the atrium walls. Figures 6 and 7 show
...
7
xo
o Well Index = 0.9I
--1
Tmnsmiuancc of tllC top-fcnestration ,% _ 86.0 • 37,0 ... 30.0 o 18.0 CJ 14,0 10 20 30 40 50 60 70EITecLivcイ」ョセ」エエQョcc or the atrium walls,q
% SQHmMMMMMMMセMMM⦅NLNNNNLNNNイ⦅⦅イMMML
•
Wclllndcx:=US tイ。ャャセュゥャャャャュ[」 of the !np.fcneslmlion ,'k :.- R6.0 .,1 37.0 .... 30,0 ! o lX.OI
I
o 14.0 II
2(---r--+--"---
. , II
I II
!
!
I II
I
I :
!
I
'"
..; Cl 3c 0 N 'C C セ セ セLe
"
>-<
I(i
I
HᄋjZャ「ッセセZゥRHZZMIMNNNNLSJoNNNNLセM[THゥZMIセMU[AHZZMIMMVJoNNNNLセMZWAZMoセNNNNNNBxiャ eヲイセャL[エゥカセ イセョcャL[エ。ョ」・ oflィセ atrium wulls.'7.Figure 6-Curve fit of the average horizontal DF as a function of the effective reflectance in four-story square atria under clear diffuse
sky
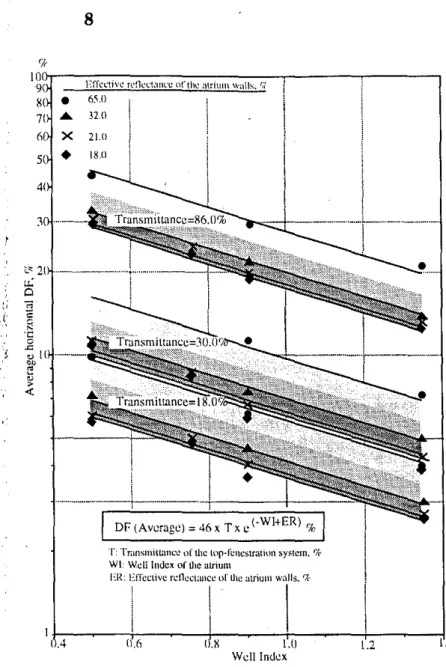
tionship as well. Figure 8 shows the average horizontal DF, in logarithmic scale, plotted against the well index as a function of the overall transmittance and effective reflectance. It shows that all average DF curves fit parallel lines and suggest that Equation 4 can be transformed as follows:
Figure 7-Curve fit of the average horizontal DF as a function of the effective reflectance in four-story linear atria under clear diffuse sky
T
=
the top-fenestration transmittanceER=the effective reflectance of the atrium walls
where HDF = the average horizontal DF on the atrium floor, in percent
The linear regression shown in Figure 8, defined the constant C as equal to 46.0. Therefore, the new daylighting algorithm can be expressed as follows:
HDF=CxTxeERxe-W1 where WI = the well index
C
=
a constantHDF=46 xTx e'-WI,ERj
(5)
(6)
WI = the well index of the atrium
Comparison with the previous algorithm
The validated algorithm in Equation I was deter· mined by a .daylighting experiment with internal atrium walls simulated by a solid surface (no open. ings) with a nominal reflectance of 30 percent. The same material reflectance measured by the authors with a more accurate lightmeter was 34 percent. For a com parison between the previous and extended algorithms, it was essential to make some interpola-tions. _First, the value of the effective reflectance simulated in the previous algorithm (34 percent) was substituted in Equation 6. Second, the average DF was
8
...
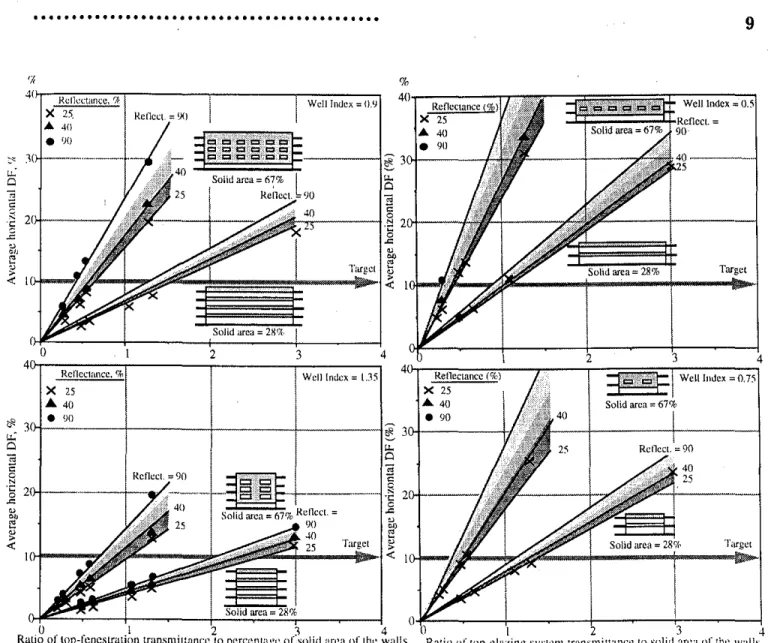
Application
The algorithm developed in this study was
represented into a graphical form to include the ratio of the top-fenestration transmittance to the solid frac· tion of atrium walls (R) (for a given reflectance) as a dimensionless index for daylighting prediction. First, R is more useful for design because it deals with dimensions of atrium physical parameters. Second, R defines the two major atrium physical parameters that affect the trade·off between daylighting and thermal performance. Figures 9 and 10 show the average horizontal DF prediction at the atrium floor as a func-tion of the ratio R for different reflectance values.
For daylighting prediction, the ratio has always average transmittance of 50 percent, the DF at the center with the new algorithm would range between 16.0 and 20.4 percent, compared to 21.7 percent with the previous algorithm.
(7)
(8)
•
DF(center)=1.3 x [46 xTx e"WI , E"]=
87xTxe,wI
DF(center)
=
1.7 x [46 xTx e"WI, E"]=
III xTxe'W(The DF in Equation 1 is slightly higher than that with the new algorithm. For a well index of 1 and an substituted by the DF at the center, taking into ac· count that the measured DF at the center was about L3 to 1.7 times that of the average. This estimation was based on measurements on the atrium floor, one of which was located at the center of the floor. This is because the previously validated algorithm was based on the DF at the center of the atrium floor rather the average. Therefore, the DF (at the center) in Equation 6 would range between the two following equations:
Figure 8-Daylighting prediction at the atrium floor under diffuse sky as a function C'fthe well index, transmittance, and the effective reflectance of the atrium walls
,
I
i
i
,·,',··--'--1-"·----,-I
DF(Average)=46x Txc{·WI+ER) %Discussion
The comparison between the two algorithms was based upon the effective reflectance of 34 percent. The algorithm that was restricted to the reflectance of 30 percent was developed using a single solid surface all over the atrium walls. However, data for the newly developed algorithm were collected in atria in which the walls of the first floor where glazing was simulated with a 15 percent reflectance. Therefore, reflected or direct light reaching the walls of the first floor is mostly abo sorbed, and only a slight amount is reflected onto the atrium floor. This explains to a great deal the small discrepancy between the two algorithms.
While the previous algorithm is a useful tool as a rule of thumb for daylighting prediction at the preliminary design stage, it does not take into account the relationship between the open and solid areas of the atrium walls. Logically, the first floor should have more openings since it receives the least amount of daylight and is the main connection between the
T:Tr..lllsmitt.ancc nflhc lnp-fclICSlrminl\ system.'7r atrium floor and occupied spaces. The newly
WI: Wcllillucx. OfU1Catrium developed algorithm was based upon two of the most
ER: E!TcClivc rdlccl<U1CC or the atrium walls,'7c f I'd f
1"
I
common ratios 0 so I to open area0 atrium walls.Furthermore, the DF at the center is greatly affected
' I
by not only the transmittance, but by the orientationI
LQMNTWMセMMZjiiMZLVMセMMMMLGKiNxLLMMセMMZゥャヲ」NiiMセMMKQNLNNRMセMMLャiNT of the top fenestration. The average DF is a much bet·w、ャャョ、セク ter evaluation tool because it reflects minimum, me-dian, and maximum illumination levels at the atrium floor. It is important to note that the effect of the reflectance has been tested for diffuse light. The effect of reflectance on indoor illumination levels under dif· fuse light was reported lower than that under sunlight at high altitude.' Glazing can also contribute to specular light distribution.
5
1000-=---,----,-,---,----,----.,---,----,
9( Effcl'ti\'cfl.'l1Cl'!,1IK'C ot"(hc,mi\11lI wn\1s.17;
gt • 6.'i.(l 7( ... 32,0 6 X 21.0 • 18.0 " .'
...
9
40
25
Solid area = 28% Target
Mセセセセセセセヲ
Well Index '" 0.5 %40.,....----..r
Rencctance(%) X 25 Ji;,. 40 • 90 Rellee!.=l)() 'II THヲイMM[[r・[Z[Niャ[ZZ」[Z[」ャ[Z[。ョZZZ」」ZZMᄋNM[[セZャMMMMMLMMMMMLMMBwGB」QZZG '"'''-de-''-:-O'"'' X 25. ... 40 • f)OI
oセMMMMKMMMMAZMMセMMK[MMMMMMiRatlO ollop-lcnCSlratlon lrunsmlUuncc to percentugc of solid area of the wallsD . . .I . 2 3 4 0Ratio of lop-glazing system transmiltancc to solid an:a of the walls1 2 3 4
TッLMoMxM[[rRセo[ZZZォZZLLZZュZZLLZZLNM[EZイMMM⦅MRイMM⦅MMMMイS⦅wMGMiャMiBM、MBMZMljGU
4
TGQセxスrセ[セセAALLZァiBAAABLゥAG}Hz[EII
MOセMM⦅RイZSZゥェェャセセゥ|セ_PゥセゥGエセeZイ[Bキ[[[ッゥゥャャjLィG[[[、[[BZZZ[M[PゥZNWBャ[
4
.... 40 .... 40 Solid area:= 67%.00
.00
セ SPMエMMMMMQゥMMMMKMMMMKMMMMャセ
SoKMMMMMMGセQ
o
セs
I
I
セ
J
2i
I RoO"I:YP⦅NセᄃAQᄃᄃM
...
-_---!
20+---1 g(lj Solid area"" 67% Rc!1cct.= .c セ 9() :..lセ
セ
,i
<
25 Gセcャ iHイKMMセ BセMBBBQQiッMMQ«:
:;:: .1( w.: o'"
"
.§
21Jt---/.i!
セ'"
e
セ.;:
Figure 9-Daylighting prediction at the atrium floor offour-story. four-sided atria as a function of the ratio of transmittance to solid area of the atrium walls
Figure lO-Daylighting prediction at the atrium floor of two'story, four-sided atria as a function of the ratio of transmittance to solid area of the atrium walls
been accompanied by the percentage of solid area on the atrium walls and its reflectance. For every R value, many combinations of transmittance and internal wall treatment can be fabricated to provide different values of average DE The reader is invited to use the extended daylighting prediction algorithm in Equa-tion 6 to extrapolate any reflectance of solid wall area falling within the range of the values studied. These two wall treatments represent two common extreme designs. Furthermore, other R values falling within the range of variables studied can be extrapolated.
optimal transmittance for daylighting
The algorithm also can be used to determine the optimal transmittance for effective daylighting. The optimal top-fenestration transmittance for effective daylighting cannot be defined independently of the reflective and surface characteristics of the internal
walls. An increase of the area of the atrium walls pro· vides more surfaces to reflect light downward.
Optimal top' fenestration transmittance for lighting criteria at the atrium floor can be derived from the algorithm as a function of solid wall area and its reflectance. These optimal combinations are shown in Thble 4, and are based on minimum illuminance for plants of 1,000 Ix (92 fC).13 For a typical average out· door horizontal illuminance of 10,870 Ix (1000 fc), this typical example provides an average horizontal DF target of about 10 percent. Thble 4 can help designers choose their optimal design combinations of top fenestration and wall treatments to achieve target lighting criteria at the atrium floor. It is important to note that above the well index of I, the lowest optimal transmittance is around 30 percent (e.g., transmit-tance of vertical, south-facing, top-glazing system with an area of 100 percent of total projected area). This
10
...
Percentage of solid area in the atrium walls
Thble 4':""""Optimal top-fenestration transmittance for effective
daylighting at the atrium floor under diffuse sky (percent)
result agrees with day lighting measurements on the Dallas City Hall building, which has a vaulted vertical
top-glazing facing north on the top of a linear atrium.
This atrium, with a well index higher than I, was in continuous need of artificial lighting despite side lighting at the first floor.
There are several design options that compromise
between daylight at the atrium floor and daylight con· tribution in the adjacent occupied spaces. The first option
includes an uneven vertical distributionof the solid area
in the atrium, the maximum proportion being at the
top. Upper floors of atria need less openings because they receive more direct light. Furthermore, a solid area on the upper floors is likelytoreceive light that is either
direct or has been reflected only a few times, thus in·
creasing the amount of light reflected downward. This
solution is more important for taller and narrower atria.
The second design solution would be to use
reflective elements, such as fins and lightshelves,
that would free the facades and still reflect light to the sides and the corners of the atrium floor. This would eventually increase the uniformity of light distribu· tion at the atrium floor. These fins and lightshelves should be combined with solid area at the perimeter, other·
wise their size would intervene with functional reo
quirements of the atrium floor. The third choice would
be to use stepped·down atria to allow lower floors to
receive more direct light. This solution may be inap-propriate because it increases the depth of lower floors.
References
1. Saxon, R. 1990. Atrium buildings. Encyclopedia of
architectural design, engineering, and construction. New
York: John Wiley & Sons.
2. Bednar, MJ. 1986. The new atrium. New York: McGraw·Hill.
3. Navvab, M., and Selkowitz, S. 1984. Daylighting data for atrium design. Proceedings of the Ninth National
Passive Solar Conference, Columbus, OR. Boulder, CO: American Solar Energy Society, Inc.
4. Navvab, M. 1990. Outdoors indoors: daylighting within atrium spaces. LD+A 20(no. 5):24-31.
5. Ruck, N.c. 1990. Evaluation of building energy performance. Building design and human performance. New York: Van Nostrand Reinhold.
6. Lechner, N.M. 1988. Physical models as
daylighting design tools. Architectural Lighting 1:45-47. 7. Robbins, C.L. 1986. Daylighting: Design and analysis. New York: Van Nostrand Reinhold.
8. Bryan, H. 1986. Daylighting design tools: A per· sonal review. LD+A 16:(no. 3):49-56.
9. B"yer, L.L. and Kim, K.S. 1988. Empirically·based algorithms for preliminary prediction of daylight per· Acknowledgments
A great deal of this work was funded by grants from the Caudill Fellowship Committee, the College of Ar·
chitecture at Texas A&M University, and from the firm
CRSS Inc., Houston, TX. More analysis of the study
has been done at the Institute for Research in Can· struction, National Research Council Canada.
67 28 Reflectance Reflectance (percent) (percent) 25 40 90 25 40 90 30 27 17 31 28 25 34 30 20 38 35 32 44 37 27 45 42 38 67 57 45 70 65 58
Conclusion and recommendations
The previously validated atrium day lighting predic· tion algorithm was extended to include wall treatment
such as solid area and its reflectance. The algorithm can be used to define the optimal transmittance for
daylighting as a function of the effective reflectance of the atrium walls. The algorithm was also transformed into a'graphical design tool. The study applies to clear sky with no sun only due to the absence of an
ap-propriate evaluation index for sunny conditions. However, this represents an average sky illuminance
and can be considered an appropriate design tool. The study excludes other lighting effects associated
with selection of the atrium physical parameters, such
as daylighting distribution and lighting contribution on the atrium floor. The algorithm also needs to be
tested for atria taller than those tested in this study. The recommendations pertaining tothe optimal
com-bination of the components of the entire atrium perimeter cannot be stated without taking into account other architectural priorities such as glare. functional requirements. and so on. The first pertinent concern
in daylighting an atrium istodetermine the daylighting "task" of the space, i.e., whether the atrium daylighting
role is restricted to the atrium floor only, the occu pied
spaces, or both. This basically determines the overall
transmittance as well as the configuration of its walls. The second concern istodetermine the light distribu· tion targeted at the atrium floor and walls: uniform or
light·and.shadow play. This should determine the desired
configuration of the top fenestration and the amount
of solid area on the walls and its reflectance. Finally,
data and design tools in this study contribute to the
design choices and sizing of the physical parameters
in an atrium design. Well Index 0.5 0.75 0.9 1.35
...
formance in top·lighted atriums.ASHRAE Transactions 90 (Part I): 765-781.
IO. Boyer, L.L. and Degelman, LD. 1989. A large sky simulator for daylight studies at Texas A&M University. Proceedings of the second International Daylighting Conference Part 2. Atlanta, GA: American Society of Heating, Refrigerating, and Air· Conditioning Engineers, Inc..
11. IESNA. 1994. IESNA Lighting Handbook Eighth Edition. New York: IESNA.
12. Stein, B.; Reynolds, ].S.; and McGuinness, WJ. 1992. Mechanical and electrical equipment for buildings Eighth Edition. New York: John Wiley & Sons.
13. IESNA. 1981. IESNA Lighting Handbook: 1981 Reference Volume. New York: IESNA.
Discussion
I believe that your simplified tool provides useful preliminary design information on top·glazing system
transmittance, atrium wall effective reflectance, and
average daylight factor on the atrium floor. However,
as you mention in your conclusion, there are numerous other factors, such as the adjacent space
re-quirements, glare, and the very significant thermal im·
pact, that must be taken into account. How does your
tool best fit into the preliminary design stage with regard to these other design decisions? Is it really useful after choices related to these other decisions have been made?
Your scale model uses black foam core in ,place of glass in the atrium walls. How much impact on
average illuminance at the atrium floor, will specular·
Iy reflective glass have?
I would be interested in hearing more details on the top-glazing systems modeled. Is the glazing diffusing
or clear, and what is its visible transmittance? What is
the configuration of the tilted south·facing system, is it sawtooth with opaque north·facing facades?
Last, is it really your premise that only the overall
system's transmittance is significant, and that the
specific configuration of the system is immaterial? If you are designing only for average sky illuminance (i.e., diffuse light), it would seem more appropriate in
many climates to recommend north-facing glazing to
reduce glare and solar heat gain from direct sunlight. R. Hitt:hcock Lawrence Berkeley Laboratory
I believe that in the development of a daylighting prediction tools even at early phases in the design process, direct sunlight should be considered. Direct sunlight is a very important component of day lighting
and its interaction with the structure makes a great contribution to the qualitative and quantitative
11
characteristics of the building. The sun is about five to seven times brighter than the sky; therefore it Con·
stitutes an important contribution to the illumination of an interior space, such as an atrium. The authors
have simulated a 45·degree south·facing glazing with a 37-IOO percent opening that allows sunlight in the atrium during several months of the year depending on the buildng location. This incoming sunlight in·
creases the illumination in the atrium, but was not
considered by the authors. In my opinion, the con· tribution of the sky as well as the sun should be in· cluded in this prediction tool.
The authors do not mention how they have validated their daylighting algorithms. I recommend that they compare their findings to results obtained with daylighting computer programs such as RA· DIANCE or SUPERLITE. To illustrate the usefulness of the authors' design tool, I ask them to present an
exampleof how a designer can use such a tool in a real design situation.
I conclude by recommending to the authors the use of other reliable simulation tools that offer the advan· tage of modeling different sky distributions and sun positions so that annual daylight performance data can be assessed. I also recommend that they take into account the interaction of daylighting with other per·
formance variables, such as thermal loads and oc-cupants' comfort, and make the designers aware of the strong interactions among them and how they affect
overall building performance.
L. Beltran Lawrence Berkeley Laboratory
Authors' response
10 R. Hitt:hcock
As stated in the article, the study did not deal with the impact of atrium top glazing and atrium wall
reflectance on glare and brightness ratios. Further· more, glare in a promenade atria is a very difficult concept to define because these atria are usually designed to simulate an outdoor environment and,
therefore, require high illuminance levels at the atrium floor. I've not yet found any literature related to glare problems in atria.
Even though the study did not deal with il·
luminance measurements in the adjacent spaces, the
simplified daylighting algorithm and the resulting graphical tools take into account the ratio of openings to total area of the atrium wall and the reflectance of the walls. The simplified tool predicts the average
horizontal illuminance at the atrium floor for two ex-treme, commonly encountered design scenarios with
12
the atrium walls. The higher end would correspond to
an atrium where a large daylighting contribution into
the adjacent spaces is sought. In this case, the developed design tool would specify the reflectance
needed to meet a given horizontal illuminance at the
atrium floor, since a great portion of daylight in the
atrium willpe absorbed into the adjacent spaces. The design tool does not deal with the prediction of the daylighting contribution into the adjacent spaces.
The excessive thermal loads in an atrium, usually
reported in the literature, are largely due to oversized fenestration, resulting in an overlighted atrium. The
developed design tool not only can determine the op'
timal transmittance for a given illuminance at the
atrium floor, but can provide more information on the contribution of wall reflectance in meeting this
target. In other words, the configuration and the wall reflectance can play a role in reducing the required transmittance, thus providing potential for thermal load reduction.
The scale model did not use black foam core with a reflectance of 15 percent. The simulated glass in the
fenestration system had a transmittance equalto 100
percent (there was no glass). We measured the
transmittanceof the overall fenestration system. In the case of the sawtooth configuration, the simulated glaz· ing was vertical (Le., no tilted glass).
The overall transmittance of the fenestration system is more useful at the preliminary design phase where it provides an overall quantitative daylighting perfor· mance of the system. The configuration of the atrium fenestration depends not only on the amount of daylighting sought both in the atrium and the adja· cent spaces, but on the needed quality and location of light including direct sunlight, diffuse only light, and mostly reflected light. As for R. Hitchcock's recom· mendation for north.facing glazing in warm climates to reduce heat gain, we point out again that most pro·
menade atria are designed to simulate outdoor condi·
tions, and sunlight or reflected sunlight is important for the marketability of an atrium. This recommenda· tion applies mainly in activities where direct sunlight
is not recommended such as in a library.
10 L. Beltran
The purpose of the study was to develop a design tool for daylight prediction under a diffuse sky.
However, the study does not suggest that direct
sunlight should be neglected in daylighting considera·
tions, as suggested. Furthermore, the study recognizes that an atrium experiences very dim and overcast sky conditions, as well as very bright and sunny condi-tions, andエィセj・ヲNャセ⦅セNエNjB\Nャエゥッョ system must accommodate
both. The daylighting prediction algorithm and
...
graphical design tools キ・セ・ developed as rules of
thumb for average sky conditions. The developed algorithm predicts the average horizontal illuminance at the atrium floor, and should be considered at the preliminary design stage. Computer programs such as RADIANCE and SUPERLITE can be used to examine more detailed aspects of daylighting such as il·
luminance distribution.
The algorithm was validated by comparison with the previously validated algorithm that was limited to only one effective wall reflectance (34 percent).
I have already addressed the applicability of the
developed design toll in my response toR.Hitchcock.
As an example, the paper provides information on the
optimal transmittance that would meet illuminance
requirements to keep plants healthy under a given outdoor horizontal illuminance of 10,870 Ix (1,000 fc). We have studied the problems of thermal loads and
occupants' comfort that were suggested byL.Beltran.
However, I did not address them here because, we feel, they are beyond the scope ofJournal ofthe IES.Further· more, we at the Institute for Research and Construc·
tion are conducting a long-term study on energy costs and indoor environmental aspects of atrium
buildings (see also Atif, M.R. 1992. Daylighting and cooling of atrium buildings in warm climates: Impact
of the top·fenestration and internal wall mass area. Ph.D. diss., Texas A&M University).