HAL Id: hal-02494915
https://hal.archives-ouvertes.fr/hal-02494915
Submitted on 25 May 2020HAL is a multi-disciplinary open access archive for the deposit and dissemination of sci-entific research documents, whether they are pub-lished or not. The documents may come from teaching and research institutions in France or abroad, or from public or private research centers.
L’archive ouverte pluridisciplinaire HAL, est destinée au dépôt et à la diffusion de documents scientifiques de niveau recherche, publiés ou non, émanant des établissements d’enseignement et de recherche français ou étrangers, des laboratoires publics ou privés.
A multimetric-index approach using fisheries data to
assess fish assemblage structure in relation to salinity
gradient in a tropical West African estuary
Justin Kantoussan, Jean-Marc Ecoutin, Raymond Laë, Omar Thiom Thiaw,
Luis Tito de Morais
To cite this version:
Justin Kantoussan, Jean-Marc Ecoutin, Raymond Laë, Omar Thiom Thiaw, Luis Tito de Morais. A multimetric-index approach using fisheries data to assess fish assemblage structure in relation to salinity gradient in a tropical West African estuary. African Journal of Marine Science, NISC, 2018, 40 (2), pp.175-185. �10.2989/1814232X.2018.1474802�. �hal-02494915�
1
African Journal Of Marine Science 2018, Volume 40 Issue 2 Pages 175-185
http://dx.doi.org/10.2989/1814232X.2018.1474802 http://archimer.ifremer.fr/doc/00451/56222/ © NISC (Pty) Ltd
Archimer
http://archimer.ifremer.frA multimetric-index approach using fisheries data to assess
fish assemblage structure in relation to salinity gradient in a
tropical West African estuary
Kantoussan J. 1, * , Ecoutin J. M. 2, Lae R. 2, Thiaw O. T. 3, Tito De Morais L. 2
1
Univ Gaston Berger St Louis, St Louis, Senegal. 2
IUEM, IRD, Lab Sci Environm Marin, UMR LEMAR IRD UBO CNRS IRD Ifremer, Plouzane, France. 3
Univ Cheikh Anta Diop Dakar, IUPA, Dakar, Senegal.
* Corresponding author : J. Kantoussan, email address : [email protected]
Abstract :
This study examines the effects of increasing salinity on fish assemblage structure in the Casamance Estuary, Senegal. using a series of indices. The study data were derived from commercial fishery surveys conducted between April and July 2005. Analysis of within-trophic-group diversity in the Casamance Estuary shows a significant drop in the diversity of apex predators in the upper. more saline reaches of the estuary. By contrast. primary consumers adapted well to salinity changes and exhibited higher taxonomic diversity in the upper reaches of the estuary than in the lower reaches. The findings also indicate decreases in average sizes of the landed species and the trophic levels among fish catches in the direction of the upper reaches. However, the catch per unit effort (CPUE) was globally higher in the upstream area of the estuary as compared with the downstream area. This increasing CPUE trend from the lower towards the upper reaches is attributed to (i) the high primary productivity in the upper Casamance Estuary; (ii) the increasing abundance of euryhaline fish species in an upstream direction: and (iii) 'telescoping' of the food chain through the presence of mostly herbivorous fishes in the upper reaches. Such a situation likely facilitated high fish production in the upstream area of the estuary, though multimetric indices indicated unfavourable living conditions for many fish taxa in this area.
Keywords : biological indicators, Casamance Estuary, ecosystem monitoring, fishery statistics, inverse hypersaline estuary, Senegal, taxonomic diversity
Introduction
Estuaries are transitional ecosystems, the ecological dynamics of which are subject to both marine and continental influences (Elliott and Whitfield 2011). Estuaries are characterised by complex physical processes and high productivity, and play an important role in the life cycles of many coastal fish species (Cardoso et al. 2011; Wasserman and Strydom 2011; Whitfield et al. 2012). Fishes in tropical estuaries are often subject to subsistence and commercial exploitation to meet the food requirements of local populations (Blaber 1997, 2013; Pérez-Ruzafa and Marcos 2012; Saintilan and Wen 2012).
Although the ecological importance of estuaries has largely been acknowledged, these ecosystems are increasingly affected by various types of disturbance such as pollution, eutrophication, habitat modification, overfishing and climate change, the combined effects of which seriously affect their structure and functioning (Scheren et al. 2002; Simier et al. 2004; Champalbert et al. 2007; Kantoussan et al. 2012). These forcing factors have direct and/or indirect negative effects on the quality of aquatic ecosystems for biota. These factors also affect the biological processes occurring in estuaries, threaten biodiversity and, thus, reduce the goods and services provided to local populations (Panfili et al. 2004; Miranda et al. 2005; Sosa-López et al. 2007; Gueye et al. 2012; Walsh et al. 2013).
To improve the diagnosis of various threats, tools based on indices measuring the ecological status of aquatic ecosystems have been widely developed during the last two decades (Harrison and Whitfield 2006; Borja et al. 2009; Coll et al. 2016). Thus, many indicators have been devised at different levels of biological organisation, with varying results depending on the systems studied (Gislason and Rice 1998; Adams 2002; Rochet et al. 2005; Dauvin 2007). Preliminary findings suggest that these indicators are very sensitive to the nature of the disturbance and to the tools chosen for investigation (Jennings et al. 2002; Laë et al. 2004; Rochet et al. 2005; Harrison and Kelly 2013). It is therefore important to extend their use to disturbances of various origins, including anthropogenic (e.g. pollution and overexploitation) and natural (climate variability), and to adapt their computation to available data sources, including commercial fishery statistics.
The relevance of testing indicators from commercial fisheries data is justified by the fact that in developing countries it is often difficult to organise scientific monitoring of ecosystems for lack of
means, and data from commercial fisheries are often more accessible in many of these countries. Previous estuarine fish indicator studies have avoided the use of commercial fisheries data and it is therefore important to assess the suitability of such data as diagnostic tools and for the management of aquatic ecosystems. In terms of disturbance levels and threats to aquatic ecosystems, estuaries have received considerable research attention (Deegan et al. 1997; Harrison and Whitfield 2004; Hallett et al. 2012), primarily due to the difficulties in separating natural stress – generated by normal environmental fluctuations – from anthropogenic stress (Elliott and Quintino 2007).
This study was carried out in the Casamance Estuary in Senegal, West Africa (Figure 1) to assess the effects of salinity on fish assemblages. Data used are from scientific monitoring of the catch landed by artisanal fisheries. Since the transformation of the Casamance River into an inverse, hypersaline estuary, first noted in the early 1970s (Mikhailov and Isupova 2008), few studies have examined the fish assemblage structure in this ecosystem (Albaret 1987; Kantoussan et al. 2012). The results of these studies revealed differences in species composition and structure of fish assemblages between upstream and downstream sites, and noted a decrease in taxonomic diversity associated with increasing hypersalinity in an upstream direction. The present study uses commercial fishery data to analyse the within-trophic-group taxonomic diversity, fish size structure, trophic level variation and yield per fishing trip. The information is also used to determine whether the decrease in river flow and modification to the salinity gradient associated with climate change could impact: (i) within-trophic-group diversity; (ii) the size structure of fish assemblages, trophic levels and yield by fishing trip; and (iii) the indices that best reflect changes in functional relationships within this tropical estuary.
The hypothesis underlying this work was that fish assemblage structure along a salinity gradient could be evaluated using indices based on artisanal commercial fishery data. The Casamance Estuary was chosen for this study because since the 1970s this ecosystem has been subjected to a prolonged drought and a significant long-term decline in riverine input, leading to a persistent reversed salinity gradient (Conchedda et al. 2008, 2011; Sambou et al. 2014).
Study area
Located in southwestern Senegal, the Casamance River is formed by the confluence of several small rivers that cease flowing during the dry season (Thiam and Singh 2002). The system is 350 km long (260 km of permanent river) and drains a watershed of approximately 14 000 km²
(Saos et al. 1987). In the southern part of Senegal, the climate is Sudano-Guinean, characterised by an alternation between two seasons, a wet season from mid-May to October and a dry season during the rest of the year (Thiam and Singh 2002; Carney et al. 2014).
The relief of the Casamance River basin is predominantly flat, with its highest point (75 m) located 400 km from the sea. The slope is generally very gentle in the upper part of the river (0.5 m·km-1) and almost zero for the last 200 km of the river (Marius 1985; Pagès 1986; Pagès et al. 1987). The annual precipitation in the area has shown an overall decrease since the 1950s, when it was 1 614.5 mm. Mean rainfall values were 1 475.4, 1 226.5 and 1 066.8 mm, respectively, during the 1960s, 1970s and 1980s, increasing during the 1990s to an average of 1 254.3 mm (Figure 2a). Between 2000 and 2003, the average annual precipitation declined again, and was 1 164.3 mm.
The river flow rate is remarkably low, with an average annual flow rate of 2.7 m3·s-1 (Binet et al. 1995). Freshwater inputs from the river into the estuary are seasonal and occur mainly between June and November (Thiam and Singh 2002).
Salinity values recorded in the Casamance system reflect hypersaline conditions (>40) downstream of the Maka anti-salt dam, located approximately 200 km from the river mouth (Albaret 1987; Debenay et al. 1989; Binet et al. 1995; Kantoussan et al. 2012). This dam was built to stop the advance of the saline waters upstream of the dam wall and to avoid the salinisation of agricultural lands in the area above the dam. Observations by Ndour et al. (2011) indicated salinity values falling to zero in the upstream part of the dam between October and February. Salinities in the Casamance Estuary are strongly influenced by evaporation and rainfall from both past and present years (Savenije and Pagès 1992). Human use of water from the Casamance Estuary is very low due to prevailing salinities and family subsistence farming is based mainly on direct rainfall on the land.
During the study period, the salinity increased from Elinkine, located 13 km from the estuary mouth (40.6 ± 1.1 SD), to Diattakunda, 130 km upstream of the mouth (61.6 ± 9.0), and then decreased slightly in the two most upstream villages, Simbandi Brassou (58.9 ± 10.9) and Sédhiou (57.2 ± 10.1) (Figure 2b).
Materials and methods
Sampling design
Artisanal fisheries in the Casamance Estuary were monitored at six fishing villages: Elinkine and Tendouk downstream, Adéane and Diattakunda in the middle, and Simbandi Brassou and Sédhiou in the upstream area. In each village, the surveys were conducted monthly between April and July 2005 for approximately 15 days each month. The sampling strategy was adapted from Laë et al. (2004) and Kantoussan et al. (2007). Each survey was composed of three operations: (i) monthly counts of active fishing units (one fishing unit = one canoe) to assess the fishing potential of each surveyed location; (ii) surveys of the landings conducted to determine the species composition and size of the fish; and (iii) information on fishing trips, collected by interviewing fishers every evening during the survey period (fishing site, distance from village, fishing time, gear used, number of nets set, number of people involved in fishing), to estimate the fishing effort.
The fishery in the Casamance Estuary makes use of multiple types of fishing gear. In the present study, fishing gear was classified into major categories based on the fishing technique and mesh size of the net used. For gillnets, three categories of mesh sizes (knot to knot) were distinguished: small-mesh gillnets (<30 mm), medium-mesh gillnets (30–50 mm) and large-mesh gillnets (>50 mm).
Fish that were landed were identified to species level, catches were estimated by mass of each species, and the fork length (FL in cm) of twenty individuals of each species landed was recorded.
Data processing
Diversity indices
Two taxonomic diversity indices (Warwick and Clarke 1995) were used to estimate the within-trophic-group taxonomic diversity in the landed catch, using the identity of the landed species.
The first index (taxonomic diversity index, ∆) is based on the classic Shannon diversity index, with an added component of taxonomic separation. This index is estimated as:
ij 1 / 2 i j i j i i w x x Δ = x x + x (x )
where wij is the weight given to the path length linking species i and j in the hierarchical Linnean
tree, and xi represents the catch in mass of the ith species.
The second index (taxonomic distinctness index, ∆*) is purely an index of taxonomic distinctness, expressed without considering the contribution of species to diversity. This index is expressed as: ij i j i j w x x Δ x x
Taxonomic indices are less sensitive to the sample size or sampling efforts than the Shannon diversity index (Magurran 2004; Roberts and Connell 2008). Species are ranked according to their classification in Fishbase (www.fishbase.org). Taxonomic indices are estimated from the log(x+1) transformed catches to reduce the weighting of the dominant species (Clarke and Warwick 1998).
Trophic categories
Recorded fish species (Table 1) were assigned to trophic categories adapted from an earlier classification system devised by Paugy and Leveque (1999). These authors identified three major trophic categories: (i) mainly primary consumers (PC) which are herbivorous or predominantly phytoplanktivorous, microphytophagous, detritivorous or grazer species; (ii) mainly secondary consumers (SC) which are predominantly zoobenthivorous (molluscs, annelids), first-level predators or first-level generalists (crustaceans, insects), or predominantly zooplanktivorous species; and (iii) terminal predators (TP) which are second-trophic-level generalist predators (fish and other prey) or predominantly piscivorous species.
Size structure
Indicators derived from various fish size spectra, namely average size, modal class, proportions of large (>50 cm) and small (<10 cm) individuals, mean maximum observed length, and slope and intercept of the size distributions, were used to detect the possible effects of salinity on these various population parameters. The mean maximum observed length was calculated from
the maximum observed sizes for each species and each size class was represented by the median value of the size class. Logarithmic transformation was applied to number of individuals,
y variable, in each size class, x variable, in order to normalise fish size distributions. Linear
regression was performed on the size classes larger than or equal to (≥) the first modal size class. In principle, an increase in disturbances as the salinity should result in a steeper slope and a higher intercept upstream of the location where the abundance of large individuals is expected to decrease - as they should be more sensitive to the forcing factor as hypersalinity - and where the abundance of smaller individuals is expected to increase (Rice and Gislason 1996; Gislason and Rice 1998).
Trophic level
Information on the trophic level of each species (TLi) was obtained from the Fishbase metabase (www.fishbase.org). The mean trophic level of the catches (TLm) was estimated by weighting the TLi using the mass of each species according to the formula:
1 TL S i= m i = Y
i i Y ( TL )where Yi is the yield for the species i; TLi is mean trophic level of species i and S is the total number of species.
Statistical analyses
The differences observed between samples were compared using statistical tests with a significance level α = 0.05 (Scherrer 1984). The Kruskal-Wallis test for independent samples was used to compare the mean sizes and average maximum sizes observed between villages from the surveyed sizes. An analysis of covariance (ANCOVA) was applied to the log(x+1) transformed numbers of individuals according to size class to test the slopes and intercepts between the villages. Catch per unit effort (CPUE) data were analysed based on the three most representative gears for the sampled villages, namely castnet, small-mesh gillnets (<30 mm) and medium-mesh gillnets (30–50 mm). CPUE values, according to gear, were compared between the villages using the Kruskal-Wallis test followed by a pairwise test using Holm’s method for p-value adjustment.
Results
Taxonomic diversity according to trophic categories
The most dominant species (based on catch mass) in the Casamance Estuary were primary consumers Sarotherodon melanotheron (71.4%), Ethmalosa fimbriata (12.6%) and Tilapia
guineensis (10.0%). These species also dominated catches in the upstream region of the
estuary, with S. melanotheron (83.6%), T. guineensis (10.7%) and E. fimbriata (3.7%) making up 98% of the fish mass harvested in this area. By contrast, certain species such as Arius
latiscutatus, Arius parkii, Caranx hippos, Cynoglossus senegalensis, Dasyatis margarita and Trichiurus lepturus, all of which are terminal predators or secondary consumers, are very scarce
and comprise <1% of the total catch.
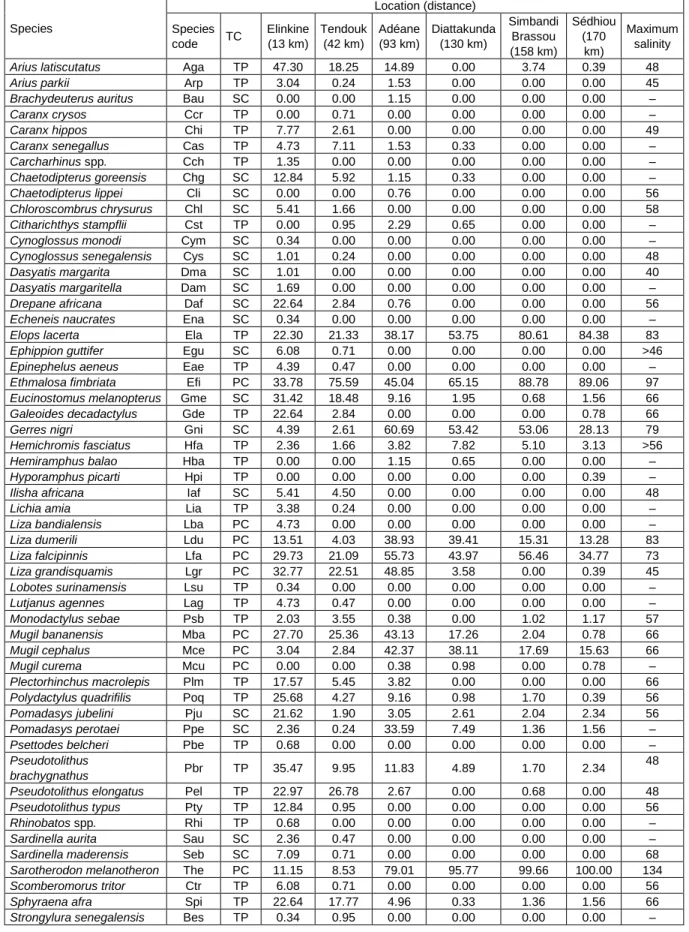
The within-trophic-group taxonomic diversity showed that the primary consumer category was least impacted by the hypersalinisation of the Casamance Estuary (Table 2). Indeed, this category had higher taxonomic diversity indices in the upper reaches than in the lower reaches of the estuary. The diversity indices at 13 km were ∆ = 2.85 and ∆* = 3.08 and at 170 km were ∆ = 3.17 and ∆* = 3.64. The pattern of variation of the diversity indices was less clear for the secondary consumers. In this category, the least diversified catches (∆ = 2.65) were landed 130 km from the mouth. The catches of the terminal consumers were more diversified downstream, with ∆ = 3.52 at 13 km, which was greater than upstream, where ∆ = 3.05 at 158 km and 170 km.
Size structure
The distributions of the size spectra differed significantly in the surveyed localities (Kruskal-Wallis test, p < 0.05). The widest size spectrum was observed in the catches 13 km from the mouth, with a modal class of approximately 19–20 cm, 2.8% individuals with a size >50 cm and almost 0% small individuals (Table 3). In other localities, the size spectra were narrower, with a significant proportion of small individuals and lower modal classes: 11–12 cm at 93 km and 158 km, 7–8 cm at 130 km and 9–10 cm at 170 km from the mouth.
The mean sizes of the fish decreased from Elinkine (13 km from the mouth; 22.9 ± 16.4 cm SD, to Diattakunda 130 km from the mouth; 12.2 ± 9.5 cm; Table 3). The mean sizes showed a slight increase in Simbandi Brassou (16.2 ± 9.9 cm) and Sédhiou (14.7 ± 7.3 cm), situated at 158 km and 170 km from the mouth, respectively. All the differences in the mean landed sizes between
the villages were significant (p < 0.05).
The mean maximum observed length (MOL) was 50.4 cm, at 13 km from the river mouth. The MOL showed a decreasing profile upstream of the estuary, declining by 19.1% at 42 km, 36.5% at 158 km and 50% at 170 km from the mouth. The MOL was similar at 93 km and 158 km. However, the MOL was significantly different between the villages surveyed.
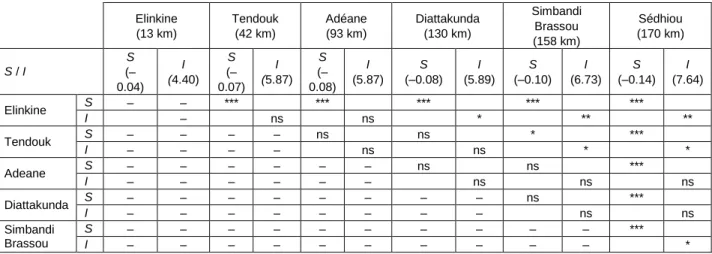
The linear models (Table 4) fitted from the size distributions of the total catches in the villages showed that the slopes were steeper upstream than downstream (ANCOVA, p < 0.05). The intercept values of the size distributions were higher upstream than downstream.
Trophic level (TL)
The mean trophic level estimated from the total catch in the Casamance Estuary was 2.16. The mean trophic level for catches by location was 3.17 at 13 km, 2.39 at 42 km, and 2.07 at 93 km from the mouth (Figure 3). The mean trophic levels of the catches landed at 158 km and 170 km were very similar, at 2.15 and 2.12, respectively.
Catch per unit effort (CPUE)
The catch per unit effort data showed that the average yield per trip was mostly higher upstream (Figure 4). The highest fishing yields were recorded at 158 km and 170 km from the mouth. Differences in fishing yields were significant for the same gear between villages (Kruskal-Wallis test, p < 0.05). However, CPUE for each category of fishing gear presented in Figure 4 was not significantly different between Elinkine, Tendouk and Adéane (pairwise test, p > 0.05). For castnet catches, CPUE was different between Sédhiou and Elinkine, Tendouk and Diattakunda, whereas CPUE for catches in drift gillnets with medium mesh in each of Elinkine, Adéane and Diattakunda was significantly different from that recorded at Sédhiou. The CPUE in drift gillnets with small mesh in the three most downstream villages, Elinkine, Tendouk and Adéane, differed significantly from those in Simbandi Brassou and Sédhiou in the upstream part of the estuary (pairwise test, p < 0.05).
Discussion
In the Casamance Estuary, the most diverse upstream catch category comprised primary consumers dominated by S. melanotheron (83.6%), T. guineensis (10.7%) and E. fimbriata
(3.7%). These three species have a wide distribution in hypersaline environments where they occur in areas with salinity values reaching or exceeding 134, 80 and 97, respectively (Albaret 1987; Panfili et al. 2006). By contrast, species such as A. latiscutatus, A. parkii, C. hippos, C.
senegalensis, D. margarita and T. lepturus have relatively limited distributions and become rare
in the estuaries when the salinity exceeds 48 to 50 (Panfili et. al. 2006). The abundance of tilapia in the upper Casamance Estuary was also highlighted by Albaret (1987) and is comparable to the dominance of the cichlid Oreochromis mossambicus in Lake St Lucia (South Africa) when this system experienced hypersaline conditions (Whitfield et al. 2006). The same observation was made in Sine Saloum Estuary (Senegal) where S. melanotheron dominates the fish assemblage in the upstream area where the salinity sometimes reaches 110 (Baran 2000).
The upstream increase in diversity of primary consumers can be explained not only by their tolerance of hypersalinity but also by high food availability due to high primary production in the upstream area. In fact, phytoplankton biomass greatly increases from downstream to upstream, increasing from 2–10 μg l-1 in the middle and downstream areas to 50 μg l-1 in the upstream area
of the Casamance Estuary (Pagès 1994). This important productivity can be explained by low rainfall and insufficient inputs of fresh water to repel the entry of seawater downstream and counter the phenomenon of evaporation responsible for the noted hypersalinity. The normal water flow from the upstream portion to the downstream portion is no longer ensured, as evidenced by the reverse salinity gradient in the estuary. A causal relationship between the residence time of water and high primary production in estuaries was established by Lane et al. (2007).
Size structure
The fish size spectrum from the landings in the Casamance Estuary showed a significant decline, from downstream to upstream, in the number of individuals from the large classes. This decline in large fish >24 cm in the catches was most prevalent in the areas adjacent to the four most upstream villages, resulting in a significant decrease in the mean size and mean landed MOL. These large individuals appear to be more sensitive to the degradation of environmental conditions, especially salinisation, which limits their penetration into the upstream part of the Casamance Estuary. This size distribution according to salinity is consistent with the observations of Panfili et al. (2004, 2006) in the Sine Saloum and Gambia estuaries, where smaller individuals have higher occurrences in high salinity areas. Hence, the structure of the exploited fish populations in Casamance Estuary results in a steeper slope in the size spectrum
at the upstream locations.
Analysing the size structure of the fish populations in the Sine Saloum Estuary, Ecoutin et al. (2010) observed a steeper slope and higher intercept at the end of a 10-year period, reflecting deterioration in the environmental conditions during those 10 years due to both hypersalinity and fishing pressure. The results of our study are also consistent with the results of other studies, based on detection of the impacts of fishing pressure as a structuring factor of the size spectra of fish communities (Rice and Gislason 1996; Enin et al. 2004; Ault et al. 2005).
In addition to the limited number of large individuals in the upstream region of the Casamance Estuary due to their greater vulnerability to forcing factor as hypersalinity (Jennings et al. 1998), the decline in average sizes along the salinity gradient might also be linked to physiological demands. Under hypersaline conditions, the amount of energy required to osmoregulate becomes increasingly important and comes at the expense of growth (Boeuf and Payan 2001). This results in a decline in the physical growth rate of fish that are adapted to adverse environmental conditions. Thus, in the case of juvenile E. fimbriata from the Casamance Estuary, Labonne et al. (2009) showed that the growth rate of this species was lower in hypersaline areas. A similar result was obtained by Alava (1998) who demonstrated experimentally that the growth of milkfish Chanos chanos decreases with increasing salinity. This adaptive response appeared to be more important upstream than downstream in the Casamance Estuary, due to a more challenging environment in the former region, and could partly explain the lower mean sizes landed in the upstream villages.
Trophic level dynamics
The mean trophic level of fish catches were lower in the Casamance villages located in the middle and upstream area of the estuary than those located in the downstream area. This decrease in the mean trophic level suggests that apex predators are rare in the former two areas, and that landings in the middle and upstream regions of the estuary essentially comprised primary consumers. The increase in the diversity of this trophic category upstream shows that these species are better adapted to the environmental conditions than other species. In this trophic category, S. melanotheron (TL = 2.0) and T. guineensis (TL = 2.8) were typical of the population exploited in the upstream area and were responsible for much of the mean trophic level of catches in that area. In contrast, the mean trophic level downstream at Elinkine was elevated due to the increased abundance of fish species such as A. latiscutatus (TL = 3.3), P.
quadrifilis (TL = 4.0), and S. afra (TL = 4.1). These three species represented 54.7% (by mass)
of the total catch landed in this village (Kantoussan et al. 2012).
In the Casamance Estuary, three mostly herbivorous species, namely S. melanotheron, T.
guineensis and E. fimbriata (TL = 2.5), dominated the total catch mass. The consequence of the
overwhelming dominance of these species in the ecosystem is an overall decreasing of mean trophic level in landed catches (TL = 2.16). Fish species composition in the Casamance Estuary was different from that of the West African Gambia Estuary which was not affected by strong environmental change and human disturbance (Simier et al. 2006). Indeed in the Gambia Estuary, cichlids are very poorly represented in the fish assemblage. Sarotherodon
melanotheron, which represented 83.6% of the total landed biomass in the Casamance Estuary,
was ranked 26th in the upstream portion of the Gambia Estuary, and constituted 0.05% of total fish biomass. In that estuary, fish species such as Pseudotolithus elongatus, E. fimbriata, Ilisha
africana and Sardinella maderensis were abundant and were distributed over a large part of the
estuary from upstream to downstream in the dry season from November to May (Albaret et al. 2004). This result was consistent with the observation made by Baran (2000) that the clupeids E.
fimbriata and S. maderensis were the dominant species in the Gambia Estuary.
Catch per unit effort (CPUE)
In the Casamance Estuary the CPUE of fish was generally higher upstream than downstream, which might be a consequence of several factors. Firstly, mangroves are more abundant in the downstream section of the estuary, which makes fishing conditions more difficult for some gear types. Secondly, higher primary production has been recorded upstream in the estuary compared to downstream (Debenay et al. 1989; Pagès 1994). Finally, the abundance of species with a short biological cycle (e.g. S. Melanotheron, Pauly 1976; Lowe-McConnell 1982; Legendre and Ecoutin 1996) and whose biomass can quickly be renewed, is higher upstream.
Senegal has been marked by drought and a decrease in coastal river flows since the early 1960s. This decline in freshwater input has resulted in the emergence of hypersaline ‘inverse’ estuaries due to the salinity increase in upstream areas, as observed in the Sine Saloum (Pagès and Citeau 1990; Gueye et al. 2013) and Casamance systems (Thiam and Singh 2002). In parallel with the physicochemical changes recorded in the Casamance Estuary, primary production per biomass unit in the upstream area increased when compared to middle and downstream areas (Pagès 1994). High primary production upstream is due, in large part, to
increased water residence time in this portion of the estuary. Tidal exchange with the sea becomes increasingly weak upstream and, at the same time, riverine flow was significantly reduced due to the drought and the construction of the Maka Dam (Albaret 1987; Ndour et al. 2011). These conditions favoured the emergence of a relatively stagnant body of water in the upper reaches that was subject to high net evaporation rates and increasing salinity.
Fish population diversity appears to have been strongly affected by the above changes, with only highly euryhaline species capable of surviving in the hypersaline areas (Kantoussan et al. 2012). Thus a small number of euryhaline species, mostly species with high productivity, herbivore and detritivorous feeding behaviours, has increased in abundance due to the high primary productivity of this environment. In addition, reduced predation due to the decline in abundance of secondary consumers and piscivorous predators supports the high fish production in the upstream area of the estuary.
Conclusion
Ultimately, an extended period of climate change, marked by a significant reduction in freshwater inflows from the Casamance River, has strongly impacted the overall functioning of the estuarine environment. The effects on fish populations are reflected in the loss of biodiversity, a decrease in fish size structures, and changes in the trophic dynamics associated with declines in mean trophic level. The paradoxical increase in upstream CPUE is a consequence of the development of a fish population dominated by mainly euryhaline species with a short life cycle and high secondary productivity. The indices used in this study have been shown to be relevant as a tool for assessing environmental condition and have also shown that commercial fisheries data collected in a scientific manner can offer an opportunity for the monitoring of aquatic ecosystems.
Acknowledgements — This postdoctoral study was financially supported by AUF (Agence Universitaire de
la Francophonie). The first author is grateful to the LEMAR and IRD teams for their laboratory support during the study. The authors also thank the anonymous reviewers for their very useful and constructive comments.
References
Adams SM. 2002. Biological indicators of aquatic ecosystem stress. Bethesda, MD: American Fisheries Society.
Alava VR. 1998. Effect of salinity, dietary lipid source and level on growth of milkfish Chanos chanos fry.
Aquaculture 167: 229–236.
Albaret JJ. 1987. Les peuplements de poissons de la Casamance (Sénégal) en période de sécheresse.
Revue d’Hydrobiologie Tropicale 20: 291–310.
Albaret JJ, Simier M, Darboe FS, Ecoutin JM, Raffray J, Tito de Morais L. 2004. Fish diversity and distribution in the Gambia Estuary, West Africa, in relation to environmental variables. Aquatic
Living Resources 17: 35–46.
Ault JS, Smith SG, Bohnsack JA. 2005. Evaluation of average length as an estimator of exploitation status for the Florida coral-reef fish community. ICES Journal of Marine Science 62: 417–423.
Baran E. 2000. Biodiversity of estuarine fish faunas in West Africa. Naga, The ICLARM Quarterly 23(4): 4–9.
Binet D, Le Reste L, Diouf PS. 1995. The influence of runoff and fluvial outflow on the ecosystems and living resources of West African coastal waters. In: Effects of riverine inputs on coastal ecosystems and fisheries resources. FAO Fisheries Technical Paper No. 349. Rome: Food and Agriculture Organisation. pp 89–118.
Blaber SJM. 1997. Fish and fisheries of tropical estuaries. London, New York: Chapman & Hall.
Blaber SJM. 2013. Fishes and fisheries in tropical estuaries: the last 10 years. Estuarine, Coastal and
Shelf Science 135: 57–65.
Boeuf G, Payan P. 2001. How should salinity influence fish growth? Comparative Biochemistry and
Physiology Part C 130: 411–423.
Borja A, Ranasinghe A, Weisberg SB. 2009. Assessing ecological integrity in marine waters, using multiple indices and ecosystem components: challenges for the future. Marine Pollution Bulletin 59: 1–4.
Cardoso I, França S, Pais MP, Henriques S, da Fonseca LC, Cabral HN. 2011. Fish assemblages of small estuaries of the Portuguese coast: a functional approach. Estuarine, Coastal and Shelf Science 93: 40–46.
Carney J, Gillespie TW, Rosomoff R. 2014. Assessing forest change in a priority West African mangrove ecosystem: 1986–2010. Geoforum 53: 126–135.
Champalbert G, Pagano M, Sene P, Corbin D. 2007. Relationships between meso- and macro-zooplankton communities and hydrology in the Senegal River Estuary. Estuarine, Coastal and
Shelf Science 74: 381–394.
Clarke KR, Warwick RM. 1998. A taxonomic distinctness index and its statistical properties. Journal of
Applied Ecology 35: 523–531.
Coll M, Shannon LJ, Kleisner KM, Juan-Jordá MJ, Bundy A, Akoglu AG et al. 2016. Ecological indicators to capture the effects of fishing on biodiversity and conservation status of marine ecosystems.
Ecological Indicators 60: 947–962.
Conchedda G, Durieux L, Mayaux P. 2008. An object-based method for mapping and change analysis in mangrove ecosystems. ISPRS Journal of Photogrammetry and Remote Sensing 63: 578–589. Conchedda G, Lambin EF, Mayaux P. 2011. Between land and sea: livelihoods and environmental
changes in mangrove ecosystems of Senegal. Annals of the Association of American
Geographers 101: 1259–1284.
Dauvin JC. 2007. Paradox of estuarine quality: benthic indicators and indices, consensus or debate for the future. Marine Pollution Bulletin 55: 271–281.
Debenay JP, Pagès J, Diouf PS. 1989. Ecological zonation of the hyperhaline estuary of the Casamance River (Senegal): Foramanifera, zooplankton and abiotic variables. Hydrobiologia 174: 161–176. Deegan LA, Finn JT, Ayvazian SG, Ryder-Kieffer CA, Buonaccorsi J. 1997. Development and validation of
an estuarine biotic integrity index. Estuaries 20: 601–617.
Ecoutin JM, Simier M, Albaret JJ, Laë R, Tito de Morais L. 2010. Changes over a decade in fish assemblages exposed to both environmental and fishing constraints in the Sine Saloum estuary (Senegal). Estuarine, Coastal and Shelf Science 87: 284–292.
Elliott M, Quintino V. 2007. The estuarine quality paradox, environmental homeostasis and the difficulty of detecting anthropogenic stress in naturally stressed areas. Marine Pollution Bulletin 54: 640–645. Elliott M, Whitfield AK. 2011. Challenging paradigms in estuarine ecology and management. Estuarine,
Coastal and Shelf Science 94: 306–314.
Enin UI, Gröger J, Hammer C. 2004. Species and length composition of fish in the south-western Baltic Sea. Journal of Applied Ichthyology 20: 369–375.
Gislason H, Rice J. 1998. Modelling the response of size and diversity spectra of fish assemblages to changes in exploitation. ICES Journal of Marine Science 55: 362–370.
Gueye M, Kantoussan J, Tine M. 2013. The impact of environmental degradation on reproduction of the black-chinned tilapia Sarotherodon melanotheron from various coastal marine, estuarine and freshwater habitats. Comptes Rendus Biologies 336: 342–353.
Gueye M, Tine M, Kantoussan J, Ndiaye P, Thiaw OT, Albaret JJ. 2012. Comparative analysis of reproductive traits in black-chinned tilapia females from various coastal marine, estuarine and freshwater ecosystems. PLoS ONE 7: e29464.
Hallett CS, Valesini FJ, Clarke KR, Hesp SA, Hoeksema SD. 2012. Development and validation of fish-based, multimetric indices for assessing the ecological health of Western Australian estuaries.
Estuarine, Coastal and Shelf Science 104–105: 102–113.
Harrison TD, Kelly FL. 2013. Development of an estuarine multi-metric fish index and its application to Irish transitional waters. Ecological Indicators 34: 494–506.
Harrison TD, Whitfield AK. 2004. A multi-metric fish index to assess the environmental condition of estuaries. Journal of Fish Biology 65: 683–710.
Harrison TD, Whitfield AK. 2006. Temperature and salinity as primary determinants influencing the biogeography of fishes in South African estuaries. Estuarine, Coastal and Shelf Science 66: 335– 345.
Jennings S, Greenstreet SPR, Hill L, Piet GJ, Pinnegar JK, Warr KJ. 2002. Long-term trends in the trophic structure of the North Sea fish community: evidence from stable-isotope analysis, size-spectra and community metrics. Marine Biology 141: 1085–1097.
Jennings S, Reynolds JD, Mills SC. 1998. Life history correlates of responses to fisheries exploitation.
Proceedings of Royal Society B: Biological Sciences 265: 333–339.
Kantoussan J, Ecoutin JM, Simier M, Tito de Morais L, Laë R. 2012. Effects of salinity on fish assemblage structure: evaluation based on taxonomic and functional approaches in Casamance estuary (Senegal, West Africa). Estuarine, Coastal and Shelf Science 113: 152–162.
Kantoussan J, Ecoutin JM, Simier M, Fontenelle G, Thiaw OT, Laë R. 2007. The relevance of species-based indicators as a tool for evaluating the structures of exploited fish assemblages: a comparative study of two tropical lakes (Mali), West Africa. Lakes and Reservoirs: Research and
Management 12: 135–148.
Labonne M, Morize E, Scolan P, Laë R, Dabas E, Bohn M. 2009. Impact of salinity on early life history traits of three estuarine fish species in Senegal. Estuarine, Coastal and Shelf Science 82: 673– 681.
Laë R, Ecoutin JM, Kantoussan J. 2004. The use of biological indicators for monitoring fisheries exploitation: application to man-made reservoirs in Mali. Aquatic Living Resources 17: 95–105. Lane RR, Day JW, Marx BD, Reyes E, Hyfield E, Day JN. 2007. The effects of riverine discharge on
temperature, salinity, suspended sediment and chlorophyll a in a Mississippi delta estuary measured using a flow-through system. Estuarine, Coastal and Shelf Science 74: 145–154. Legendre M, Ecoutin JM. 1996. Aspects of the reproductive strategy of Sarotherodon melanotheron:
comparison between a natural population (Ebrié Lagoon, Côte d’Ivoire) and different cultured populations. In: Pullin RSV, Lazard J, Legendre M, Amon Kothias JB, Pauly D. eds. Proceeding of the 3rd international symposium on tilapia in aquaculture ICLARM, Manila, 320--325p.
Lowe-McConnell RH. 1982. Tilapias in fish communities. In: Pullin RSV, Lowe-McConnell RH. eds. The biology and culture of tilapias, ICLARM, Manila, 83--113p.
Magurran AE. 2004. Measuring biological diversity. Malden (USA): Wiley-Blackwell. 260 pp.
Marius C. 1985. Mangroves du Sénégal et de la Gambie: écologie pédologie géochimie mise en valeur et aménagement. Thèse de Doctorat l’Université Louis Pasteur, ORSTOM: Collection Travaux et Documents, France.
Mikhailov VN, Isupova MV. 2008. Hypersalinization of river estuaries in West Africa. Water Resources 35: 367–385.
Miranda JR, Mouillot D, Hernandez DF, Sosa-Lopez A, Do Chi T, Perez PA. 2005. Changes in four complementary facets of fish diversity in a tropical coastal lagoon after 18 years: a functional interpretation. Marine Ecology Progress Series 304: 1–13.
Ndour I, Le Loc’h F, Thiaw OT, Ecoutin JM, Laë R, Raffray J et al. 2011. Etude du régime alimentaire de deux espèces de Cichlidae en situation contrastée dans un estuaire tropical inverse d’Afrique de l’Ouest (Casamance, Sénégal). Journal des Sciences Halieutiques et Aquatiques 4: 120–133. Pagès J. 1986. L’environnement d’un estuaire hyperhalin tropical: la Casamance. In: Etudes des estuaires
et lagunes du Sénégal: Casamance et Joal-Fadiouth. Rapport final. ORSTOM (Paris, France): UNESCO-EPEEC. Available at http://horizon.documentation.ird.fr/exl-doc/pleins_textes/pleins_textes_5/b_fdi_20-21/26628.pdf [date accessed: 29 May 2017].
Pagès J. 1994. Phytoplanktonic biomass and production in a tropical hypersaline estuary, the Casamance (Senegal, West Africa). Trends in Hydrology 1: 299–327.
Pagès J, Citeau J. 1990. Rainfall and salinity of a sahelian estuary between 1927 and 1987. Journal of
Hydrology 113: 325–341.
Pagès J, Debenay JP, Lebrusq JY. 1987. L’environnement estuarien de la Casamance. Revue
Hydrobiologique Tropicale 20: 191–202.
Panfili J, Mbow A, Durand JD, Guinand B, Diop K, Kantoussan J et al. 2004. Influence of salinity on life history traits of the bonga shad Ethmalosa fimbriata (Pisces, Clupeidae): comparison between the Gambia and Saloum estuaries. Marine Ecology Progress Series 270: 241–257.
Panfili J, Thior D, Ecoutin JM, Ndiaye P, Albaret JJ. 2006. Influence of salinity on the size at maturity for fish species reproducing in contrasting West African estuaries. Journal of Fish Biology 69: 95– 113.
Paugy D, Lévêque C. 1999. Régimes alimentaires et réseaux trophiques. In: Lévêque C, Paugy D (eds)
Les poissons des eaux continentales africaines: diversité, écologie, utilisation par l'homme. Paris,
France: IRD. pp 167–190.
African lagoon. Aquaculture 7:33--49.
Pérez-Ruzafa A, Marcos C. 2012. Fisheries in coastal lagoons: an assumed but poorly researched aspect of the ecology and functioning of coastal lagoons. Estuarine, Coastal and Shelf Science 110: 15– 31.
Rice J, Gislason H. 1996. Patterns of change in the size spectra of numbers and diversity of the North Sea fish assemblage, as reflected in surveys and models. ICES Journal of Marine Science 53: 1214– 1225.
Roberts BK, Connell SD. 2008. Detecting benthic responses to human-induced change: effectiveness of alternate taxonomic classification and indices. Marine Ecology Progress Series 358: 75–84. Rochet MJ, Trenkel VM, Bellail R, Coppin F, Le Pape O, Mahé JC et al. 2005. Combining indicator trends
to assess ongoing changes in exploited fish communities: diagnostic of communities off the coasts of France. ICES Journal of Marine Science 62: 1647–1664.
Saintilan N, Wen L. 2012. Environmental predictors of estuarine fish landings along a temperate coastline.
Estuarine, Coastal and Shelf Science 113: 221–230.
Sambou H, Sambou B, Diaw AT, Mbow C, Traore VB. 2014. Remote sensing mapping of the rice field and vegetal cover and the impacts of soil factors on herbaceous in the sub-watershed of Boutolate (lower Casamance, Senegal). American Journal of Environmental Protection 3: 73–82.
Saos JL, Le Bouteiller C, Diop ES. 1987. Aspect géologique et géomorphologique de la Casamance.
Revue Hydrobiologique Tropicale 20: 219–232.
Savenije HHG, Pagès J. 1992. Hypersalinity: a dramatic change in the hydrology of Sahelian estuaries.
Journal of Hydrology 135: 157–174.
Scheren PA, Ibe AC, Janssen FJ, Lemmens AM. 2002. Environmental pollution in the Gulf of Guinea - a regional approach. Marine Pollution Bulletin 44: 633–641.
Scherrer B. 1984. Biostatistique. Paris: Gaëtan-Morin Montréal.
Simier M, Blanc L, Aliaume C, Diouf PS, Albaret JJ. 2004. Spatial and temporal structure of fish assemblages in an “inverse estuary”, the Sine Saloum system (Senegal). Estuarine, Coastal and
Simier M, Laurent C, Ecoutin JM, Albaret JJ. 2006. The Gambia River estuary: a reference point for estuarine fish assemblages studies in West Africa. Estuarine, Coastal and Shelf Science 69: 615– 628.
Sosa-López A, Mouillot D, Ramos-Miranda J, Flores-Hernandez D, Do Chi T. 2007. Fish species richness decreases with salinity in tropical coastal lagoons. Journal of Biogeography 34: 52–61.
Thiam EI, Singh VP. 2002. Space-time-frequency analysis of rainfall, runoff and temperature in the Casamance River basin, southern Senegal, West Africa. Water SA 28: 259–270.
Walsh CT, Reinfelds IV, Ives MC, Gray CA, West RJ, van der Meulen DE. 2013. Environmental influences on the spatial ecology and spawning behaviour of an estuarine-resident fish, Macquaria
colonorum. Estuarine, Coastal and Shelf Science 118: 60–71.
Warwick RM, Clarke KR. 1995. New 'biodiversity' measures reveal a decrease in taxonomic distinctness with increasing stress. Marine Ecology Progress Series 129: 301–305.
Wasserman RJ, Strydom NA. 2011. The importance of estuary head waters as nursery areas for young estuary- and marine-spawned fishes in temperate South Africa. Estuarine, Coastal and Shelf
Science 94: 56–67.
Whitfield AK, Elliott M, Basset A, Blaber SJM, West RJ. 2012. Paradigms in estuarine ecology – a review of the Remane diagram with a suggested revised model for estuaries. Estuarine, Coastal and
Shelf Science 97: 78–90.
Whitfield AK, Taylor RH, Fox C, Cyrus DP. 2006. Fishes and salinities in the St Lucia estuarine system – a review. Reviews in Fish Biology and Fisheries 16: 1–20.
Figure
Figure 1: Geographic location of the Casamance system and the sampled villages (open circle = regional capital and meteorological station; black squares = sampled villages)
Figure 2: (a) Average annual rainfall by decade from the meteorological station at Ziguinchor. (b) Mean monthly salinity at the six sampled villages in the Casamance Estuary (Elk = Elinkine; Tdk = Tendouk; Adn = Adéane; Dkd = Diattakunda; Sbd = Simbandi Brassou; Sdh = Sédhiou). The distance in km of each village from the estuary mouth is shown in parentheses (modified from Kantoussan et al. 2012)
Figure 3: Monthly variation of the mean trophic level (TLm) at the sampled sites in the Casamance
Figure 4: Variation of CPUE at the sampled sites by fishing gear category in the Casamance Estuary (CastN = castnet; GillDs = drift gillnet with small mesh; GillDm = drift gillnet with medium mesh; for x-axis codes see Figure 2)
0 20 40 60 80 100 120 Elk (13) Tdk (42) Adn (93) Dkd (130) Sbd (158) Sdh (170) C P U E ( k g t ri p -1) Sampled villages CastN GillDs GillDm
Table 1: List and occurrence (%) of fish species identified in the Casamance Estuary, TC = trophic category, PC = primary
consumer, SC = secondary consumer, TP = terminal predator. The distance from the estuary mouth (km) is shown and the maximum salinity in which species occurred is provided by Albaret (1987) and Panfili et al. (2006)
Species Location (distance) Species code TC Elinkine (13 km) Tendouk (42 km) Adéane (93 km) Diattakunda (130 km) Simbandi Brassou (158 km) Sédhiou (170 km) Maximum salinity
Arius latiscutatus Aga TP 47.30 18.25 14.89 0.00 3.74 0.39 48
Arius parkii Arp TP 3.04 0.24 1.53 0.00 0.00 0.00 45
Brachydeuterus auritus Bau SC 0.00 0.00 1.15 0.00 0.00 0.00 –
Caranx crysos Ccr TP 0.00 0.71 0.00 0.00 0.00 0.00 –
Caranx hippos Chi TP 7.77 2.61 0.00 0.00 0.00 0.00 49
Caranx senegallus Cas TP 4.73 7.11 1.53 0.33 0.00 0.00 –
Carcharhinus spp. Cch TP 1.35 0.00 0.00 0.00 0.00 0.00 –
Chaetodipterus goreensis Chg SC 12.84 5.92 1.15 0.33 0.00 0.00 –
Chaetodipterus lippei Cli SC 0.00 0.00 0.76 0.00 0.00 0.00 56
Chloroscombrus chrysurus Chl SC 5.41 1.66 0.00 0.00 0.00 0.00 58
Citharichthys stampflii Cst TP 0.00 0.95 2.29 0.65 0.00 0.00 –
Cynoglossus monodi Cym SC 0.34 0.00 0.00 0.00 0.00 0.00 –
Cynoglossus senegalensis Cys SC 1.01 0.24 0.00 0.00 0.00 0.00 48
Dasyatis margarita Dma SC 1.01 0.00 0.00 0.00 0.00 0.00 40
Dasyatis margaritella Dam SC 1.69 0.00 0.00 0.00 0.00 0.00 –
Drepane africana Daf SC 22.64 2.84 0.76 0.00 0.00 0.00 56
Echeneis naucrates Ena SC 0.34 0.00 0.00 0.00 0.00 0.00 –
Elops lacerta Ela TP 22.30 21.33 38.17 53.75 80.61 84.38 83
Ephippion guttifer Egu SC 6.08 0.71 0.00 0.00 0.00 0.00 >46
Epinephelus aeneus Eae TP 4.39 0.47 0.00 0.00 0.00 0.00 –
Ethmalosa fimbriata Efi PC 33.78 75.59 45.04 65.15 88.78 89.06 97
Eucinostomus melanopterus Gme SC 31.42 18.48 9.16 1.95 0.68 1.56 66
Galeoides decadactylus Gde TP 22.64 2.84 0.00 0.00 0.00 0.78 66
Gerres nigri Gni SC 4.39 2.61 60.69 53.42 53.06 28.13 79
Hemichromis fasciatus Hfa TP 2.36 1.66 3.82 7.82 5.10 3.13 >56
Hemiramphus balao Hba TP 0.00 0.00 1.15 0.65 0.00 0.00 –
Hyporamphus picarti Hpi TP 0.00 0.00 0.00 0.00 0.00 0.39 –
Ilisha africana Iaf SC 5.41 4.50 0.00 0.00 0.00 0.00 48
Lichia amia Lia TP 3.38 0.24 0.00 0.00 0.00 0.00 –
Liza bandialensis Lba PC 4.73 0.00 0.00 0.00 0.00 0.00 –
Liza dumerili Ldu PC 13.51 4.03 38.93 39.41 15.31 13.28 83
Liza falcipinnis Lfa PC 29.73 21.09 55.73 43.97 56.46 34.77 73
Liza grandisquamis Lgr PC 32.77 22.51 48.85 3.58 0.00 0.39 45
Lobotes surinamensis Lsu TP 0.34 0.00 0.00 0.00 0.00 0.00 –
Lutjanus agennes Lag TP 4.73 0.47 0.00 0.00 0.00 0.00 –
Monodactylus sebae Psb TP 2.03 3.55 0.38 0.00 1.02 1.17 57
Mugil bananensis Mba PC 27.70 25.36 43.13 17.26 2.04 0.78 66
Mugil cephalus Mce PC 3.04 2.84 42.37 38.11 17.69 15.63 66
Mugil curema Mcu PC 0.00 0.00 0.38 0.98 0.00 0.78 –
Plectorhinchus macrolepis Plm TP 17.57 5.45 3.82 0.00 0.00 0.00 66
Polydactylus quadrifilis Poq TP 25.68 4.27 9.16 0.98 1.70 0.39 56
Pomadasys jubelini Pju SC 21.62 1.90 3.05 2.61 2.04 2.34 56
Pomadasys perotaei Ppe SC 2.36 0.24 33.59 7.49 1.36 1.56 –
Psettodes belcheri Pbe TP 0.68 0.00 0.00 0.00 0.00 0.00 –
Pseudotolithus
brachygnathus Pbr TP 35.47 9.95 11.83 4.89 1.70 2.34
48
Pseudotolithus elongatus Pel TP 22.97 26.78 2.67 0.00 0.68 0.00 48
Pseudotolithus typus Pty TP 12.84 0.95 0.00 0.00 0.00 0.00 56
Rhinobatos spp. Rhi TP 0.68 0.00 0.00 0.00 0.00 0.00 –
Sardinella aurita Sau SC 2.36 0.47 0.00 0.00 0.00 0.00 –
Sardinella maderensis Seb SC 7.09 0.71 0.00 0.00 0.00 0.00 68
Sarotherodon melanotheron The PC 11.15 8.53 79.01 95.77 99.66 100.00 134
Scomberomorus tritor Ctr TP 6.08 0.71 0.00 0.00 0.00 0.00 56
Sphyraena afra Spi TP 22.64 17.77 4.96 0.33 1.36 1.56 66
Synaptura lusitanica Slu SC 0.00 0.00 1.15 5.54 5.44 8.59 –
Tilapia guineensis Tgu PC 10.81 7.35 67.56 81.76 99.32 100.00 >80
Trachinotus teraia Tfa SC 3.38 4.98 14.12 14.01 22.45 19.53 58
Trichiurus lepturus Tle TP 4.73 0.47 0.00 0.00 0.00 0.00 42
Tylosurus crocodilus Tcr TP 0.00 0.00 0.38 0.00 0.00 0.00 –
Total number of the
landings 296 422 262 307 294 256
Table 2: Species richness, index of diversity () and taxonomical distance (*) by trophic category (TC) in the Casamance Estuary. D = distance from the mouth. For TC codes see Table 1
Location Elinkine Tendouk Adéane Diattakunda Simbandi
Brassou Sédhiou TC D (km) 13 42 93 130 158 170 PC Species count 9 8 9 9 7 9 2.85 2.90 2.90 2.88 3.00 3.17 * 3.08 3.22 3.20 3.18 3.50 3.64 SC Species count 17 13 10 7 6 6 3.76 3.27 2.69 2.65 2.75 2.70 * 3.85 3.44 2.94 3.05 3.21 3.21 TP Species count 24 22 14 8 8 8 3.52 3.21 3.64 3.19 3.05 3.05 * 3.63 3.31 3.75 3.64 3.48 3.48
Table 3: Variation between downstream and upstream salinity and fish size spectrum parameters in the Casamance Estuary (L =
length; MOL = maximum observed length of a species and SD. D = distance from the estuary mouth. *** = p < 0.001 Location D (km) Elinkine 13 Tendouk 42 Adéane 93 Diattakunda 130 Simbandi brassou 158 Sédhiou 170 p Salinity 40.6 (1.1) 47.9 (2.0) 57.3 (2.9) 61.6 (9.0) 58.9 (10.9) 57.2 (10.1) *** L<10 cm (%) 0.0 0.0 21.7 47.7 5.6 14.6 Modal class (cm) 19–20 19–20 11–12 7–8 11–12 9–10 Mean size (cm) 22.9 (16.4) 20.6 (13.7) 12.7 (11.1) 12.2 (9.5) 16.2 (9.9) 14.7 (7.3) *** L25 cm (%) 31.0 24.2 2.7 2.0 0.6 0.8 L50 cm (%) 2.8 0.1 0.0 0.0 0.0 0.0 Mean MOL (cm) 50.4 (23.7) 40.8 (21.6) 32.6 (17.2) 33.7 (18.6) 32.0 (16.5) 25.2 (11.0) ***
Table 4: Linear regression with slope (S) and intercept (I) of the fish size spectra from the Casamance Estuary (ANCOVA test: ns =
not significant; * = p < 0.05; ** = p < 0.01; *** = p < 0.001). Distance from the estuary mouth is given in parentheses
Elinkine (13 km) Tendouk (42 km) Adéane (93 km) Diattakunda (130 km) Simbandi Brassou (158 km) Sédhiou (170 km) S / I S (– 0.04) I (4.40) S (– 0.07) I (5.87) S (– 0.08) I (5.87) S (–0.08) I (5.89) S (–0.10) I (6.73) S (–0.14) I (7.64) Elinkine S – – *** *** *** *** *** I – ns ns * ** ** Tendouk S – – – – ns ns * *** I – – – – ns ns * * Adeane S – – – – – – ns ns *** I – – – – – – ns ns ns Diattakunda S – – – – – – – – ns *** I – – – – – – – – ns ns Simbandi Brassou S – – – – – – – – – – *** I – – – – – – – – – – *