HAL Id: hal-01988473
https://hal.archives-ouvertes.fr/hal-01988473
Submitted on 20 Feb 2019
HAL is a multi-disciplinary open access
archive for the deposit and dissemination of
sci-entific research documents, whether they are
pub-lished or not. The documents may come from
teaching and research institutions in France or
abroad, or from public or private research centers.
L’archive ouverte pluridisciplinaire HAL, est
destinée au dépôt et à la diffusion de documents
scientifiques de niveau recherche, publiés ou non,
émanant des établissements d’enseignement et de
recherche français ou étrangers, des laboratoires
publics ou privés.
gradient in the western tropical South Pacific Ocean:
results from a one-dimensional biogeochemical–physical
coupled model
Audrey Gimenez, Melika Baklouti, Thibaut Wagener, Thierry Moutin
To cite this version:
Audrey Gimenez, Melika Baklouti, Thibaut Wagener, Thierry Moutin. Diazotrophy as the main driver
of the oligotrophy gradient in the western tropical South Pacific Ocean: results from a one-dimensional
biogeochemical–physical coupled model. Biogeosciences, European Geosciences Union, 2018, 15 (21),
pp.6573-6589. �10.5194/bg-15-6573-2018�. �hal-01988473�
https://doi.org/10.5194/bg-15-6573-2018 © Author(s) 2018. This work is distributed under the Creative Commons Attribution 4.0 License.
Diazotrophy as the main driver of the oligotrophy gradient in the
western tropical South Pacific Ocean: results from a
one-dimensional biogeochemical–physical coupled model
Audrey Gimenez, Melika Baklouti, Thibaut Wagener, and Thierry Moutin
Aix Marseille Univ., CNRS, Université de Toulon, IRD, OSU Pythéas, Mediterranean Institute of Oceanography (MIO), UM 110, 13288, Marseille, France
Correspondence: Audrey Gimenez (audrey.gimenez@mio.osupytheas.fr) and Melika Baklouti (melika.baklouti@mio.osupytheas.fr)
Received: 8 April 2018 – Discussion started: 12 April 2018
Revised: 20 August 2018 – Accepted: 16 September 2018 – Published: 7 November 2018
Abstract. The Oligotrophy to UlTra-oligotrophy PACific Experiment (OUTPACE) cruise took place in the western tropical South Pacific (WTSP) during the austral summer (March–April 2015). The aim of the OUTPACE project was to investigate a longitudinal gradient of biological and bio-geochemical features in the WTSP, and especially the role of N2 fixation in the C, N, and P cycles. Two contrasted
regions were considered in this study: the Western Melane-sian Archipelago (WMA), characterized by high N2fixation
rates, significant surface production and low dissolved inor-ganic phosphorus (DIP) concentrations, and the South Pa-cific Gyre (WGY), characterized by very low N2 fixation
rates, surface production and high DIP concentrations. Since physical forcings and mixed layer dynamics in both regions were similar, it was considered that the gradient of oligotro-phy observed in situ between the WMA and WGY was not explained by differences in physical processes, but rather by differences in biogeochemical processes. A one-dimensional physical–biogeochemical coupled model was used to investi-gate the role of N2fixation in the WTSP by running two
iden-tical simulations, only differing by the presence (simWMA) or absence (simWGY) of diazotrophs. We showed that the nitr-acline and the phosphnitr-acline had to be, respectively, deeper and shallower than the mixed layer depth (MLD) to bring N-depleted and P-repleted waters to the surface during winter mixing, thereby creating favorable conditions for the devel-opment of diazotrophs. We also concluded that a preferen-tial regeneration of the detrital phosphorus (P) matter was necessary to obtain this gap between the nitracline and phos-phacline depths, as the nutricline depths significantly depend
on the regeneration of organic matter in the water column. Moreover, the model enabled us to highlight the presence of seasonal variations in primary production and P availability in the upper surface waters in simWMA, where diazotrophs provided a new source of nitrogen (N) to the ecosystem, whereas no seasonal variations were obtained in simWGY, in the absence of diazotrophs. These main results emphasized the fact that surface production dynamics in the WTSP is based on a complex and sensitive system which depends on the one hand on physical processes (vertical mixing, sinking of detrital particles), and on the other hand on biogeochemi-cal processes (N2fixation, remineralization).
1 Introduction
The efficiency of the oceanic carbon (C) sequestration de-pends upon a complex balance between the organic matter production in the euphotic zone and its remineralization in both the epipelagic and mesopelagic zones. The growth of autotroph organisms, and therefore the assimilation of CO2,
is strongly linked to the nutrients’ availability in the ocean surface layer (de Baar, 1994). Although nitrate (NO−3) and ammonium (NH+4) are the two main N sources taken up by autotrophs, their concentrations remain very low in the olig-otrophic ocean and often growth-limiting in most of the open ocean euphotic layer (Falkowski et al., 1998). In contrast to NO−3 and NH+4, the dissolved dinitrogen (N2) gas in seawater
consid-ered an inexhaustible N source for the marine ecosystems. Some prokaryotic organisms (Bacteria, Cyanobacteria, Ar-chaea), commonly called diazotrophs or “N2fixers”, are able
to use this gaseous N source by converting it into a usable form (i.e., NH3) due to the nitrogenase enzyme system (Zehr
and McReynolds, 1989; Zehr and Turner, 2001). In addition to providing a new source of nitrogen for themselves, dia-zotrophs release a fraction of the fixed N in the dissolved pool in the form of NH+4 and dissolved organic N (DON) in the surface waters (Bronk and Ward, 2000; Mulholland et al., 2004, 2006; Benavides et al., 2013; Berthelot et al., 2015) and thus contribute to sustaining life and potentially C export. This new N input would seem to bring a positive advantage to the C biological pump since it would reduce the N limitation for the phytoplankton and thus enhance pri-mary production in oligotrophic regions. However, even if di-azotrophs are not limited by atmospheric N2, their growth is
controlled by other factors, including the availability of dis-solved iron (DFe) and disdis-solved inorganic phosphate (DIP) (Moutin et al., 2005; Karl and Letelier, 2008). Moreover, chemostat experiments have highlighted that N2fixation
ac-tivity was highly dependent on the circadian clock and that the success of non-diazotrophs and diazotrophs depends on the interplay between light intensity and DIN concentration, and the competition for those resources (Rabouille et al., 2006; Agawin et al., 2007). In a synthesis paper, Gruber (2004) reminds us that over the last decades, the work on N2 fixation and the diversity of diazotroph organisms has
shown a significant contribution of N2 fixation to primary
production in the global ocean (Falkowski, 1997; Gruber and Sarmiento, 1997; Capone et al., 1997; Karl et al., 2002), thereby calling into question the classical paradigm of the N limitation in the open ocean (Zehr and Kudela, 2011).
Furthermore, in the current context of climate change, Polovina et al. (2008) showed that global warming would in-tensify the stratification of surface waters in tropical and sub-tropical oceans, further reducing nutrient concentrations in the euphotic layer. It is therefore crucial to study in detail the coupling of the biogenic element cycles in the oligotrophic regions to better understand all the interactions between the processes involved in the surface production and there-fore in the C biological pump. The Oligotrophy to UlTra-oligotrophy PACific Experiment (OUTPACE) cruise has as its main objective to study how production, mineralization and export of organic matter, and associated biogenic ele-ments of C, N, and P biogeochemical cycles, depend on the N2 fixation process. Along the transect covered during the
OUTPACE cruise, a longitudinal gradient of DIP availabil-ity was observed from low concentrations in the Melanesian Archipelago (MA) to higher concentrations in the South Pa-cific Gyre (SPG) (Moutin et al., 2018), closely related to an opposite gradient of primary production (Van Wambeke et al., 2018) and N2fixation rates (Bonnet et al., 2017; Caffin
et al., 2018). In the framework of the OUTPACE study, it ap-peared crucial to investigate in detail the role of N2fixation
in the surface production, using a modeling approach com-bining a 3-D modeling study at regional scale (Dutheil et al., 2018) and a process-focused study using a one-dimensional model (this work), with the aim of explaining the contrasted ecosystems and biogeochemical cycles observed in the west-ern tropical South Pacific (WTSP). Since experimental stud-ies highlighted the significant contribution of N2fixation as
a source of N for planktonic ecosystems in the surface layer (Martínez et al., 1983; Karl et al., 1997; Capone et al., 2005), the process of diazotrophy associated (or not) with explicitly represented diazotroph organisms has been implemented in numerous biogeochemical models in the last decades. As a result, more and more modeling studies have been investi-gating the role of diazotrophy at global scale (Moore et al., 2002, 2004; Monteiro et al., 2011), at regional scale (Coles and Hood, 2007; Zamora et al., 2010), at local scale (Fen-nel et al., 2002; Gimenez et al., 2016) or more specifically at population scale (Rabouille et al., 2006; Grimaud et al., 2013). While three-dimensional (3-D) models provide a gen-eral view of the studied ecosystems, computational costs of-ten restrict the spatial and temporal resolutions and/or the complexity of the biogeochemical model. By contrast, one-dimensional models only provide a local view, but enable an accurate study of the biogeochemical processes decon-voluted from horizontal marine dynamics, at physiological (days) and ecological (months to years) timescales. In this work, we used a one-dimensional physical–biogeochemical coupled model to simulate the dynamics of the complex ecosystems observed during the OUTPACE cruise, and built two simulations to represent each of two highly contrasted regions sampled during the OUTPACE cruise, namely the Western Melanesian Archipelago (WMA) and the Western South Pacific Gyre (WGY) (see Fig. 2). One of these sim-ulations was run with diazotrophy as a proxy of the WMA region, and the second without diazotrophy as a proxy of the WGY region, to implicitly take into account the role of DFe allowing N2fixation in the MA but preventing it in the gyre
(Moutin et al., 2008; Bonnet et al., 2017). The purpose of this study is to investigate the direct and/or indirect role of N2
fix-ation in surface planktonic production and biogeochemical C, N, and P cycles, with the aim of determining whether the main biogeochemical differences observed in the MA and in the SPG areas can be explained or not by diazotrophy.
2 Methods
2.1 Strategy of the OUTPACE cruise and of the modeling study
The OUTPACE cruise was carried out between 18 Febru-ary and 3 April 2015 from Noumea (New Caledonia) to Pa-peete (French Polynesia) in the WTSP (Fig. 2). Two types of stations were sampled: 15 short-duration (SD) stations ded-icated to the study of the longitudinal variations of
biodi-versity and biogeochemistry, and 3 long-duration (LD) sta-tions where Lagrangian experiments and several additional measurements (such as measurements on the settling of or-ganic matter using sediment traps) were carried out during 6 days. The details of all the operations conducted at the dif-ferent stations are summarized in Moutin et al. (2017), with a focus on the Lagrangian strategy followed at the LD sta-tions in de Verneil et al. (2018). Along the eastward tran-sect from the MA to the SPG, three areas were considered regarding their different biogeochemical characteristics: the western MA (WMA), the eastern MA (EMA) and the west-ern gyre (WGY) waters (Moutin et al., 2018). In this study, we focused on the comparison of the two most contrasted areas, namely the WMA and the WGY (Fig. 2). While both the WMA and WGY present extremely low nitrate concen-trations in the photic layer, the WMA presents higher sur-face production, higher N2fixation rates and lower phosphate
concentrations than the WGY.
As already mentioned, in order to investigate the role of N2 fixation in the WTSP, we ran two identical simulations,
one including the process of diazotrophy, hereafter named “simWMA”, and the second without this process, hereafter named “simWGY”. Except for the process of diazotrophy, the two simulations were strictly identical regarding the at-mospheric forcings, the initial conditions, the model formu-lation and the parameter values. The assumption made by us-ing a unique set of atmospheric forcus-ings for two regions sig-nificantly far away is first based on the in situ climatological data reported in Moutin et al. (2018). These authors showed that the vertical dynamics of the water column, and espe-cially the depths of the mixed layer, were similar throughout the year in all of the WTSP (see Fig. S1 in the Supplement). In addition, the atmospheric forcings calculated by the WRF atmospheric model at the WMA and WGY were also very similar (see Fig. S2 in the Supplement). Furthermore, we also compared two simulations run with the respective atmo-spheric forcings calculated at the WMA and WGY and did not observe any significant difference, neither in the water column dynamics nor in the biogeochemical cycles.
The methods used to measure dissolved inorganic nitrogen (DIN), DIP, N2fixation (N2fix), chlorophyll a (Chl a),
pri-mary production (PP) and particulate organic carbon (POC), as well as the corresponding data, are fully described in the companion paper by Moutin et al. (2018). For ease of read-ing, the following abbreviations will be used: for a given variable “X”, abbreviations XsimWMAand XsimWGYwill be used for the model outputs, respectively, with and without di-azotrophy, and XobsWMAand XobsWGYfor the experimental data measured at the WMA and WGY, respectively.
Model outputs were compared to the observations gath-ered during the OUTPACE cruise at the WMA and WGY. For each profile presented in the Results section, we plot-ted the discrete values of the data collecplot-ted at the WMA and WGY (circles), and the average over the respective sampling periods of the WMA and WGY for the model results (from
21 February 2015 to 2 March 2015 for simWMA, and from 21 to 31 March 2015 for simWGY). Both simulations were run over 10 years. Since a cyclic steady state was reached in the near-surface layer after 3 years, the vertical profiles of the third year of simulation (solid line) are presented for both simWMA and simWGY. Moreover, since the outputs of simWMA provided interesting information regarding the role of diazotrophs in fueling the system with new N inputs, the 10 vertical profiles of the 10-year run are all presented in the Results section.
2.2 The biogeochemical model
The biogeochemical model implemented in this work is em-bedded in the Eco3M modular numerical tool (Baklouti et al., 2006). It was based on the Eco3M-MED model (Alekseenko et al., 2014) to which two diazotrophs were added for study-ing N2fixation fate in the framework of a mesocosm
exper-iment in the Noumea lagoon (Gimenez et al., 2016). For the present study, and in order to improve the model, some fea-tures of the original model presented in Gimenez et al. (2016) were modified and some new features were introduced (see Sect. 2.2.2).
2.2.1 General backgrounds
The model includes eight planktonic functional types (PFTs): four autotrophs (a large and a small classic phytoplankton and a large and a small nitrogen fixer), three grazers (zoo-plankton) and one decomposer (heterotrophic bacteria). Each of them is represented in terms of several concentrations (C, N, P and chlorophyll for phytoplankton) and an abundance (cells or individuals per liter) (Mauriac et al., 2011). Each PFT is represented by emblematic organisms indicated in brackets, and for ease of reading, living compartments are abbreviated as follows: TRI for the large diazotrophs (Tri-chodesmiumsp.), UCYN for the small diazotrophs (unicel-lular nitrogen fixers), PHYS for the small autotrophs (pico-phytoplankton and nano(pico-phytoplankton), PHYL for the large autotrophs (diatoms), HNF for nanozooplankton (hetero-nanoflagellates), CIL for microzooplankton (cilliates) and COP for mesozooplankton (copepods). For all the non-diazotrophic features and in agreement with the literature (e.g., Luo et al., 2012), it has been considered that a Tri-chodesmiumtrichome was equivalent to 100 PHYL cells and that a UCYN cell was equivalent to a PHYS cell. However, the conversion factor of 100 between TRI and PHYL was only applied for extensive parameters, i.e., those depending on biomass. Intensive parameters were set equal to those of PHYL, except for the specific growth rate, which was instead averaged from the literature since it has been experimentally demonstrated that it was lower than that of PHYL (Mulhol-land and Bernhardt, 2005; Hutchins et al., 2007). Parameter values, whether new or differing from those of Alekseenko et al. (2014), are given in Supplement Table S1.
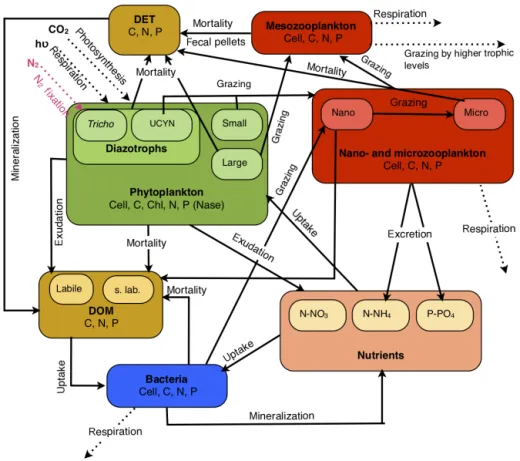
Figure 1. Conceptual diagram of the biogeochemical model (Eco3M-Med enhanced with diazotrophs) from the 1 DV coupled physical– biogeochemical used for the OUTPACE project.
Figure 2. Transect of the OUTPACE cruise with the location of the SD and LD stations superimposed on a bathymetry map (GEBCO_2014 grid). The two main regions studied in this work are shown in green for the WMA and in blue for the WGY.
In the model, N2 fixation rates depend on the
nitroge-nase enzyme activity (Nase) (Rabouille et al., 2006; Gimenez et al., 2016); nitrogen fixation is the result of a balance between the increase and decrease in the enzyme activity, which is controlled by the intracellular content in C and N, and by the NO−3 concentration. The more the cell is deprived of nitrogen, the more the nitrogenase activity is enhanced, but under the control of the intracellular C content which plays the role of “energy regulator”, being tightly linked to the daily light cycle (Rabouille et al., 2006). Further details regarding the implementation of diazotrophy in the model are
available in Gimenez et al. (2016). All the compartments and fluxes implemented in the model are summarized in Fig. 1. 2.2.2 New features of the model
Since the Gimenez et al. (2016) modeling study was focus-ing on a mesocosm experiment, the assessment of the model skills was incomplete. With the new set of data provided by the OUTPACE cruise, some features of the original model were improved and some new features were introduced to correct the model major flaws or to add some realism to the model. To improve the representation of the nutricline depths
which depend on the sinking of the detrital organic matter and its mineralization in the water column, we included two size classes of detrital matter associated with two different sinking rates, while the previous version (Gimenez et al., 2016) only included a single compartment of detrital mate-rial (see Table S1 in the Supplement). The large detrital par-ticles (DETL) are fueled by the death of COP, their fecal pel-lets and the quadratic mortality of PHYL. The small detrital particles (DETS) are fueled by the hydrolysis of DETL and by the linear mortality of PHYL, TRI and CIL, whereas the mortality of PHYS, UCYN, HNF and BAC fills the compart-ment of dissolved organic matter (DOM). The sinking rates for DETS and DETL are 1 and 25.0 m d−1, respectively.
While several studies have shown that the intracellular C : N : P ratios in heterotrophic bacteria tend to be below Redfield values as they were enriched in N and P (Bratbak, 1985; Goldman and Dennett, 2000; Vrede et al., 2002), more recent studies suggest that these ratios could be higher than 50 : 10 : 1 and highly variable in response to physical, chem-ical and physiologchem-ical conditions (Cotner et al., 2010; Mar-tiny et al., 2013; Zimmerman et al., 2014). This led us to replace the 50 : 10 : 1 ratios used so far in the model for bac-teria and HNF with the Redfield 106 : 16 : 1 ratio as with the other PFTs represented in the model. We remind the reader however that the PFT’s stoichiometry is flexible in the model and that the Redfield ratios are only used to link together the limits of the ranges of C, N and P intracellular quotas (i.e., QminC =106 QminP , QmaxC =106 QmaxP ; see Table S1 in the Supplement), thereby allowing a large variety of possible C : N : P ratios in PFTs.
Moreover, in this oligotrophic to ultra-oligotrophic region, the regeneration of the organic matter is crucial to maintain-ing the ecosystem balance, and certain modifications have been made in this regard: (1) to indirectly take into account the enhanced consumption of organic P through the activity of extracellular alkaline phosphatase produced by bacteria in oligotrophic areas (Perry, 1972, 1976; Vidal et al., 2003), all the half-saturation constants (Ks) for the DOP uptake were divided by 1 order of magnitude, (2) the hydrolysis rate of the particulate organic P was modified (from 0.4 to 2.0 d−1) to increase the regeneration of P compared to C and N in this P-depleted area (detailed in Sect. 4.2.2).
2.3 One-dimensional physical model and forcings The biogeochemical model has been coupled with the one-dimensional physical model described in Gaspar (1988). This model solves the conservation equations for heat, salinity, momentum and kinetic energy. The grid cell is 5 m high from the surface to 200 m, and 40 m high from 200 to 2000 m. It uses a simple eddy kinetic energy parametrization with a tur-bulence closure scheme, resolved by the turbulent kinetic en-ergy (TKE) equation (Gaspar et al., 1990).
The atmospheric forcings (i.e., the sensible and latent heat fluxes, the short- and long-wave radiation and the wind
stress) for the physical model were provided by the Weather Research Forecast (WRF) model (Shamarock et al., 2008), with a spatial resolution of 15 km and a time step of 6 h. Boundary conditions for the WRF model are provided by the American Global Forecast System (GFS) model (Na-tional Center for Environmental Prediction/Na(Na-tional Center Environmental Prediction – NCAR/NCEP) analyses. These analyses correspond to a correction of the forecast using a larger number of observations during the data assimilation cycle. The WRF model is forced every 6 h by analyses dur-ing the processdur-ing. Only a sdur-ingle year of atmospheric forcdur-ing has been extracted (from September 2014 to August 2015), which was applied on a cyclical basis during the 10-year simulation. This 1-year period has been arbitrarily chosen so as to cover the period from the winter mixing preced-ing the OUTPACE cruise to the next winter. The compar-ison between some physical outputs (i.e., surface temper-ature, surface density, mixed layer depth) and climatologi-cal in situ observations allowed one to ensure that the one-dimensional physical model was relevant to addressing our scientific question (see Fig. S3 in the Supplement).
2.4 Initialization for the one-dimensional coupled physical–biogeochemical model
The initial profiles of temperature (T ), salinity (S), DIN and DIP were constructed by interpolating mean field data from the WOA13 climatology database (Locarnini et al., 2013; Zweng et al., 2013) at the exact location of the WMA (19◦13.00 S, 164◦29.40 W). Initial dissolved organic mat-ter concentrations, BAC and autotroph abundances were ob-tained from the vertical profiles measured in the WMA: due to the homogeneity of the surface layer caused by win-ter mixing, the 0–70 m mean value was applied on the 0– 70 m layer of the initial vertical profiles. Below 70 m, ini-tial concentrations were the same as data. Since the model includes variable stoichiometry for organisms, initial intra-cellular contents of non-diazotroph organisms were set to 50 %, 25 % and 75 % of their respective intracellular quota ranges in C, N and P. While there was no difference in initial C and P intracellular contents between diazotroph and non-diazotroph organisms, initial N intracellular con-tents of diazotrophs were set up to 50 % to take into ac-count their metabolic advantage of fixing N2. Initial
concen-trations of detrital compartments are nil. Initial zooplankton abundances were obtained from the BAC abundances using a BAC : HNF : CIL = 1000 : 100 : 1 ratio. In simWGY where diazotrophs are removed, initial abundances and biomasses of TRI and UCYN were, respectively, transferred in PHYL and PHYS compartments, in order to strictly preserve the same initial biomasses and abundances in the two simula-tions.
3 Results
3.1 Vertical dynamics of the main biogeochemical stocks and flux
3.1.1 Nutrients availability and N2fixation
DIN and DIP concentrations are presented in Fig. 3a and b. Strictly, DIP is the sum of orthophosphates (i.e., DIP=[H3PO4] + [H2PO−4] + [HPO
2− 4 ] + [PO
3−
4 ]), and DIN is
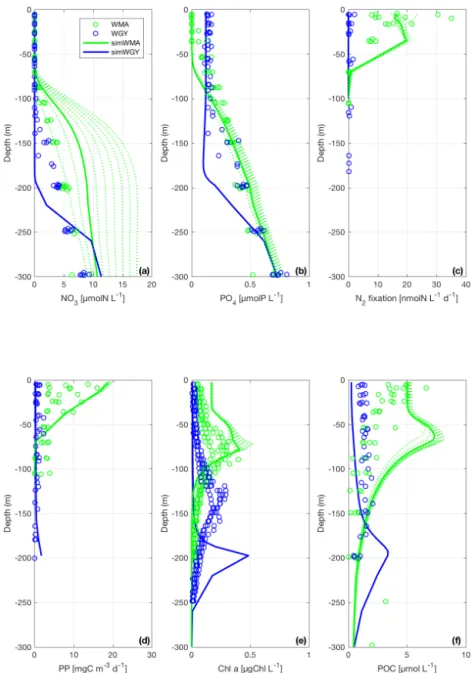
the sum of nitrate, nitrite and ammonium (DIN=[NO−3] + [NO−2] + [NH+4]). However, since [NO−2] and [NH+4] were negligible compared to [NO−3], DIN was assimilated into [NO−3]. From the surface to 70 m depth, DINobsWMA and DINobsWGYare below the quantification limit (i.e., 0.05 µM). DINsimWMAand DINsimWGYdo not show any significant dif-ference in the surface layer and range from 0.02 to 0.04 µM and from 0.03 to 0.04 µM for DINsimWMA and DINsimWGY, respectively. Even if the concentrations of DIP are low in the surface layer (below 0.2 µM), some differences can be seen between the WMA and WGY for both model out-puts and data. Figure 3b shows a concentration around 0.2 µM for DIPobsWGY from the surface to 120 m, whereas DIPobsWMA is very low, with values below the quantifica-tion limit (0.02 µM) at the subsurface, with a steady increase up to 0.5 µM at 300 m depth. Regarding the model outputs, DIPsimWMA is close to zero from the surface to 60 m, and reaches a value of 0.70 µM at 300 m depth. DIPsimWGY is significantly higher than DIPsimWMAin the upper layer, with a homogeneous concentration of 0.16 µM from the surface to 175 m depth, and then increases slightly up to 0.7 µM at 300 m.
The vertical profiles of DINsimWMAand DIPsimWMAshow a deeper nitracline (around 75 m depth) than phosphacline (around 60 m depth), as observed with data. Note that to re-produce this discrepancy within the model, it has been nec-essary to introduce a preferential regeneration of the detri-tal matter in P compared to C and N in the biogeochemical model, a point thereafter detailed in Sect. 4.2.2. Regarding the WGY region, the observed and simulated nitracline and phosphacline are deeper than in the WMA region. The sim-ulated nutriclines are however deeper than those measured (around 140 and 125 m for the simWGY nitracline and phos-phacline depths, respectively). While the simulated and mea-sured nitracline depths are both around 75 m at the WMA, DINsimWMAis higher than DINobsWMAbelow the nitracline. There is indeed a regular accumulation of DINsimWMA be-low the photic zone during the 10-year simulation (Fig. 3a), reaching at the end a high concentration of 17 µM that is not observed in DINobsWMA. Even if we may also note a slight variation in the phosphacline over time in simWMA, it is much less significant than the above-mentioned change in the simulated nitracline.
The N2 fixation rates (N2 fix) measured at the WMA
and WGY and the vertical profiles of N2fixsimWMA are
pre-sented in Fig. 3c. At the surface, N2 fixobsWMA ranges
from 9.0 to 30.0 nmolN L−1d−1, with a maximum rate of 35.0 nmolN L−1d−1near 10 m depth. N2fixobsWMAthen
de-creases gradually with depth to 9.0 nmolN L−1d−1at 40 m before reaching low values below 40 m, with values less than 1.5 nmolN L−1d−1and a minimum of 0.1 nmolN L−1d−1at 100 m. Regarding the model results of the simulation with di-azotrophy, N2fixsimWMA rates are consistent with data with
a similar trend of higher rates (around 16.0 nmolN L−1d−1) from the surface to 40 m depth, and decreasing values from 40 to 70 m depth (down to 1.0 nmolN L−1d−1at 70 m). At the WGY, very low N2fixobsWGYwas measured compared to
N2 fixobsWMA, with a maximum rate of 2.0 nmolN L−1d−1
observed at the surface. In the simulation without diazotro-phy, N2fixsimWGYis nil (see Fig. 3c).
3.1.2 Chlorophyll a, primary production and carbon biomass
Figure 3 shows the vertical profiles of (d) primary produc-tion (PP), (e) chlorophyll a concentraproduc-tion (chl a) and (f) particulate organic carbon (POC) from the surface to 300 m depth. PP is significantly higher in WMA than in WGY, in both the experimental data and the model results. At the sur-face, PPobsWMAranges from 4.0 to 16.0 mgC m−3d−1, while PPobsWGYnever exceeds 1.5 mgC m−3d−1. PPsimWGYnever exceeds 1.0 mgC m−3d−1 and is in good agreement with PPobsWGY in the whole photic layer. PPsimWMA is also in good agreement with PPobsWMA, even if PPsimWMA values are close to the upper limit of the PPobsWMA range values. As for PPobsWMA, PPsimWMAslightly decreases from the the surface to the bottom of the photic layer, before reaching low rates below 70 m.
The main differences between Chl aobsWMA and Chl aobsWGY lie in the depth of the deep chlorophyll maximum (DCM), which is around 75 m for Chl aobsWMA, while the Chl aobsWGY DCM is deeper, at around 140 m. The deepening of the DCM in the WGY compared to the WMA is a result also observed in simWGY and simWMA simulations. This deepening is nevertheless larger in the model with a DCM for Chl asimWGYlocated at 200 m, while the DCM for Chl asimWMAis shallower (around 50 m). In the model outputs, the location of the DCM is roughly located at the nutrient-limiting nutricline, i.e., at the phosphacline depth in the WMA and simWMA, and at the nitracline depth in the WGY and simWGY. For both the data and the model outputs, we observe a difference in the depth of the DCM between the WMA and WGY, but no significant difference in the DCM intensity between the two regions. Neverthe-less, there is a noticeable difference in the DCM intensity between observations and simulations: Chl aobsWMA and Chl aobsWGY maximum values are equal to 0.3 µgChl L−1, while Chl asimWMA and Chl asimWGYmaximum values are equal to 0.5 µgChl L−1.
Figure 3. Vertical profiles of (a) dissolved inorganic nitrogen (DIN), (b) dissolved inorganic phosphorus (DIP), (c) N2fixation rates, (d)
primary production (PP), (e) chlorophyll a (Chl a) and (f) particulate organic carbon (POC) during the OUTPACE cruise in the WMA region (green circles) and in the WGY region (blue circles), and from the model results of the simulation with diazotrophy as a proxy of the WMA region (simWMA, green line) and without diazotrophy as a proxy of the WGY region (simWGY, blue line). For the simWMA, we represent the profiles of the 10 years of simulation (dashed lines) to show the influence of the diazotrophy in the system.
The particulate carbon biomass (POC) presented in Fig. 3f shows significant differences between the WMA and WGY for both the data and the model results. First of all, there is a higher production of biomass at the WMA close to the sur-face than at the WGY. POCobsWMAis, at the maximum, 5-fold higher than POCobsWGY, with maximum values at the surface reaching 5 µM. POCobsWMA then slightly decreases with depth to reach below 50 m values that are similar to those of POCobsWGY(around 1.5 µM). Higher simulated than measured POC values are also observed close to the surface.
A maximum value of 7.5 µM for POCsimWMA correspond-ing to the DCM is found at 65 m but is not observed in in situ data. A 2.5-fold lower and deeper maximum is also ob-served in POCsimWGY just above 200 m, with a maximum concentration of 3 µM. POCsimWGY concentrations remain very low between the surface and the deep maximum, while there is a significant POC production rate in simWMA, with POCsimWMA concentrations higher than 6.5 µM at the sur-face.
3.2 Seasonal variations
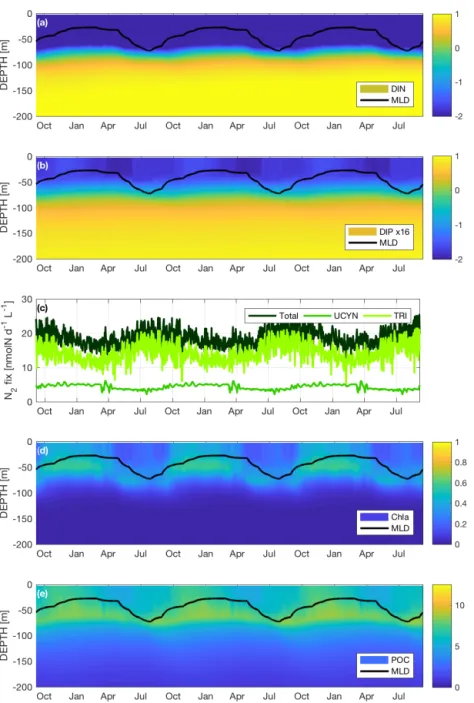
Unlike the available in situ data, the model can provide the time variations of all the above-mentioned biogeochemical variables. The seasonal pattern of the nutrient pools, N2
fix-ation, Chl a and POC is therefore shown over a 3-year pe-riod in order to focus on the seasonal variability. As already mentioned, the same atmospheric forcings are repeated every year, and they cover the period between the last winter mix-ing period before the OUTPACE cruise (September 2014) and the next winter in August 2015.
3.2.1 Nutrient availability and N2fixation dynamics
The nutrient variations throughout the water column are in part related to the variations of the mixed layer depth (MLD) during the year. The seasonal variations of the MLD are plot-ted in Fig. 4a, b, d and e. They clearly indicate a winter mix-ing beginnmix-ing at the end of May leadmix-ing to a maximum MLD of 70 m in August, followed by a longer stratified period from November to April, with a shallower (between 25 and 30 m) MLD compared to winter mixing. Figure 4a shows the DIN concentrations for simWMA from the surface to 200 m on a logarithmic scale. There is a slight variation of the nitracline around 70 m, but the concentration in the near-surface layer always remains below 3 nmol L−1(nM), which is far below the quantification limit (50 nM).
Unlike DIN, DIP presents significant seasonal variations throughout the year (Fig. 4b). The concentrations are also presented on a logarithmic scale using the Redfield ratio (DIP ×16) in order to easily compare DIN and DIP concen-trations with respect to the “classical” proportion of phyto-plankton biological demand. During winter mixing, surface DIPsimWMA increases from 0.6 to 2 nM, and remains quite stable until the end of February before regularly decreasing until June down to 0.6 nM. DIPsimWMAthen remains low dur-ing the stratified period until the next winter mixdur-ing in Au-gust. The phosphacline is always shallower than the nitra-cline in the simWMA and remains around 50 m depth.
Accounting for the huge computer memory this would re-quire, the values of the different biogeochemical fluxes cal-culated by the model are not systematically saved. As a re-sult, numerical values of fluxes are saved at a lower verti-cal resolution than concentrations (pools). For this reason we decided to represent the dynamics of N2fixation at the
sur-face (averaged over the first 10 m) rather than as a function of depth, which would not have been as relevant as for the other variables. Figure 4c depicts the dynamics of the total N2 fixation as well as the respective contributions of
Tri-chodesmium sp. and UCYN to this flux. The total N2
fix-ation at the surface varies from a minimum mean value of 15 nmol L−1d−1 during the stratified period to a maximum mean value of 20 nmol L−1d−1 reached between July and August, i.e., during the winter mixing. The major contributor to the N2fixation in simWMA is Trichodesmium sp., with on
average a contribution of 80 % of the total N2fixed against
20 % for the UCYN.
3.2.2 Seasonal variations of surface chlorophyll a and carbon biomass production
Figure 4d presents the Chl a dynamics from the surface to 200 m depth, and shows clear seasonal variations in the photic layer throughout a year. Between October and April, the Chl asimWMA is quite homogenous from the surface to 70 m, with a DCM around 50 m reaching a maximum con-centration of 0.5 µgChl L−1. From April and during the win-ter mixing, Chl asimWMA at the surface decreases rapidly, reaching concentrations below 0.15 µgChl L−1. During the same period, there is also a deepening of the DCM to-ward 80 m, associated with lower concentrations down to 0.4 µgChl L−1.
The production of C biomass in simWMA shows sig-nificant seasonal variations in the photic layer (Fig. 4e). The period of maximum C production at the surface lasts from October to February, with maximum concentrations of POCsimWMAaround 8 µM. As shown in Fig. 3f, a deep max-imum peak of biomass is located at around 70 m, with con-centrations close to 9 µM. Like for Chl a, from the end of March and during the winter period, the surface POCsimWMA decreases significantly to reach concentrations 2-fold lower than those obtained during the bloom (i.e., between Novem-ber and February). While POCsimWMA in the 0–50 m layer decreases during the stratified period, the deep maximum re-mains at the same depth, even if its intensity decreases with POCsimWMA values at 70 m, reaching a minimum value of 7 µM at the end of July.
4 Discussion
The WTSP has been recently qualified as a hotspot of N2
fixation (Bonnet et al., 2017). It is hypothesized that, while flowing westward following the South Equatorial Current (SEC), the N-depleted, P-enriched waters from areas of den-itrification located in the eastern Pacific meet in the western Pacific waters with sufficient iron to allow N2fixation to
oc-cur (Moutin et al., 2008; Bonnet et al., 2017). In situ data showed an ecosystem significantly more productive in the WMA where N2fixation rates were higher than in the WGY,
where very low N2fixation rates were measured. These
con-trasted areas raised the question of whether the diazotrophy could be responsible for these differences observed between the WMA and WGY, which led us to run two simulations that only differed by taking into account (i.e., simWMA), or not (i.e., simWGY), the process of diazotrophy. The results of these two simulations were compared to the observations collected at the WMA and WGY areas during the OUTPACE cruise (Fig. 3) in order to study the role of N2fixation in
sur-Figure 4. Seasonal dynamics of (a) dissolved inorganic nitrogen (DIN) on a logarithmic scale in µM, (b) dissolved inorganic phosphorus (DIP) ×16 on a logarithmic scale in µM, (c) surface N2fixation rates in nmol L−1d−1, (d) chlorophyll a (Chl a) in µgChl L−1and (e) POC
in µM for the simulation with diazotrophy, as a proxy of the WMA region (simWMA) over 3 years.
face planktonic production and biogeochemical C, N, and P cycles.
4.1 N2fixation, closely linked to the DIP availability,
enhances the surface production
4.1.1 Concomitant low DIP concentrations and high N2
fixation rates
While DIN concentration remains below the quantification limit (50 nM) everywhere in the surface layer, there is a
sig-nificantly higher DIP concentration in the photic layer at the WGY than at the WMA in both the data and the model outputs (Fig. 3b). The relatively high DIP concentration in the WGY may be associated with inefficient or non-existent N2 fixation in the gyre (Moutin et al., 2018). Because of
the high Fe requirement of diazotrophs (Paerl et al., 1987; Rueter et al., 1990), the low Fe availability in the WGY is assumed to prevent or significantly limit N2fixation in the
South Pacific Gyre (Moutin et al., 2008; Guieu et al., 2018; Moutin et al., 2018). By contrast, the high Fe availability in the WMA is assumed to favor the growth of nitrogen fixers.
Guieu et al. (2018) indeed measured high DFe concentrations in the photic layer in the WMA provided by abnormally shal-low hydrothermal sources (around 500 m deep) in the WTSP. Due to very low N2fixation measured in the WGY (Bonnet
et al., 2018), autotroph organisms are N-limited, leading to a lower PP than in the WMA, which results in a higher DIP ac-cumulation in the photic layer since DIP is less consumed by organisms. Associated with lower DIP concentrations, higher N2fixation rates are observed in the WMA in both the data
and the model results (Fig. 3c). DIP depletion in simWMA is due to the presence of nitrogen fixers since the two simula-tions have exactly the same vertical dynamics and differ only by the presence/absence of nitrogen fixers.
Studies on the role of N2 fixation in the
biogeochem-istry of the Pacific Ocean have increased in number over the last decades, but the specific region of the WTSP remains patchily explored to date. Nevertheless, close to our studied area, Law et al. (2011) have observed a one-time DIP re-pletion in the surface layer due to a tropical cyclone which favored the upwelling of P-rich waters. On the basis of their Lagrangian strategy, they noticed a rapid consumption of this new DIP in correlation with a significant increase in the N2
fixation rates over the following 9 days. At a larger tempo-ral scale, Karl et al. (1997) also observed a correlation be-tween a decrease in DIP (about 50 %) and a significant in-crease in N2fixation from 1989 to 1994, in the oligotrophic
region of the subtropical North Pacific. The significant role of DIP availability in controlling N2fixation in the oligotrophic
iron-repleted WTSP (Van Den Broeck et al., 2004; Moutin et al., 2018) has been highlighted over the last decade (e.g., Moutin et al., 2005, 2008), and the consistent results be-tween the OUTPACE data and our model outputs, comparing simWMA and simWGY, reinforce this view of the biogeo-chemical functioning of this region.
4.1.2 Surface plankton productivity mainly driven by N2fixation in the WSTP
The patterns of surface production calculated by simWMA and simWGY are consistent (Fig. 3d): as with the in situ data, the model results show higher PP, POC and Chl a in simWMA (i.e., with diazotrophy) than in simWGY (i.e., without diazotrophy) in the first 0–50 m. PPsimWMA is 20-fold higher than PPsimWGY in the upper layer, in good agreement with PPobsWMA, which is 15-fold higher than PPobsWGY (Fig. 3d). Chl a concentrations never exceed-ing 0.5 µgChl L−1 are representative of oligotrophic wa-ters. Model outputs and observations both show significantly deeper DCMs at the WGY than the WMA. The deepening of the DCM characterizes the transition from oligotrophic (WMA) to ultra-oligotrophic (WGY) conditions during the OUTPACE cruise (Moutin et al., 2018). In the model out-puts, the difference between the DCM depth in simWMA and simWGY is larger than in in situ data: the DCM depth in simWGY is 150 m deeper than that of simWMA, whereas
the observed DCM depth in the WMA is only 50 m deeper than that measured in the WMA. The simulation without di-azotrophy indeed presents a DCM at 200 m depth, on av-erage 50 m deeper than that observed in the WGY region (Fig. 3e). This deep DCM is consistent with the deep maxi-mum of POCsimWGYjust above 200 m depth (Fig. 3d). Both deep maxima are related to the nutricline depths located at 195 and 185 m for DINsimWGYand DIPsimWGY, respectively. As with the DCM, the nutriclines in simWGY are signif-icantly deeper than those measured in situ in the WGY. We assume that this gap is because N2fixation is totally removed
in simWGY, whereas low but existing N2fixation still occurs
in situ at the WGY (Fig. 3c). While the N2fixation rates
re-ported in the WGY were very low, Caffin et al. (2018) and Stenegren et al. (2018) mention the presence of such dia-zotrophs from the UCYN group, whereas no Trichodesmium sp. were found in this region. The in situ planktonic ecosys-tem in the WGY might therefore be slightly fueled by weak N2 fixation, which is not the case for simWGY since
dia-zotrophy is not allowed. The above assumption concerning the gap between data and model outputs is consistent with the fact that the measured PP, POC and Chl a in the WGY are al-ways slightly higher than in the model outputs for the surface layer (Fig. 3d, e and f). To support this assumption, we ran another simulation considering only the presence of UCYN as diazotrophs in the WGY. The results of this intermedi-ate simulation (not shown) indicintermedi-ate low surface PP rintermedi-ates and POC concentrations, in agreement with those measured in the WGY. Moreover, DIP is still available in the photic zone (though at concentrations lower than for simWGY) even if the calculated N2fixation rates were slightly higher than the
measured ones. In addition, the DCM (located around 150 m) and the nutriclines were shallower than in simWGY (i.e., without any diazotrophs). This simulation can thus be con-sidered like an intermediate system between simWMA and simWGY, and confirms the close link between N2fixation
fluxes and DIP availability.
In a previous study using nearly the same biogeochem-ical model including TRI and UCYN state variables in a one-dimensional configuration without physical coupling, Gimenez et al. (2016) highlighted the direct and indirect im-pact of the new N input provided by diazotrophs. By calculat-ing the percentage of diazotroph-derived nitrogen (DDN) in each model compartment, they followed the transfer of DDN throughout the entire trophic web as a function of time, and showed that after 25 days, 43 % of the DDN fixed by dia-zotrophs was found in non-diazotroph organisms. These re-sults clearly showed that N2fixation had a significant
indi-rect impact on the planktonic production by providing a new source of N for other organisms. DDN tracking inside the model compartments is associated with very high computa-tional costs and could not be applied to the present study, where simulations are run for several years (against 25 days for the previous study). However, it is worthwhile mention-ing that the proportion of PFTs involved in total Chl a and
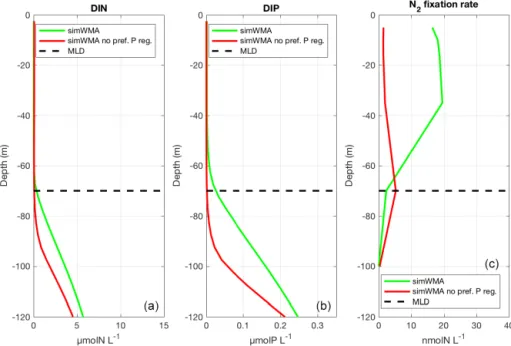
Figure 5. Vertical profiles of (a) dissolved inorganic nitrogen (DIN), (b) dissolved inorganic phosphorus (DIP), and (c) N2fixation rates for
the simulation with diazotrophy, as a proxy of the WMA region (simWMA) with the preferential P regeneration (in green) and without the preferential P regeneration (in red). The horizontal black dashed line represents the depth of the maximum mixed layer calculated at 70 m depth.
PP was 80 % of TRI, 10 % of PHYS and 5 % of UCYN and PHYL, suggesting that the impact of N2 fixation is direct
(85 % of PP is realized by diazotrophs) rather than indirect. In our model, diazotrophs have therefore a net competitive advantage over the two other non-diazotrophic autotrophs. 4.2 A close link between MLD, nutricline depth and N2
fixation
4.2.1 How can the nutricline depths influence N2
fixation?
In such oligotrophic areas, the positions of the nutriclines are crucial in controlling surface production (Behrenfeld et al., 2006; Cermeño et al., 2008) as they provide nutrients from the bottom to the photic layer. The equatorial Pacific Ocean is known for its complex hydrodynamic circulation induced by constant trade winds, leading to significant variations in the thermocline position between the east and the west of the basin (Meyers, 1979). Trade winds also have an influence on the nutrient availability in the surface layer (Radenac and Rodier, 1996; Zhang et al., 2007).
During OUTPACE, the phosphacline (above 50 m) ap-peared shallower than the nitracline (about 75 m) in the WMA region (Fig. 3a and b). A similar shift between ni-tracline and phosphacline depths was observed 10◦ fur-ther south than our studied area, with a nitracline about 20 m deeper than the phosphacline (Law et al., 2011). In those N-depleted regions, diazotrophs may outcompete
non-diazotroph organisms, using the unlimited atmospheric N2
(Agawin et al., 2007; Dutkiewicz et al., 2014). However, their development also requires sufficient light intensity and other nutrients such as P and Fe, and the debate on their expected limitation or co-limitation is of great interest to the ocean bio-geochemical community (Falkowski, 1997; Wu et al., 2000; Sañudo-Wilhelmy et al., 2001; Mills et al., 2004; Moutin et al., 2005; Monteiro et al., 2011).
On the basis of our model, we understood that it was cru-cial to take into account the nutricline depths, and that a shal-lower phosphacline than nitracline was needed to observe N2 fixation rates in agreement with those measured in situ
(Fig. 3c). This led us to implement a preferential P regen-eration in our model to reproduce the shift between the ni-tracline and the phosphacline (see Sect. 4.2.2 for more de-tails). In our preliminary results (red lines in Fig. 5), without this decoupling, the depths of the nitracline and phosphacline were located at the same depth (around 80 m), and below the MLD (Fig. 5a and b). Each winter, mixing brought low con-centrations of DIN and DIP into the euphotic layer. Low DIN concentrations are favorable for the development of N2
fix-ers (Holl and Montoya, 2008; Agawin et al., 2007), but they were rapidly limited by DIP availability as the winter mix-ing did not provide enough DIP in the photic layer, leadmix-ing to very low N2fixation rates (Fig. 5c). In this configuration,
primary production was N-limited and low compared to what was observed in the WMA region. The phosphacline had to be shallower (here about 25 m) than the nitracline, and above the winter MLD (70 m), to counteract DIP limitation. In this
case, no DIN is brought by winter mixing into the photic layer, which favors N2fixers compared to non-fixer
organ-isms, and sufficient DIP concentrations to support surface production until the next winter mixing. This simWMA con-figuration led to a significant development of N2fixers in the
0–50 m layer, dominated by Trichodesmium sp. (not shown), with consistent rates of N2fixation and PP rates (Fig. 3c and
d).
4.2.2 A preferential P regeneration needed to sustain N2fixation
To obtain with the model a phosphacline shallower than the nitracline, and thereby decrease DIP depletion in the sur-face layer, we had to decouple the regeneration of the de-trital organic particulate N (DET-N) and the dede-trital particu-late organic P (DET-P) by significantly increasing the rem-ineralization rate of DET-P compared to that of DET-N and DET-C. The use of extracellular phosphoenzymes (e.g., alka-line phosphatase, nucleotidase, polyphosphatase or phospho-diesterase) by microorganisms to regenerate DIP from dis-solved organic P when DIP is depleted is well known (Perry, 1972, 1976; Vidal et al., 2003). Our model does not include the explicit phosphatase alkaline activity, but it is represented indirectly by giving direct access to DOP by autotrophs. However, this advantage was not sufficient to decrease P lim-itation enough and allow the growth of N2 fixers so as to
calculate N2fixation rates consistent with those measured in
the WMA. A preferential P regeneration of the particulate organic matter was required and obtained by increasing the P hydrolysis rate compared to that of C and DET-N. The location of the detrital matter regeneration in the wa-ter column is based on a balance between the sinking and the hydrolysis rates of the particulate organic matter. As men-tioned in Sect. 4.2.2, the detrital matter is divided into two size fractions associated with two constant sinking rates of 1.0 and 25.0 m d−1for the small and large detrital particulate matter, respectively. Initially, the hydrolysis rates for the de-trital C, N and P particulate matter were the same, and equal to 0.05 d−1. The preferential regeneration of P was a pos-teriori obtained by increasing the hydrolysis rate of particu-late P to 2.0 d−1, without any change in the sinking rates. To illustrate how the discrepancy between nitracline and phos-phacline depths can be attributed to preferential P regener-ation, DIN and DIP concentrations and N2 fixation rates in
simWMA calculated with and without preferential P regen-eration (i.e., preferential hydrolysis of P particulate matter) have been compared (Fig. 5). This figure shows the deepen-ing of the phosphacline in the simulation without preferential P regeneration. More importantly, without preferential P re-generation, the phosphacline depth is deeper than the MLD at 70 m, which prevents DIP input in the surface layer during winter mixing, and leads to a strong limitation of diazotrophs by P. This stronger P limitation without preferential P regen-eration can also be observed at the cellular scale by
analyz-ing the intracellular P quota of N2 fixers. In the simulation
without preferential P regeneration, the relative intracellular quota of P in TRI and UCYN is on average, respectively, 8 and 16 times lower than with preferential P regeneration. As N2fixation alleviates N limitation for diazotrophs, their
growth is limited by P availability. The significant decrease in relative intracellular P quotas has therefore a significant im-pact on their growth, and consequently explains the lower N2
fixation rates shown in Fig. 5c. This preferential P reminer-alization was also used by Zamora et al. (2010), who investi-gated different mechanisms that might be able to explain the N excess observed in the North Atlantic main thermocline. Even if their model did not include N2 fixation, they
con-cluded that the N excess observed would be a consequence of a co-occurrence of a preferential P remineralization and a surface N input provided by N2fixation. With the same aim
of studying the N excess observed in the North Atlantic main thermocline, Coles and Hood (2007) implemented a more complex model including the N2 fixation process and
vari-able stoichiometry for the non-living compartments. They concluded that a preferential P regeneration was needed to generate the N excess anomalies observed in the subsurface North Atlantic, and the preferential P regeneration was ob-tained by increasing the P remineralization rates relative to N. In both their and our study, the change in P remineraliza-tion rate was necessary to reduce upper surface P limitaremineraliza-tion for diazotrophs and to obtain N2fixation rates consistent with
observations.
4.3 N from N2fixation accumulates in the main
thermocline
By running the model simulations over 10 years, we ob-served the storage of the N input by diazotrophy. The ni-trate accumulation observed in simWMA from 70 to 500 m (Fig. 3a), reaching concentrations of 17.0 µM after a run of 10 years, is obviously overestimated as we used a one-dimensional model, without any horizontal exchange. The horizontal advection which would occur in the field is not represented here, and without any loss processes taken into account, the annual N input by N2 fixation accumulates,
as observed in simWMA. The interesting point is the lo-cation of this accumulation around the first 400 m of the main thermocline between 100 and 500 m depth. This re-sult is consistent with some studies which have investigated the N excess in the ocean, using for instance the N? tracer (N?=NO−
3−16×PO 3−
4 , Gruber and Sarmiento, 1997) and the
N2fixation contribution to this N excess (Bates and Hansell,
2004; Hansell et al., 2004; Landolfi et al., 2008; Zamora et al., 2010). A companion paper in this special issue in-vestigates in detail the N excess observed in the WTSP in relation to N2fixation (Fumenia et al., 2018). Our model
re-sults clearly show an accumulation of N in the 100–500 m layer which results from the new N input by diazotrophy, as this is the sole external N source implemented. This
accu-mulation constantly increases every year by an average of 449.6 mmolN m−2, while the annual integrated N2 fixation
provides 451.0 mmolN m−2. After benefiting the upper water ecosystem, more than 99.5 % of new N derived from N2
fixa-tion ends in the DIN pool from the 100–500 m layer. We use a one-dimensional model which is not intended to provide any quantitative conclusion regarding this N accumulation, but these calculations explain the annual DIN accumulation observed in Fig. 3a. According to the model, N2fixation may
explain the N excess observed in situ around the main ther-mocline in the WTSP, as reported by Fumenia et al. (2018). 4.4 N2fixation leading to seasonal variations in the
WTSP
To date, the WTSP, and more generally the South Pacific Ocean, has been much less studied than the North Pa-cific Ocean, which has been sampled since the late 1980s within the framework of the Long-term Oligotrophic Habi-tat Assessment (ALOHA) near the Hawaii islands. The South Pacific has been sampled from west to east dur-ing the BIOSOPE (Claustre et al., 2008) and OUTPACE (Moutin et al., 2017) French oceanographic cruises and many other cruises (e.g., Moisander et al., 2012, as well as the cruises involved in the GLODAPv2 project, Olsen et al., 2016), providing a spatial (Fumenia et al., 2018) but not temporal overview of the southern tropical Pacific. To date, the seasonal variations have only been studied dur-ing the DIAPALIS cruises (http://www.obs-vlfr.fr/proof/vt/ op/ec/diapazon/dia.htm, last access: 8 October 2018) in sev-eral stations located in the MA close to New Caledonia. By means of our one-dimensional model, we can analyze the annual variability of the entire ecosystem implemented in the model in order to corroborate, or not, certain hypotheses raised from the OUTPACE data analysis.
Seasonal variations obtained in simWMA(Fig. 4) allow us to trace the annual “history” of the WMA region: during the winter period, vertical mixing intensifies and replenishes the surface layer in DIP but not in DIN, as the nitracline is deeper than the MLD (70 m), whereas the phosphacline is shallower (Fig. 3a and b). The newly available DIP in the surface layer is immediately followed by an increase in N2fixation rates
in June (Fig. 3c), which then remain quite stable until Octo-ber before slightly decreasing until the next winter mixing. There is a close relationship between DIP availability and the N2fixation rates since N2fixation decreases as the DIP
concentration decreases with the DIP’s gradual consumption after the mixing period. Because N2fixation provides a new
source of N (characterized by a rapid turnover time, as it is immediately used and transferred into the ecosystem), the DIP is consumed, thereby generating seasonal variations in the surface layer. Although autotrophs are dominated by N2
fixers, N2fixation benefits the entire planktonic trophic web
and enhances the surface production which is directly con-trolled by nutrient availability. We therefore observe surface
seasonal variations in Chl asimWMA and POCsimWMA, with maximum values from October to the end of March, and a less intense and deeper signal around 70 m (which corre-sponds to the nitracline depth from April to the end of May). During the stratified period, when N2fixation is lowest,
non-diazotroph organisms grow deeper where DIN is available. The temporal evolution of simWGY is not shown here as there is no seasonal variation associated with N2 fixation,
which is the focus of the study presented here. The absence of diazotrophy leads to a deepening of the nitracline and avail-able DIN is deeper. DIP is never exhausted in the surface layer because the model implicitly assumes iron limitation to prevent N2fixation. The maximum biomass and DCM are
constant throughout the year, significantly less intense than in simWMA and located near the nitracline around 200 m.
5 Conclusions
The purpose of this study was to investigate the direct and/or indirect role of N2 fixation in surface planktonic
produc-tion and biogeochemical C, N, and P cycles, with the aim of determining whether the main biogeochemical differences observed in the MA and in the SPG areas could be ex-plained or not by diazotrophy. For this purpose, a new cou-pled one-dimensional physical–biogeochemical model has been built based on the Eco3M-Med model. Two simulations were designed, only differing by the presence/absence of di-azotrophs. They enabled us to reasonably reproduce the main biogeochemical characteristics of the two areas (WMA and WGY). The model could also reproduce the high contrast between the two regions, such as (i) the high/low DIP avail-ability, respectively, associated with significant/negligible N2
fixation and surface production, (ii) the higher/lower depth of the nutriclines characteristic of oligotrophic (WMA)/ultra-oligotrophic (WGY) regions, and (iii) the large/small gap be-tween DIN and DIP nutriclines and the subsequent conse-quences for nutrient input in the surface layer during winter mixing.
Winter mixing allows the annual replenishment of the surface layer in excess P, creating ideal conditions for dia-zotroph growth and intensive N2fixation. The development
of diazotrophs can counteract DIN limitation for the entire planktonic trophic web in the photic layer in the WMA, which leads to significant seasonal variations due to the pro-gressive exhaustion of DIP after winter mixing. Throughout the year, we then showed a shift from N to P limitation of the planktonic community growth in the MA. The strong influ-ence of seasonal variations shown by the simulations in the WTSP, and generally not considered in tropical areas, needs to be further studied and backed up by in situ observations.
Data availability. All data and metadata are available at the French INSU/CNRS LEFE CYBER database (scientific coordinator: Hervé
Claustre; data manager, webmaster: Catherine Schmechtig) at the following web address: http://www.obs-vlfr.fr/proof/php/outpace/ outpace.php, INSU/CNRS LEFE CYBER (2017).
Supplement. The supplement related to this article is available online at: https://doi.org/10.5194/bg-15-6573-2018-supplement.
Competing interests. The authors declare that they have no conflict of interest.
Special issue statement. This article is part of the special issue “In-teractions between planktonic organisms and biogeochemical cy-cles across trophic and N2fixation gradients in the western tropical
South Pacific Ocean: a multidisciplinary approach (OUTPACE ex-periment)”. It is not associated with a conference.
Acknowledgements. This is a contribution of the OUTPACE (Oligotrophy from Ultra-oligoTrophy PACific Experiment) project (https://outpace.mio.univ-amu.fr/, last access: 8 Oc-tober 2018) funded by the French research national agency (ANR-14-CE01-0007-01), the LEFE-CyBER program (CNRS-INSU), the GOPS program (IRD), the CNES, and the European FEDER Fund under project 1166-39417. The OUTPACE cruise (https://doi.org/10.17600/15000900) was managed by the MIO (OSU Institut Pytheas, AMU) from Marseilles (France). The authors thank the crew of the R/V L’Atalante for outstanding shipboard operation. Gilles Rougier and Marc Picheral are warmly thanked for their efficient help in CTD rosette management and data processing, as is Catherine Schmechtig for the LEFE CYBER database management. The authors also acknowledge the staff of the “Cluster de calcul intensif HPC” platform of the OSU Institut Pythéas (Aix-Marseille Université, INSU-CNRS) for providing the computing facilities. Finally, the authors gratefully acknowledge Maurice Libes and Christophe Yohia from the Service Informatique de Pythéas (SIP) for technical assistance and for providing the atmospheric forcings for the present modeling study.
Edited by: Laurent Mémery
Reviewed by: two anonymous referees
References
Agawin, N. S., Rabouille, S., Veldhuis, M. J., Servatius, L., Hol, S., van Overzee, H. M., and Huisman, J.: Competition and fa-cilitation between unicellular nitrogen-fixing cyanobacteria and non—nitrogen-fixing phytoplankton species, Limnol. Oceanogr., 52, 2233–2248, 2007.
Alekseenko, E., Raybaud, V., Espinasse, B., Carlotti, F., Queguiner, B., Thouvenin, B., Garreau, P., and Baklouti, M.: Seasonal dy-namics and stoichiometry of the planktonic community in the NW Mediterranean Sea; a 3D modeling approach, Ocean Dy-nam., 64, 179–207, 2014.
Baklouti, M., Faure, V., Pawlowski, L., and Sciandra, A.: Investi-gation and sensitivity analysis of a mechanistic phytoplankton model implemented in a new modular numerical tool (Eco3M) dedicated to biogeochemical modelling, Prog. Oceanogr., 71, 34–58, https://doi.org/10.1016/j.pocean.2006.05.003, 2006. Bates, N. R. and Hansell, D. A.: Temporal variability
of excess nitrate in the subtropical mode water of the North Atlantic Ocean, Marine Chem., 84, 225–241, https://doi.org/10.1016/j.marchem.2003.08.003, 2004.
Behrenfeld, M. J., O’Malley, R. T., Siegel, D. A., McClain, C. R., Sarmiento, J. L., Feldman, G. C., Milligan, A. J., Falkowski, P. G., Letelier, R. M., and Boss, E. S.: Climate-driven trends in contemporary ocean productivity, Nature, 444, 752–755, https://doi.org/10.1038/nature05317, 2006.
Benavides, M., Agawin, N., Aristegui, J., Penne, J., and Stal, L.: Dissolved organic nitrogen and carbon release by a marine uni-cellular diazotrophic cyanobacterium, Aquat. Microb. Ecol., 69, 69–80, 2013.
Berthelot, H., Bonnet, S., Camps, M., Grosso, O., and Moutin, T.: Assessment of the dinitrogen released as ammonium and dis-solved organic nitrogen by unicellular and filamentous marine diazotrophic cyanobacteria grown in culture, Front. Mar. Sci., 2, 80, https://doi.org/10.3389/fmars.2015.00080, 2015.
Bonnet, S., Caffin, M., Berthelot, H., and Moutin, T.: Hot spot of N2 fixation in the western tropical South Pa-cific pleads for a spatial decoupling between N2 fixation and denitrification, P. Natl. Acad. Sci., 114, E2800–E2801, https://doi.org/10.1073/pnas.1619514114, 2017.
Bratbak, G.: Bacterial Biovolume and Biomass Estimations, Appl. Environ. Microbiol., 49, 1488–1493, 1985.
Bronk, D. A. and Ward, B. B.: Magnitude of dissolved or-ganic nitrogen release relative to gross nitrogen uptake in marine systems, Limnol. Oceanogr., 45, 1879–1883, https://doi.org/10.4319/lo.2000.45.8.1879, 2000.
Caffin, M., Moutin, T., Foster, R. A., Bouruet-Aubertot, P., Dogli-oli, A. M., Berthelot, H., Guieu, C., Grosso, O., Helias-Nunige, S., Leblond, N., Gimenez, A., Petrenko, A. A., de Verneil, A., and Bonnet, S.: N2 fixation as a dominant new N source in
the western tropical South Pacific Ocean (OUTPACE cruise), Biogeosciences, 15, 2565–2585, https://doi.org/10.5194/bg-15-2565-2018, 2018.
Capone, D. G., Zehr, J. P., Paerl, H. W., Bergman, B., and Carpenter, E. J.: Trichodesmium, a globally significant marine cyanobac-terium, Science, 276, 1221–1229, 1997.
Capone, D. G., Burns, J. A., Montoya, J. P., Subramaniam, A., Mahaffey, C., Gunderson, T., Michaels, A. F., and Carpen-ter, E. J.: Nitrogen fixation by Trichodesmium spp.: An im-portant source of new nitrogen to the tropical and subtropical North Atlantic Ocean, Global Biogeochem. Cy., 19, GB2024, https://doi.org/10.1029/2004GB002331, 2005.
Cermeño, P., Dutkiewicz, S., Harris, R. P., Follows, M., Schofield, O., and Falkowski, P. G.: The role of nutricline depth in regu-lating the ocean carbon cycle, P. Natl. Acad. Sci., 105, 20344– 20349, https://doi.org/10.1073/pnas.0811302106, 2008. Claustre, H., Sciandra, A., and Vaulot, D.: Introduction to the
special section bio-optical and biogeochemical conditions in the South East Pacific in late 2004: the BIOSOPE program, Biogeosciences, 5, 679–691, https://doi.org/10.5194/bg-5-679-2008, 2008.
Coles, V. J. and Hood, R. R.: Modeling the impact of iron and phos-phorus limitations on nitrogen fixation in the Atlantic Ocean, Biogeosciences, 4, 455–479, https://doi.org/10.5194/bg-4-455-2007, 2007.
Cotner, J. B., Hall, E. K., Scott, T., and Heldal, M.: Fresh-water Bacteria are Stoichiometrically Flexible with a Nu-trient Composition Similar to Seston, Front. Microbiol., 1, https://doi.org/10.3389/fmicb.2010.00132, 2010.
de Baar, H. J. W.: Von Liebig’s law of the minimum and plankton ecology (1899–1991), Prog. Oceanogr., 33, 347–386, https://doi.org/10.1016/0079-6611(94)90022-1, 1994.
de Verneil, A., Rousselet, L., Doglioli, A. M., Petrenko, A. A., Maes, C., Bouruet-Aubertot, P., and Moutin, T.: OUTPACE long duration stations: physical variability, context of biogeochemical sampling, and evaluation of sampling strategy, Biogeosciences, 15, 2125–2147, https://doi.org/10.5194/bg-15-2125-2018, 2018. Dutheil, C., Aumont, O., Gorguès, T., Lorrain, A., Bonnet, S., Rodier, M., Dupouy, C., Shiozaki, T., and Menkes, C.: Modelling N2fixation related to Trichodesmium sp.: driving processes and impacts on primary production in the tropical Pacific Ocean, Biogeosciences, 15, 4333–4352, https://doi.org/10.5194/bg-15-4333-2018, 2018.
Dutkiewicz, S., Ward, B. A., Scott, J. R., and Follows, M. J.: Un-derstanding predicted shifts in diazotroph biogeography using resource competition theory, available at: http://dspace.mit.edu/ handle/1721.1/92505 (last access: 4 October 2018), 2014. Falkowski, P. G.: Evolution of the nitrogen cycle and its influence
on the biological sequestration of CO2in the ocean, Nature, 387, 272–275, https://doi.org/10.1038/387272a0, 1997.
Falkowski, P. G., Barber, R. T., and Smetacek, V.: Biogeochemical controls and feedbacks on ocean primary production, Science, 281, 200–206, 1998.
Fennel, K., Spitz, Y. H., Letelier, R. M., Abbott, M. R., and Karl, D. M.: A deterministic model for N2fixation at stn. ALOHA in
the subtropical North Pacific Ocean, Deep Sea Res. Pt. II, 49, 149–174, 2002.
Fumenia, A., Moutin, T., Bonnet, S., Benavides, M., Petrenko, A., Helias Nunige, S., and Maes, C.: Excess nitrogen as a marker of intense dinitrogen fixation in the Western Tropical South cific Ocean: impact on the thermocline waters of the South Pa-cific, Biogeosciences Discuss., https://doi.org/10.5194/bg-2017-557, in review, 2018.
Gaspar, P.: Modeling the Seasonal Cycle of the Upper Ocean, J. Phys. Oceanogr., 18, 161–180, https://doi.org/10.1175/1520-0485(1988)018<0161:MTSCOT>2.0.CO;2, 1988.
Gaspar, P., Grégoris, Y., and Lefevre, J.-M.: A simple eddy kinetic energy model for simulations of the oceanic vertical mixing: Tests at station Papa and long-term upper ocean study site, J. Geophys. Res., 95, 16179, https://doi.org/10.1029/JC095iC09p16179, 1990.
Gimenez, A., Baklouti, M., Bonnet, S., and Moutin, T.: Bio-geochemical fluxes and fate of diazotroph-derived nitrogen in the food web after a phosphate enrichment: modeling of the VAHINE mesocosms experiment, Biogeosciences, 13, 5103– 5120, https://doi.org/10.5194/bg-13-5103-2016, 2016.
Goldman, J. C. and Dennett, M. R.: Growth of marine bacteria in batch and continuous culture under carbon and nitrogen limitation, Limnol. Oceanogr., 45, 789–800, https://doi.org/10.4319/lo.2000.45.4.0789, 2000.
Grimaud, G. M., Dron, A., Rabouille, S., Sciandra, A., and Bernard, O.: Modelling light-dark regime influence on the carbon-nitrogen metabolism in a unicellular diazotrophic cyanobacterium, in: CAB, available at: http://hal.upmc.fr/hal-00854479 (last access: 8 October 2018), 2013.
Gruber, N.: The dynamics of the marine nitrogen cycle and its influ-ence on atmospheric CO2variations, in: The ocean carbon cycle
and climate, 97–148, Springer, 2004.
Gruber, N. and Sarmiento, J. L.: Global patterns of marine nitrogen fixation and denitrification, Global Biogeochem. Cy., 11, 235– 266, https://doi.org/10.1029/97GB00077, 1997.
Guieu, C., Bonnet, S., Petrenko, A., Menkes, C., Chavagnac, V., Desboeufs, K., Maes, C., and Moutin, T.: Iron from a sub-marine source impacts the productive layer of the Western Tropical South Pacific (WTSP), Scientific Reports, 8, 9075, https://doi.org/10.1038/s41598-018-27407-z, 2018.
Hansell, D. A., Bates, N. R., and Olson, D. B.: Excess nitrate and nitrogen fixation in the North Atlantic Ocean, Marine Chem., 84, 243–265, https://doi.org/10.1016/j.marchem.2003.08.004, 2004. Holl, C. M. and Montoya, J. P.: Diazotrophic growth of the marine yanobacterium Trichodesmium Ims101 in con-tinuous culture: effects of growth rate on N2-fixation rate,
biomass, and C:N:P stoichiometry, J. Phycol., 44, 929–937, https://doi.org/10.1111/j.1529-8817.2008.00534.x, 2008. Hutchins, D. A., Fu, F.-X., Zhang, Y., Warner, M. E., Feng, Y.,
Portune, K., Bernhardt, P. W., and Mulholland, M. R.: CO2 control of Trichodesmium N2 fixation, photosynthesis, growth rates, and elemental ratios: Implications for past, present, and fu-ture ocean biogeochemistry, Limnol. Oceanogr., 52, 1293–1304, https://doi.org/10.4319/lo.2007.52.4.1293, 2007.
Karl, D. and Letelier, R.: Nitrogen fixation-enhanced carbon se-questration in low nitrate, low chlorophyll seascapes, Mar. Ecol. Prog. Ser., 364, 257–268, https://doi.org/10.3354/meps07547, 2008.
Karl, D., Letelier, R., Tupas, L., Dore, J., Christian, J., and Hebel, D.: The role of nitrogen fixation in biogeochemical cycling in the subtropical North Pacific Ocean, Nature, 388, 533–538, https://doi.org/10.1038/41474, 1997.
Karl, D., Michaels, A., Bergman, B., Capone, D., Carpenter, E., Letelier, R., Lipschultz, F., Paerl, H., Sigman, D., and Stal, L.: Dinitrogen fixation in the world’s oceans, Biogeochemistry, 57-58, 47–98, https://doi.org/10.1023/A:1015798105851, 2002. Landolfi, A., Oschlies, A., and Sanders, R.: Organic nutrients and
excess nitrogen in the North Atlantic subtropical gyre, Bio-geosciences, 5, 1199–1213, https://doi.org/10.5194/bg-5-1199-2008, 2008.
Law, C. S., Woodward, E. M. S., Ellwood, M. J., Marriner, A., Bury, S. J., and Safi, K. A.: Response of surface nu-trient inventories and nitrogen fixation to a tropical cyclone in the southwest Pacific, Limnol. Oceanogr., 56, 1372–1385, https://doi.org/10.4319/lo.2011.56.4.1372, 2011.
Locarnini, R. A., Mishonov, A. V., Antonov, J. I., Boyer, T. P., Gar-cia, H. E., Baranova, O. K., Zweng, M. M., Paver, C. R., Rea-gan, J. R., Johnson, D. R., Hamilton, M., and Seidov, D.: World ocean atlas 2013. Volume 1, Temperature, Tech. rep., NOAA At-las NESDIS 73, https://doi.org/10.7289/V55X26VD, 2013. Luo, Y.-W., Doney, S. C., Anderson, L. A., Benavides, M.,
Berman-Frank, I., Bode, A., Bonnet, S., Boström, K. H., Böttjer, D., Capone, D. G., Carpenter, E. J., Chen, Y. L., Church, M. J.,