HAL Id: ird-02897026
https://hal.ird.fr/ird-02897026
Submitted on 28 May 2021
HAL is a multi-disciplinary open access
archive for the deposit and dissemination of
sci-entific research documents, whether they are
pub-lished or not. The documents may come from
teaching and research institutions in France or
abroad, or from public or private research centers.
L’archive ouverte pluridisciplinaire HAL, est
destinée au dépôt et à la diffusion de documents
scientifiques de niveau recherche, publiés ou non,
émanant des établissements d’enseignement et de
recherche français ou étrangers, des laboratoires
publics ou privés.
Distributed under a Creative Commons Attribution| 4.0 International License
Anopheles nili in sub-Saharan Africa
Cyrille Ndo, Christophe Antonio-Nkondjio, Anna Cohuet, Diego Ayala, Pierre
Kengne, Isabelle Morlais, Parfait Awono-Ambéné, Daniel Couret, Pierre
Ngassam, Didier Fontenille, et al.
To cite this version:
Cyrille Ndo, Christophe Antonio-Nkondjio, Anna Cohuet, Diego Ayala, Pierre Kengne, et al..
Popu-lation genetic structure of the malaria vector Anopheles nili in sub-Saharan Africa. Malaria Journal,
BioMed Central, 2010, 9 (1), �10.1186/1475-2875-9-161�. �ird-02897026�
Open Access
R E S E A R C H
© 2010 Ndo et al; licensee BioMed Central Ltd. This is an Open Access article distributed under the terms of the Creative Commons At-tribution License (http://creativecommons.org/licenses/by/2.0), which permits unrestricted use, disAt-tribution, and reproduction in any medium, provided the original work is properly cited.
Research
Population genetic structure of the malaria vector
Anopheles nili in sub-Saharan Africa
Cyrille Ndo*
1,2, Christophe Antonio-Nkondjio
1, Anna Cohuet
3,4, Diego Ayala
3, Pierre Kengne
1,3, Isabelle Morlais
1,3,
Parfait H Awono-Ambene
1, Daniel Couret
3,4, Pierre Ngassam
2, Didier Fontenille
3and Frédéric Simard
3,4Abstract
Background: Anopheles nili is a widespread efficient vector of human malaria parasites in the humid savannas and
forested areas of sub-Saharan Africa. Understanding An. nili population structure and gene flow patterns could be useful for the development of locally-adapted vector control measures.
Methods: Polymorphism at eleven recently developed microsatelitte markers, and sequence variation in four genes
within the 28s rDNA subunit (ITS2 and D3) and mtDNA (COII and ND4) were assessed to explore the level of genetic variability and differentiation among nine populations of An. nili from Senegal, Ivory Coast, Burkina Faso, Nigeria, Cameroon and the Democratic Republic of Congo (DRC).
Results: All microsatellite loci successfully amplified in all populations, showing high and very similar levels of genetic
diversity in populations from West Africa and Cameroon (mean Rs = 8.10-8.88, mean He = 0.805-0.849) and much lower diversity in the Kenge population from DRC (mean Rs = 5.43, mean He = 0.594). Bayesian clustering analysis of microsatellite allelic frequencies revealed two main genetic clusters in the dataset. The first one included only the Kenge population and the second grouped together all other populations. High Fst estimates based on microsatellites (Fst > 0.118, P < 0.001) were observed in all comparisons between Kenge and all other populations. By contrast, low Fst estimates (Fst < 0.022, P < 0.05) were observed between populations within the second cluster. The correlation between genetic and geographic distances was weak and possibly obscured by demographic instability. Sequence variation in mtDNA genes matched these results, whereas low polymorphism in rDNA genes prevented detection of any population substructure at this geographical scale.
Conclusion: Overall, high genetic homogeneity of the An. nili gene pool was found across its distribution range in
West and Central Africa, although demographic events probably resulted in a higher level of genetic isolation in the marginal population of Kenge (DRC). The role of the equatorial forest block as a barrier to gene flow and the implication of such findings for vector control are discussed.
Background
The recent shift in strategic emphasis from malaria con-trol to elimination and eradication has highlighted major gaps in knowledge that need to be addressed before such achievement is contemplated [1-3]. Vector control is a cornerstone of malaria prevention strategies and it has been widely acknowledged that renewed efforts in this field should be considered a central aspect of the new malaria eradication strategy [4-6]. Basic knowledge in
mosquito vectors biology, ecology and genetics is cru-cially needed for the development of innovative, inte-grated and biologically lucid vector management strategies. This is especially true in the malaria heartlands of sub-Saharan Africa, where a number of mosquito spe-cies efficiently transmit malaria to humans simultane-ously, or replace each other seasonally sustaining year-round transmission [7-9]. Any strategy aiming at reduc-ing transmission down to the level where elimination is within reach will need to transcend the relevant biodiver-sity of the malaria vector system. However to date, most studies in Africa focused on Anopheles gambiae s.l. and, to a lesser extent, Anopheles funestus whereas research on
* Correspondence: cyrndo@yahoo.fr
1 Laboratoire de Recherche sur le Paludisme, Organisation de Coordination
pour la lutte Contre les Endémies en Afrique Centrale (OCEAC), P.O. Box 288, Yaoundé, Cameroon
other important vectors has critically lagged behind. Here, the first results of a large-scale population genetics analysis of the level and distribution of (neutral) genetic diversity in the mosquito Anopheles nili are presented.
Anopheles nili is a widespread efficient vector of
Plas-modium parasites in the humid savannas and forested areas of sub-Saharan Africa [9-14]. It is the nominal taxon of a group of closely related species including An. nili
sensu stricto, Anopheles somalicus, Anopheles carnevalei and Anopheles ovengensis [7,15]. The members of this group can be distinguished through slight morphologic diagnostic characters observable at the larval and/or adult stages [15,16] and a molecular diagnostic tool based on segregating sequence differences in the Internal Tran-scribed Spacer 2 (ITS2) of the ribosomal DNA (rDNA) [17]. Of these four species, An. nili s.s. (hereafter An. nili) is the most important malaria vector although An.
car-nevalei and An. ovengensis have been found infected with
Plasmodium falciparum in natural conditions [9,15,18].
Anopheles somalicus is mainly zoophilic and is not involved in human malaria transmission [19,20]. Infec-tion rates reaching 3% have been observed in An. nili and the species was shown to sustain entomological inocula-tion rates over 200 infected bites per man per year in vil-lages close to fast running streams and rivers where its larvae develop [9-11,18]. Recent investigations of the eco-logical requirements of An. nili in Cameroon, a country in Central Africa at the core of the species range, showed that lotic rivers exposed to sunlight, with vegetation or debris were the best predictors of An. nili larval abun-dance [21] and that habitats characterized by high water vapor pressure and rainfall, as typically observed in for-est-savanna transition areas were of highest quality for the development of the species [14]. Anopheles nili how-ever is scarce in deep forest environments, where it is replaced by other members of the group, namely An.
car-nevalei and An. ovengensis [18,21]. The strong reliance of
An. nili on permanent aquatic habitats for larval develop-ment suggests a patchy geographic distribution through-out the species' range, owing to the discontinuous nature of the hydrographic networks. This may lead to signifi-cant population genetic structure and behavioural differ-entiation. However, to date, very few studies have addressed the level and extent of genetic structuring within and between An. nili populations in sub-Saharan Africa. Sequence variation in two nuclear loci within the rDNA cluster (e.g., ITS2 and D3 domain in the 28S rDNA subunit, [17]) and isoenzymes [22] did not reveal any sig-nature of genetic heterogeneity among An. nili popula-tions collected throughout south Cameroon. However, the low polymorphism of the genetic markers used and the limited geographical scales covered by these studies precludes extrapolation of these findings outside of the study area and calls for further investigations.
Here, genetic polymorphism in An. nili was investi-gated and compared among collections from nine loca-tions from throughout its distribution range in West and Central Africa using 11 recently described nuclear micro-satellite DNA markers [23] and sequence variation in two nuclear (rDNA) and two mitochondrial (mtDNA) genes. It is shown that recently developed microsatellite markers are suitable tools to explore the population genetic struc-ture of wild An. nili in Africa. All molecular markers sug-gested that An. nili populations from West Africa are genetically homogeneous with very low levels of genetic differentiation between them, whereas the rainforest domain in Central Africa might act as a geographical bar-rier to gene flow. Implications of these findings for vector control are discussed and areas for future research are highlighted.
Methods
Mosquito sampling and field processing of specimens Mosquitoes were collected between June 2006 and March 2008 in nine localities across six countries from West and Central Africa (Figure 1), including Kedougou (12°38'N, 12°14'W) in Senegal, Soumousso (11°01'N, 4°03'W) in Burkina Faso, Gansé (8°37'N, 3°54'W) in Ivory Coast, Akaka (6°58'N, 3°44'E) in Nigeria, Simbock (3°49'N, 11°28'E), Mbébé (4°10'N, 11°04'E), Magba (5°57'N, 11°13'E) and Tibati (6°28'N, 12°36'E) in Cameroon and Kenge (5°19'S, 19°58'E) in the Democratic Republic of Congo (DRC). All these sites are located along different river systems in humid savanna areas except Simbock and Mbébé situated in the degraded forest area of southern Cameroon. The closest localities were Simbock and Mbébé situated 60 km apart, and the most distant ones were Kedougou and Kenge situated c.a. 3,000 km apart (Figure 1).
Anopheline female mosquitoes were collected by human landing catches and/or indoor pyrethrum spray catches. In the field, An. nili s.l. specimens were visually sorted from other anophelines according to morphologi-cal identification keys [19,24]. All specimens were stored individually in tubes containing a desiccant. All tubes were kept at -20°C until further analysis.
DNA extraction and molecular identification
Genomic DNA was extracted from whole mosquito using a standard protocol described earlier [25]. Since distinc-tion between members of the An. nili group is often diffi-cult in the field because of very slight and stage-specific diagnostic differences between species, the molecular diagnostic PCR-based assay [17] was then performed to confirm morphological identification. Only An. nili mos-quitoes were included in the analysis.
Microsatellite genotyping and analysis
Anopheles nili mosquitoes were genotyped at eleven mic-rosatellite loci (Table 1) [23]. All micmic-rosatellite loci are dinucleotide repeats. One primer of each pair was labeled with a 5' fluorescent dye (NED, PET, VIC or 6-FAM) to allow multiplex electrophoresis. PCR amplifications were carried out in 15 μL reaction volume from approximately 2 μL of template DNA (1/50 of the crude extract). The reaction mixture contained 1× PCR buffer (5 Prime Inc., Gaithersburg, USA), 1 mM MgCl2, 0.2 mM of each dNTP, 8 pmoles of each primer and 0.15 unit of Taq DNA Poly-merase (5 Prime Inc.). Amplification runs were per-formed under the following conditions: an initial denaturation step at 94°C for 4 min followed by 35 cycles of 30 s at 94°C, 30 s at the appropriate annealing tempera-ture (52°C to 56°C, see [23]) and 30 s at 68°C, followed by a final elongation step of 20 min at 68°C. PCR products were pooled with other compatible products according to allele size range and fluorescent dye. Mixtures were run on an ABI 3130XL DNA sequencer (Applied Biosystems, Foster City, USA) using 500 Liz internal size standard. Fragments (allele) sizes and genotypes were scored using GENEMAPPER V4.0 software (Applied Biosystems).
Genetic diversity by locus, within each geographical population and overall was assessed by estimates of allelic richness [26] and allelic frequencies using FSTAT V2.9.3 [27]. Allelic richness was used instead of the number of alleles per locus to account for differences in sample sizes. Estimates of expected heterozygosity under Hardy-Weinberg equilibrium [28] were obtained using GENETIX V4.02 [29].
Goodness-of-fit to Hardy-Weinberg equilibrium (HWE) for each locus and linkage disequilibrium between all pairs of loci were assessed using FSTAT, for each geographical population and overall. Whether devi-ations from HWE resulted from a deficit or an excess of heterozygotes was tested using F-statistics [30]. Signifi-cance tests were conducted using a randomization approach as implemented in FSTAT. The frequency of null alleles at each locus within each population was determined using GENEPOP V4.0 [31,32], and the allele and genotype frequencies were then adjusted accordingly in MICROCHECKER V2.2.3 [33]. The null allele adjusted dataset was compared to the original dataset to explore the effect of null alleles on estimations of genetic differen-tiation.
Table 1: Genetic variability at 11 microsatellite loci in nine An. nili populations from sub-Saharan Africa
Senegal B. Faso Ivory C. Nigeria Cameroon DRC All
Locus Kedougou Soumousso Gansé Akaka Tibati Magba Mbebe Simbock Kenge samples
(44) (40) (41) (14) (41) (42) (36) (42) (41) (341) 1D80 Rs 10.52 10.14 10.39 12.43 10.87 10.63 7.62 8.07 6.23 9.99 He 0.918 0.908 0.911 0.952 0.920 0.910 0.831 0.815 0.754 0.880 Fis 0.071 -0.014 0.043 0.048 0.214** * 0.123* -0.102 -0.007 0.072 0.077*** 1A27 Rs 12.80 12.42 13.17 13.41 12.70 10.93 11.47 11.36 6.98 12.39 He 0.946 0.943 0.953 0.953 0.949 0.926 0.930 0.930 0.831 0.929 Fis 0.281*** 0.245*** 0.229*** 0.04 0.032 0.144** 0.049 0.182*** 0.416** * 0.204*** 2Ateta Rs 9.10 9.71 9.03 9.62 9.33 8.49 9.29 8.77 4.55 9.00 He 0.895 0.901 0.876 0.879 0.875 0.866 0.896 0.879 0.395 0.829 Fis -0.031 0.017 -0.028 -0.146 0.053 0.043 0.165* 0.03 -0.012 0.083*** A14 Rs 5.87 6.63 6.60 4.31 6.34 6.92 5.38 5.47 1.61 5.84 He 0.695 0.745 0.737 0.499 0.732 0.772 0.655 0.675 0.077 0.621 Fis 0.318*** 0.295*** 0.036 -0.247 0.101 -0.052 -0.051 -0.017 -0.028 0.121*** A154 Rs 8.46 8.92 9.25 8.17 9.88 8.79 9.10 7.48 8.41 9.68 He 0.796 0.830 0.837 0.841 0.854 0.788 0.778 0.736 0.800 0.807 Fis 0.406*** 0.274*** 0.194*** 0.243*** 0.252** * 0.08 0.194*** 0.016 -0.126* 0.203*** 2C157 Rs 5.55 4.83 4.82 5.99 4.70 5.32 5.47 5.73 2.25 5.04 He 0.728 0.707 0.657 0.651 0.713 0.743 0.702 0.778 0.505 0.687 Fis 0.074 0.058 -0.067 -0.102 -0.017 0.044 0.079 -0.049 0.211 0.046 F56 Rs 9.89 9.33 10.56 10.06 10.06 9.61 10.02 7.80 4.56 9.36 He 0.904 0.890 0.918 0.900 0.903 0.898 0.903 0.847 0.561 0.858 Fis 0.07 0.059 0.08 -0.117 0.179** * 0.054 0.116* 0.050 0.409** * 0.131*** B115 Rs 8.29 8.03 7.32 6.99 6.92 7.63 6.92 7.98 3.49 7.23 He 0.857 0.852 0.843 0.723 0.831 0.854 0.824 0.859 0.395 0.782 Fis 0.084 0.091 0.006 -0.179 -0.057 -0.021 0.227 -0.052 0.074 0.089*** F41 Rs 12.53 12.96 12.83 12.41 12.49 12.42 12.54 12.62 8.47 12.62 He 0.945 0.947 0.947 0.942 0.944 0.943 0.943 0.944 0.755 0.923 Fis 0.028 -0.001 0.038 -0.064 0.023 -0.033 -0.061 -0.005 0.007 0.022
To investigate biased genetic differentiation caused by demographic instability such as bottlenecks and/or popu-lation expansion, heterozygosity tests were implemented to test for Mutation-Drift Equilibrium (MDE) using BOTTLENECK V1.0.02 [34]. BOTTLENECK compares two estimates of expected heterozygosity, one based on allele frequencies (He) and the other based on the num-ber of alleles and sample size (Heq). In a population at MDE, both estimates should not differ significantly (He ≈
Heq). If a population experiences a bottleneck, rare alleles will be lost by genetic drift, and Heq will decrease faster than He (He > Heq). The resulting apparent excess of heterozygotes is an indicator of recent bottleneck event, whereas the opposite (He <Heq) may signal an expansion process. Estimates of Heq were computed using two mutation models for microsatellites evolution: the Two-Phased Mutation model (TPM) [35] with fractions of multistep mutations set to 30%, 20% and 10%, and the Stepwise Mutation Model (SMM) [36]. Wilcoxon signed-rank tests were used to determine whether deviations from MDE were statistically significant.
Population genetic differentiation was measured by the fixation index Fst [30,37] and statistical significance was assessed by the exact test of genotypic differentiation available in FSTAT. Isolation by distance was investigated as a potential cause of genetic structuring using the Man-tel test implemented in GENEPOP. The correlation between pairwise genetic differentiation and geographi-cal distance was assessed by the regression of Fst/1-Fst on the logarithm of geographical distances between sam-pling sites [38]. The Bonferroni correction was used throughout to account for multiple testing [39].
Finally, a Bayesian clustering analysis was carried out using STRUCTURE V2.1 to cluster individuals into K groups while minimizing Hardy-Weinberg disequilib-rium and gametic phase disequilibdisequilib-rium between loci within groups, with no a priori assumptions [40,41]. The software was run with the option of admixture, allowing for some mixed ancestry within individuals, and α was allowed to vary. Ten independent runs were done for each value of K (1 to 5), with a burn-in period of 100,000 itera-tions and 100,000 replicaitera-tions. The method implemented by Evanno et al [42] was used to estimate the most likely number of clusters in the dataset.
DNA sequencing and analysis
Sequence variation was examined in the second Internal Transcribed Spacer (ITS2) and Domain-3 (D3) of nuclear 28S rDNA, and in the Cytochrome oxidase subunit II (COII) and the NADH deshydrogenase subunit IV (ND4) genes on mitochondrial DNA (mtDNA). Ten specimens per sites, among those used for microsatellite analysis, were randomly selected for sequencing. The ITS2, D3, COII and ND4 regions were amplified in 25 μL reaction mixtures containing 2.5 μL of 10× reaction buffer (QIA-GEN, Courtaboeuf, France), 200 μM of each dNTP (Eurogentec, Angers, France), 0.5 unit of Taq DNA poly-merase, and 10 pmol each of the forward and reverse primers. ITS2 and D3 rDNA regions were amplified using the primers sets ITS2a/ITS2b and D3a/D3b described in Kengne et al [17]. COII and ND4 were amplified using the following primers:
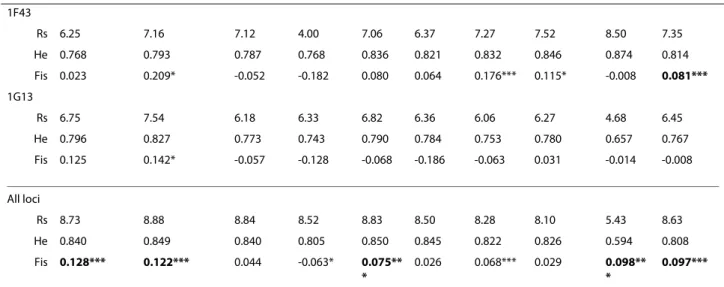
COIIF: 5'-TCTAATATGGGAGATTAGTGC-3' (For-ward) 1F43 Rs 6.25 7.16 7.12 4.00 7.06 6.37 7.27 7.52 8.50 7.35 He 0.768 0.793 0.787 0.768 0.836 0.821 0.832 0.846 0.874 0.814 Fis 0.023 0.209* -0.052 -0.182 0.080 0.064 0.176*** 0.115* -0.008 0.081*** 1G13 Rs 6.75 7.54 6.18 6.33 6.82 6.36 6.06 6.27 4.68 6.45 He 0.796 0.827 0.773 0.743 0.790 0.784 0.753 0.780 0.657 0.767 Fis 0.125 0.142* -0.057 -0.128 -0.068 -0.186 -0.063 0.031 -0.014 -0.008 All loci Rs 8.73 8.88 8.84 8.52 8.83 8.50 8.28 8.10 5.43 8.63 He 0.840 0.849 0.840 0.805 0.850 0.845 0.822 0.826 0.594 0.808 Fis 0.128*** 0.122*** 0.044 -0.063* 0.075** * 0.026 0.068*** 0.029 0.098** * 0.097*** Rs: Allele richness; He: Nei's unbiased estimate of expected heterozygosity [28]. All loci/All samples: mean values across loci/populations; *P < 0.05,
**P < 0.01 and ***P < 0.001 (single test level); In bold: significant (P < 0.05) heterozygote deficits according to exact tests against Hardy-Weinberg proportions after correction for multiple testing by the sequential Bonferroni procedure [39]; Fis was calculated according to [30]; In parenthesis: sample size. B. Faso: Burkina Faso, Ivory C.: Ivory Coast, DRC: Democratic Republic of Congo.
COIIR: 5'-ACTTGCTTTCAGTCATCTAATG-3' (Reverse) ND4F: 5'-TGATTGCCTAAGGCTCATGT-3' (For-ward) ND4R: 5'-TTCGGCTTCCTAGTCGTTCAT-3' (Reverse)
The PCR conditions included an initial denaturation step at 94°C for 3 min, followed by 35 cycles at 94°C for 30 s, 55°C for 30 s, and 72°C for 45 s, with a final extension step at 72°C for 10 min. After DNA analysis by electro-phoresis, PCR products were purified and used for sequencing in both directions with the previous primers, on an ABI 3130XL DNA sequencer (Applied Biosystems). Sequences were inspected and corrected, where neces-sary, using SEQSCAPE software (Applied Biosystems). Multiple sequence alignments for each gene were per-formed using MEGA V3.0 [43] and CLUSTALX [44]. Summary DNA sequence polymorphism statistics and measures of divergence were computed using DnaSP V4.10.9. [45]. Statistical tests of Tajima [46], Fu and Li [47] and Fu [48] also implemented in DnaSP were used to test for non neutral evolution and deviation from MDE. Phylogenetic relationships between An. nili haplotypes were inferred in NETWORK V4.5.1.0 software to create an unrooted haplotype network, using star contraction [49].
Results
Microsatellite analysis
Genetic diversity
Genotypes at 11 microsatellites loci were analysed in a total of 341 An. nili specimens originated from nine local-ities in six countries across West and Central Africa (Fig-ure 1, Table 1). Individual genotypes are available upon request to the corresponding author. All loci amplified successfully and were highly polymorphic in all popula-tions. Mean allelic richness (Rs) across populations ranged from 5.04 at locus 2C157 to 12.62 at locus F41, and average expected heterozygosity (He) across all sam-ples ranged from 0.621 at locus A14 to 0.929 at locus 1A27 (Table 1). Populations from West Africa and Cam-eroon displayed very similar mean allelic richness (Rs = 8.10-8.88) and mean expected heterozygosity (He = 0.805-0.849) (ANOVA: P > 0.05). Both estimates were sig-nificantly lower (ANOVA: P < 0.05) in the Kenge popula-tion from DRC (Rs = 5.43, He = 0.594) (Table 1).
Departure from HWE (P < 0.05 after correction for multiple testing) were detected in 8 of 11 (72.72%) loci when all samples were pooled and considered as a single gene pool. All significant deviations were associated with a deficit in heterozygotes (positive values of Fis), suggest-ing population substructure (Table 1). When samples were split into geographical populations, 11 tests of 99 (11%) remained significant after the sequential
Bonfer-roni procedure was applied. Three loci 1A27, A154 and A14 were particularly involved in nine of these devia-tions. No deviation was detected in three of the four sam-ples from Cameroon (Magba, Mbebe and Simbock). The populations from Burkina Faso and Senegal with three deviations each had the highest number of loci out of HWE. All these deviations were attributed to the pres-ence of null alleles, with frequency of unobserved alleles ranging from 0.088 to 0.184 in loci with significant heterozygote deficiency (see Additional file 1). However, null alleles did not significantly bias our interpretation, as re-analysis of adjusted datasets returned similar results. Linkage disequilibrium (LD) tests were performed between all pairs of loci in all populations. Out of 495 comparisons, 7 (1.41%) were found significant at the sin-gle test level (P < 0.05): one in Gansé (1F43 × 1G13) and Kenge (A154 × F56), two in Simbock (1A27 × F41 and F56 × 1G13) and three in Tibati (2 Ateta × F56, A154 × B115 and 2C157 × 1G13). None of these tests remained significant after the sequential Bonferroni procedure was applied. These results suggest that loci segregate inde-pendently and confirm that null alleles are the most likely cause of the heterozygote deficiencies observed. Accord-ingly, all loci were included in the analysis and each geo-graphical population was considered as a panmictic unit.
Heterozygosity tests were performed to explore demo-graphic stability in An. nili populations and compliance to MDE. No signature of a recent bottleneck event was detected in any population. However, significant devia-tions (P < 0.01) from MDE which may suggest population expansion (He < Heq) were found in all populations under the SMM. In Kenge, deviations associated with strong heterozygote deficiencies were detected under all mutation models (Table 2).
Population genetic structure and isolation by distance
A Bayesian clustering analysis performed with the soft-ware STRUCTURE revealed that the most likely number of genetic clusters in the dataset is 2. The first cluster included the sample from Kenge (DRC) and the second cluster grouped together all other samples (Figure 2). Clustering analysis was repeated without the Kenge pop-ulation to examine whether any further sub-structuring was present within the second cluster and did not detect any additional sub-structuring.
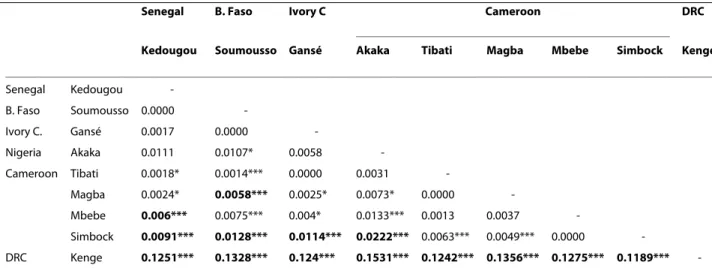
All populations displayed similar allele profiles, with a lack of rare alleles in the An. nili population from Kenge, which appeared highly differentiated from the rest (Table 3). High Fst estimates (Fst = 0.119-0.153, P < 0.001) were observed between this population and all the other ones. In contrast, low genetic differentiation (at least one order of magnitude lower) was detected among the remaining populations (i.e., within cluster 2 identified above). To verify whether genetic differentiation between Kenge and the rest was specific to particular loci, jackknifed Fst
esti-mates were calculated after excluding one locus at a time. This analysis provided consistent results reflecting homogeneity of Fst estimates across the set of loci (Table 4).
Because geographical isolation is often the main force driving population differentiation, the level of genetic dif-ferentiation which could be attributable to the geographi-cal distance between collection sites was assessed using Mantel tests. A positive and significant correlation was found between Fst/(1-Fst) and logarithm of geographic distance (Mantel test: P < 0.05) when all samples were included in the analysis (Figure 3), suggesting that
geo-graphic distance between sites is responsible for part of the differentiation observed. Nevertheless, the correla-tion was not significant (Mantel test, P > 0.05) when Kenge was excluded from the analysis.
Sequence analysis
rDNA polymorphism
In total, 76 sequences were generated for ITS2 and D3 each. These sequences perfectly matched those published by Kengne et al. [17]. Of the 451 bp of ITS2, no variable sites were found, whereas only one variable site (muta-tion) was found in one specimen in Kenge (DRC) among the 392 pb of the D3 domain (GenBank Accession Num-ber:GU947798). These results are consistent with the fact that all An. nili populations analysed belonged to the same taxonomic unit.
mtDNA polymorphism and divergence
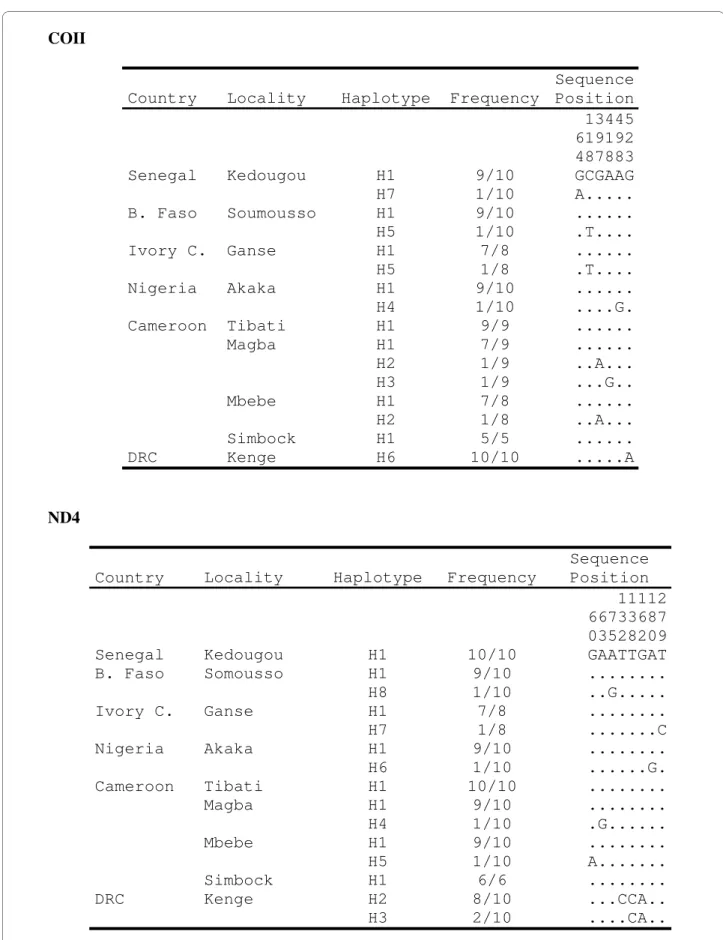
The nucleotide sequence was determined along 603 bp of the COII gene (coding region) in a total of 78 individual mosquitoes. In addition, a fragment of 320 bp within the coding region of ND4 gene was obtained for 84 mosqui-toes. All segregating sites and the sequence variants (hap-lotypes) are shown in Figure 4 and summary statistics for both genes are given in Table 5.
Overall, low polymorphism was found in both mito-chondrial genes. Across the whole dataset, there were only 6 (0.99%) and 8 (2.5%) polymorphic sites for COII and ND4, respectively. This low number of variable sites resulted in low nucleotide diversity (π < 0.001 in all sam-ples, Table 5) and low haplotype diversity (hd < 0.42, Table 5) across samples. Among the 78 COII sequences, seven haplotypes (overall hd = 0.375) were found and three of them appeared in a single copy (singleton) in the dataset. The most frequent haplotype was identical to the reference sequence published by Marshall et al [50] (Gen-Bank Accession Number: DQ069720). Gen(Gen-Bank Acces-sion numbers for the other 6 COII haplotypes are Table 2: Heterozygosity tests in An. nili populations from
sub-Saharan Africa. Country Locality TPM SMM 70% 80% 90% Senegal Kedougou 5 5 7 8** B. Faso Soumousso 5 5 9* 10** Ivory C. Gansé 6 6 6 9** Nigeria Akaka 7 7 7 9* Cameroon Tibati 4 5 5 9** Magba 5 5 6 9** Mbebe 5 5 6 9** Simbock 4 7 8 9** DRC Kenge 8** 9** 9** 10***
TPM: Two-Phase mutation Model with a % single step mutations, SMM: Stepwise Mutation Model; *P < 0.05, **P < 0.01 and ***P < 0.001 (two-tailed Wilcoxon signed-rank test P-values for deviation from MDE) after correction for multiple testing. B. Faso: Burkina Faso, Ivory C.: Ivory Coast, DRC: Democratic Republic of Congo.
The number of microsatellite loci showing heterozygote deficiency (e.g., He < Heq, see text) out of 11 test loci is given.
Figure 2 Genetic cluster analysis using STRUCTURE based on multilocus microsatellites genotypes of An. nili specimens. Graphical
represen-tation of the data set for the most likely number of genetic clusters (K = 2), where each color corresponds to a suggested cluster and each individual is represented by a vertical bar. The numbers in the X-axis correspond to a specific sample: 1-Kenge, 2-Magba, 3-Tibati, 4-Mbebe, 5-Simbock, 6- Akaka, 7-Soumousso, 8-Gansé and 9-Kedougou. The Y-axis represents the probability of assignment of an individual to each cluster.
GU947799 to GU947804. Similarly to COII gene, 4 of 8 ND4 haplotypes (overall hd = 0.331, GenBank Accession Numbers: GU947805 to GU947812) were singletons. Tajima's DT , Fu & Li's F and D, and Fu's Fs statistics were all negative for both genes, although only Fs reached sta-tistical significance when all samples were pooled (Table 5). Negative values of these statistics might reflect either a selective sweep or a recent demographic expansion [48], a finding that is in agreement with data obtained from the microsatellite analysis.
For either gene, eight of nine populations (excluding Kenge) shared their most frequent haplotype and the fre-quency of this haplotype ranged from 78% to 90% (Figure 4). No haplotype was shared between Kenge and the
other samples. The sequences of specimens from Kenge differed from the rest by one and two fixed mutations in COII and ND4, respectively (Figure 4). Graphical analysis of the genealogical relationships among all mtDNA sequences using haplotype networks showed that all An.
nili haplotypes derived from a single common ancestral Table 3: Pairwise Fst estimates between An. nili populations from sub-Saharan Africa using 11 microsatellite loci.
Senegal B. Faso Ivory C Cameroon DRC
Kedougou Soumousso Gansé Akaka Tibati Magba Mbebe Simbock Kenge
Senegal Kedougou -B. Faso Soumousso 0.0000 -Ivory C. Gansé 0.0017 0.0000 -Nigeria Akaka 0.0111 0.0107* 0.0058 -Cameroon Tibati 0.0018* 0.0014*** 0.0000 0.0031 -Magba 0.0024* 0.0058*** 0.0025* 0.0073* 0.0000 -Mbebe 0.006*** 0.0075*** 0.004* 0.0133*** 0.0013 0.0037 -Simbock 0.0091*** 0.0128*** 0.0114*** 0.0222*** 0.0063*** 0.0049*** 0.0000 -DRC Kenge 0.1251*** 0.1328*** 0.124*** 0.1531*** 0.1242*** 0.1356*** 0.1275*** 0.1189***
-*P < 0.05, *-*P < 0.01, **-*P < 0.001. In bold: significant Fst values after corrections for multiple testing using the sequential Bonferroni procedure. B. Faso, Burkina Faso; Ivory C., Ivory Coast; DRC, Democratic Republic of Congo.
Table 4: Jackknifing over loci for the estimation of overall genetic differentiation between the two An. nili clusters.
Locus removed Fst P-value
1A27 0.121 P < 0.0001 1D80 0.121 P < 0.0001 1F43 0.118 P < 0.0001 1G13 0.120 P < 0.0001 2Ateta 0.101 P < 0.0001 2C157 0.120 P < 0.0001 A14 0.110 P < 0.0001 A154 0.108 P < 0.0001 B115 0.102 P < 0.0001 F41 0.117 P < 0.0001 F56 0.112 P < 0.0001 None 0.114 P < 0.0001
Figure 3 Correlation between average Fst estimates and loga-rithm of geographic distance between collection sites for pair-wise comparisons of An. nili populations from sub-Saharan Africa
-0.005 0 0.005 0.01 0.015 0.02 0.025 3 4 5 6 7 8 9 0.05 0.1 0.15 0.2 Fs t / ( 1 -Fst) Kenge ln(distance) -0.005 0 0.005 0.01 0.015 0.02 0.025 3 4 5 6 7 8 9 0.05 0.1 0.15 0.2 Fs t / ( 1 -Fst) Kenge ln(distance)
haplotype (Figure 5). This star-like network of haplotype again suggested recent population expansion.
Discussion
This is the first study using microsatellite markers to explore An. nili population genetic structure. All loci suc-cessfully amplified in each population and were highly polymorphic compared to the isoenzyme markers previ-ously used [22]. This is consistent with previous studies comparing microsatellite to isoenzymes markers in anophelines species [e.g., [51-53]]. Likewise, microsatel-lite loci were more polymorphic than the rDNA and the mtDNA genes used in this study. This pattern may reflect the small sample sizes used for sequencing and/or insuffi-cient resolution of the molecular markers [54]. Moreover, a biological process such as different evolutionary rates of the markers or locus/region-specific selective constraints could also be involved [55,56]. Nonetheless, despite this heterogeneity in overall polymorphism across molecular markers, the same trends emerged whereby An. nili pop-ulations from West and Central Africa (i.e., from Senegal to Cameroon) appeared genetically homogeneous, whereas mosquitoes sampled in DRC were highly differ-entiated from the species' core populations. In addition,
although individual inferences were rather weak, all markers showed a pattern of diversity and distribution of molecular polymorphisms that is consistent with recent demographic expansion of An. nili throughout its distri-bution range in West/Central Africa.
Genetic homogeneity within the rDNA genes is not surprising, given the particular evolutionary dynamics of the rDNA operon subject to concerted evolution [e.g. [57]], rendering it extremely useful for the resolution of deep phylogenies and/or to distinguish between cryptic species but conversely, of little use for within-species population genetics analysis [55,58]. Mitochondrial DNA evolves faster than the nuclear genome and has been widely used for population genetics and phylogenetics, including arthropod vectors of human diseases [54,55,59]. Because of strongly biased AT content, this non-recombining molecule is however subject to satura-tion, leading to a rapid lost of phylogenetic signal through homoplasy [55,59]. On the other hand, its lower effective population size (1/4th that of nuclear markers due to maternal inheritance and haploidy) together with increased selection against slightly deleterious mutations [60] can rapidly increase divergence between lineages within species and reduce local genetic diversity due to Table 5: Summary statistics for mtDNA genes polymorphism and neutrality tests in An. nili from sub-Saharan Africa
Senegal B. Faso Ivory C Nigeria Cameroon DRC All
Gene Kedougou Soumousso Gansé Akaka Tibati Magba Mbebe Simbock Kenge samples
COII n 10 7 8 10 9 9 8 5 10 76 s 1 1 1 1 0 2 1 0 0 6 hd 0.200 0.286 0.250 0.200 0.000 0.417 0.250 0.000 0.000 0.383 π 0.0003 0.0005 0.0004 0.0003 0.0000 0.0007 0.0004 0.0000 0.0000 0.0007 DT -1.111 -1.006 -1.055 -1.111 nc -1.362 -1.055 nc nc -1.564 D -1.243 -1.048 -1.126 -1.243 nc -1.505 -1.126 nc nc -1.632 F -1.347 -1.101 -1.203 -1.347 nc -1.626 -1.203 nc nc -1.896 Fs -0.339 -0.095 -0.182 -0.339 nc -1.081 -0.182 nc nc -4.999** ND4 n 10 10 8 10 10 10 10 6 10 84 s 1 1 1 1 0 1 1 0 1 8 hd 0.200 0.200 0.250 0.200 0.000 0.200 0.200 0.000 0.200 0.338 DT -1.111 -1.111 -1.055 -1.111 nc -1.111 -1.111 nc -0.111 -1.302 D -1.243 -1.243 -1.126 -1.243 nc -1.243 -1.243 nc -1.243 -1.914 F -1347 -1347 -1.205 -1347 nc -1347 -1347 nc -1347 -2.100 Fs -0.339 -0.339 -0.181 -0.339 nc -0.339 -0.339 nc 0.356 -3.414* π 0.0006 0.0006 0.0008 0.0006 0.0000 0.0006 0.0006 0.0000 0.0010 0.0023
n: number of sequences; s: number of polymorphic sites; hd: haplotype diversity; π : nucleotide diversity; DT: Tajima's D; D: Fu and Li's D; F: Fu and Li's F; Fs: Fu's Fs statistics; nc : not computed; *: P < 0.05; **: P < 0.01; B. Faso: Burkina Faso, Ivory C.: Ivory Coast, DRC: Democratic Republic of Congo.
Figure 4 Frequency and distribution of haplotypes in COII (above) and ND4 (below) genes in nine An. nili populations
COII
Country Locality Haplotype
Frequency
Sequence
Position
13445
619192
487883
Senegal Kedougou
H1
9/10
GCGAAG
H7
1/10
A...
B. Faso
Soumousso
H1
9/10
...
H5
1/10
.T....
Ivory C. Ganse
H1
7/8
...
H5
1/8
.T....
Nigeria Akaka
H1
9/10
...
H4
1/10
....G.
Cameroon Tibati
H1
9/9
...
Magba H1
7/9
...
H2
1/9
..A...
H3
1/9
...G..
Mbebe H1
7/8
...
H2
1/8
..A...
Simbock
H1
5/5
...
DRC Kenge
H6 10/10
...A
ND4
Country
Locality Haplotype
Frequency
Sequence
Position
11112
66733687
03528209
Senegal
Kedougou
H1
10/10
GAATTGAT
B. Faso
Somousso
H1
9/10
...
H8
1/10
..G...
Ivory C.
Ganse
H1
7/8
...
H7
1/8
...C
Nigeria
Akaka
H1
9/10
...
H6
1/10
...G.
Cameroon
Tibati
H1
10/10
...
Magba
H1
9/10
...
H4
1/10
.G...
Mbebe
H1
9/10
...
H5
1/10
A...
Simbock
H1
6/6
...
DRC
Kenge
H2
8/10
...CCA..
H3
2/10
....CA..
enhanced genetic drift and/or molecular hitchhiking resulting in selective sweep throughout the mitochon-drial genome [61,62]. This is in agreement with increased differentiation of the An. nili population from DRC observed with both mtDNA genes. Apparent segregation of different haplotypes between these two genetic clus-ters in An. nili prompts for further investigation to increase sample sizes and the geographic span of sam-pling eastwards and southwards of the present study area. Reduced variability and increased differentiation of the DRC population was also detected using nuclear DNA microsatellite markers. Within each geographical popula-tion, HWE was generally respected. Evidence for null alleles at certain loci, as formerly observed by Berthomieu et al [23], did not obscure the pattern of dif-ferentiation between populations, suggesting the set of loci used in this study were able to capture the main pat-terns of genetic variability within the dataset. Extensive allele sharing between populations and homogeneity across loci in the level of genetic differentiation suggests enhanced genetic drift in the DRC population, rather than selection was responsible of the pattern observed. Unfortunately, the chromosomal locations of the markers remain unknown in the absence of a reliable
chromo-somal map for An. nili but linkage equilibrium between markers suggests that they are, at least statistically inde-pendent and the results might reflect a genome-wide pat-tern. Reduced variability and increased differentiation is typically observed in populations leaving in marginal habitats at the edge of species' ranges [63] and the sparsely populated evergreen forest block of Central Africa is known to be of low overall quality for the devel-opment of An. nili which is more frequent at the savanna/ forest ecotone [14,21]. Deviation from MDE observed under a range of mutation models in this isolated popula-tion indeed suggests unstable demography, although no evidence for a recent bottleneck was obtained. All molec-ular markers suggested recent demographic expansion in the Kenge and, to a lesser extent, in all other An. nili pop-ulations sampled. Detection of this pattern in multiple independent loci make it possible to distinguish it from the effect of selection, which is locus-specific, and attri-bute it to past demographic change. This is reminiscent of the situation observed in other major vectors of human malaria in Africa and elsewhere [64], and prompts for further studies to disentangle the confounding effect of shared ancestral polymorphism from that of ongoing gene flow between geographical populations [59]. More-over, the role of the evergreen forest block as a geo-graphic barrier to gene flow between An. nili populations needs to be further explored, given the low dispersal abil-ity of this mosquito in this environment [65]. Clearly, extending the sampling area eastwards and southwards is needed to provide an overall picture of the level and dis-tribution of genetic diversity within An. nili throughout its distribution range on the continent, and identify both geographic barriers that prevent gene flow between pop-ulations and areas of extensive gene exchange as seems to be the case throughout West Africa. Such knowledge is needed to devise efficient, locally adapted and sustainable strategies for the management and control of these vector populations. It is interesting to note that recent investiga-tions of the population genetic structure of An. moucheti sampled in the same localities as presented here (at least in Cameroon and the DRC) did not detect such high level of population differentiation within and across the forest block [53,66]. Combined analysis of genetic and ecologi-cal data in a comparative framework should reveal fur-ther insights into the population biology and demographic history of these neglected malaria vectors, and provide relevant information for their control. Recent advances in theoretical population genetics and the rap-idly evolving field of spatial genetics [e.g., [56]] together with the development and democratization of high throughput sequencing technologies provide the neces-sary tools for such endeavor in non model species. Figure 5 Haplotype networks for COII (above) and ND4 (below)
genes in An. nili. Numbers are the mutation positions on the
refer-ence sequrefer-ence. Circles are roughly proportional to haplotype frequen-cies. Black circles identify haplotypes unique to Kenge population (GeneBank Accession Numbers: GU947803 for COII; GU947806-GU947807 for ND4).
COII
Additional material
Competing interests
The authors declare that they have no competing interests.
Authors' contributions
CN, CAN, IM and FS designed the study and monitored its implementation. CN, CAN, PAA participated to field sampling. CN conducted microsatellite genotyp-ing and gene sequencgenotyp-ing, under guidance of PK and IM. CN, PK, DA, AC and FS participated to data analysis. CN, CAN and FS wrote the manuscript which was critically revised by AC, DA, PN and DF. DC was involved in the design of the maps contained in this paper. All authors read and approved the final manu-script.
Acknowledgements
We thank Ibrahima DIA, Roch DABIRE, Maurice ADJA AKRE, Ali OUARI, the authorities and inhabitants of all sampling sites for their help during field col-lections. This study was funded through UNICEF/UNDP/World Bank/WHO/ TDR/Molecular Entomology grant A60347 to CAN, and a student fellowship grant from the French Institut de Recherche pour le Développement (IRD) to CN.
Author Details
1Laboratoire de Recherche sur le Paludisme, Organisation de Coordination
pour la lutte Contre les Endémies en Afrique Centrale (OCEAC), P.O. Box 288, Yaoundé, Cameroon, 2Faculty of Sciences, University of Yaoundé I, P.O. Box 812,
Yaoundé, Cameroon, 3Institut de Recherche pour le Développement (IRD), UR
016, 911 Avenue Agropolis, P.O. Box 64501, 34394 Montpellier Cedex 5, France and 4Institut de Recherche en Sciences de la Santé (IRSS), P.O. Box 545,
Bobo-Dioulasso, Burkina Faso
References
1. Feachem R, Sabot O: A new global malaria eradication strategy. Lancet 2008, 371:1633-1635.
2. Feachem RGA, Phillips AA, Targett GA: Shrinking the malaria map. A prospectus on malaria elimination. San Francisco: The Global Health Group; 2009.
3. Mendis K, Rietveld A, Warsame M, Bosman A, Greenwood B, Wernsdorfer WH: From malaria control to eradication: The WHO perspective. Trop
Med Int Health 2009, 14:802-809.
4. Greenwood B: Can malaria be eliminated? Trans R Soc Trop Med Hyg 2009, 103:S2-S5.
5. Takken W, Knols BGJ: Malaria vector control: current and future strategies. Trends Parasitol 2009, 25:101-104.
6. Enayati A, Hemingway J: Malaria management: past, present, and future. Annu Rev Entomol 2010, 55:569-91.
7. Fontenille D, Simard F: Unravelling complexities in human malaria transmission dynamics in Africa through a comprehensive knowledge of vector populations. Comp Immun Microbiol Infect Dis 2004, 27:357-375.
8. Antonio-Nkondjio C, Awono-Ambene P, Toto JC, Meunier JY, Zebaze-Kemleu S, Nyambam R, Wondji CS, Tchuinkam T, Fontenille D: High malaria transmission intensity in a village close to Yaounde, the capital city of Cameroon. J Med Entomol 2002, 39:350-355.
9. Antonio-Nkondjio C, Kerah Hinzoumbe C, Simard F, Awono-Ambene P, Tchuinkam T, Fontenille D: Complexity of the malaria vectorial system in Cameroon: Contribution of secondary vectors to malaria transmission.
J Med Entomol 2006, 43:1215-1221.
10. Carnevale P, Le Goff G, Toto JC, Robert V: Anopheles nili as the main vector of human malaria in villages of southern Cameroon. Med Vet
Entomol 1992, 6:135-138.
11. Dia I, Diop T, Rakotoarivony I, Kengne P, Fontenille D: Bionomics of
Anopheles gambiae Giles, An. arabiensis Patton An. funestus Giles and An. nili (Theobald) (Diptera: Culicidae) and Transmission of Plasmodium
falciparum in a Sudano-Guinean Zone (Ngari, Senegal). J Med Entomol
2003, 40:279-283.
12. Adja AM, N'goran KE, Kengne P, Koudou GB, Toure M, Koffi AA, Tia E, Fontenille D, Chandre F: Transmission vectorielle du paludisme en savane arborée à Gansé en Côte d'Ivoire. Med Trop 2006, 66:449-455. 13. Moffett A, Shackelford N, Sarkar S: Malaria in Africa: vector species' niche
models and relative risk maps. PLoS ONE 2007, 2:e824.
14. Ayala D, Carlo Costantini, Ose K, Kamdem GC, Antonio-Nkondjio C, Agbor JP, Awono-Ambene P, Fontenille D, Simard F: Habitat suitability and ecological niche profile of major malaria vectors in Cameroon. Malar J 2009, 8:307.
15. Awono-Ambene H, Kengne P, Simard F, Antonio-Nkondjio C, Fontenille D: Description and bionomics of Anopheles (Cellia) ovengensis (Diptera: Culicidae), a new malaria vector species of the Anopheles nili group from south Cameroon. J Med Entomol 2004, 41:561-568.
16. Brunhes J, LeGoff G, Geoffroy B: Afro-tropical anopheline mosquitoes: description of three new species: Anopheles carnevalei sp. nov., An.
hervyi sp. nov and An. dualaensis sp. nov., and resurrection of An. rageaui Mattingly and Adam. J Am Mosq Control Assoc 1999, 15:552-558.
17. Kengne P, Awono-Ambene HP, Antonio-Nkondjio C, Simard F, Fontenille D: Molecular identification of the Anopheles nili group African malaria vectors. Med Vet Entomol 2003, 17:67-74.
18. Awono-Ambene P, Antonio-Nkondjio C, Toto JC, Ndo C, Etang J, Fontenille D, Simard F: Epidemological importance of the Anopheles nili group of malaria vectors in equatorial villages of Cameroon, Central Africa. Sci Med Afr 2009, 1:13-20.
19. Gillies MT, de Meillon B: The Anophelinae of Africa South of the Sahara Volume 54. Johannesburg: The South African Institute for Medical Research; 1968.
20. Rivola E, Holstein MH: Note sur une varieté d'Anopheles nili Theo. Bull
Soc Pathol Exot 1957, 50:382-387.
21. Antonio-Nkondjio C, Ndo C, Costantini C, Awono-Ambene P, Fontenille D, Simard F: Distribution and larval habitat characterization of Anopheles
nili and An. moucheti along river networks in south Cameroon. Acta Trop 2009, 112:270-276.
22. Awono-Ambene HP, Simard F, Antonio-Nkondjio C, Cohuet A, Kengne P, Fontenille D: Multilocus enzyme electrophoresis supports speciation within the Anopheles nili group of Malaria vectors in Cameroon. Am J
Trop Med Hyg 2006, 75:656-658.
23. Berthomieu A, Kengne P, Awono-Ambene HP, Raymond M, Fontenille D, Weill M: Isolation and characterization of microsatellite DNA markers in the malaria vector Anopheles nili. Mol Ecol Notes 2003, 3:392-393. 24. Gillies MT, Coetzee M: A supplement to the Anophelinae of Africa south
of the Sahara. Publications of the South African Institute for Medical Research Johannesburg; 1987.
25. Morlais I, Ponçon N, Simard F, Cohuet A, Fontenille D: Intraspecific nucleotide variation in Anopheles gambiae: new insights into the biology of malaria vectors. Am J Trop Med Hyg 2004, 71:795-802. 26. El Mousadik A, Petit R: High level of genetic differentiation for allelic
richness among populations of the argan tree (Argania spinosa L.). Skeels endemic to Morocco. Theoret Appl Genet 1996, 92:832-839. 27. Goudet J: FSTAT version 2.9.3.2. A computer software to calculate
F-statistics. J Hered 1995, 86:485-486.
28. Nei M: Molecular evolutionary genetics. Colombia University press, New York; 1987.
29. Belkhir K, Borsa P, Goudet J, Chikhi L, Bonhomme F: GENETIX 4.02, logiciel sous Windows TM pour la génétique des populations. In Laboratoire
Génome, Populations, Interactions, CNRS UMR 5000 Université de
Montpellier II, Montpellier, France; 2001.
30. Weir BS, Cockerham CC: Estimating F-statistics for the analysis of population structure. Evolution 1984, 38:1358-1370.
31. Raymond M, Rousset F: GENEPOP, Version 1.2. A population genetics software for exact tests and ecumenicism. J Hered 1995, 86:248-249. 32. Rousset F: Genepop'007: a complete re-iplementation of the Genepop
software for windows and linux. Mol Ecol Notes 2007, 8:103-106. 33. Van Oosterhout C, Hutchinson WF, Wills DP, Shipley P: MICROCHECKER:
Software for identifying and correcting genotyping errors in microsatellite data. Mol Ecol 2004, 4:535-538.
34. Cornuet JM, Luikart G: Description and power analysis of two tests for detecting recent population bottlenecks from allele frequency data.
Genetics 1996, 144:2001-2014. Additional file 1 Supplementary table S1. Estimates of null alleles
fre-quencies per locus and per geographical population of An. nili.
Received: 17 March 2010 Accepted: 12 June 2010 Published: 12 June 2010
This article is available from: http://www.malariajournal.com/content/9/1/161 © 2010 Ndo et al; licensee BioMed Central Ltd.
This is an Open Access article distributed under the terms of the Creative Commons Attribution License (http://creativecommons.org/licenses/by/2.0), which permits unrestricted use, distribution, and reproduction in any medium, provided the original work is properly cited.
35. Kimura M, Ohta T: Stepwise mutation model and distribution of allelic frequencies in a finite population. Proc Natl Acad Sci USA 1978, 75:2868-2872.
36. Di Rienzo A, Peterson AC, Garza JC, Valdes AM, Slatkin M, Freimer NB: Mutational processes of simple-sequence repeat loci in human populations. Proc Natl Acad Sci USA 1994, 91:3166-3170. 37. Wright S: Evolution and Genetics of populations. Variability within and
among natural populations Volume 4. Chicago: University of Chicago press;
1978.
38. Rousset F: Genetic differentiation and estimation of gene flow from F-statistics under isolation by distance. Genetics 1997, 145:1219-1228. 39. Holm S: A simple sequentially rejective multiple test procedure. Scand
J Stat 1979, 6:65-70.
40. Pritchard JK, Stephens M, Donnelly P: Inference of population structure using multilocus genotype data. Genetics 2000, 155:945-959. 41. Falush D, Stephens M, Pritchard JK: Inference of Population Structure
Using Multilocus Genotype Data:Linked Loci and Correlated Allele Frequencies. Genetics 2003, 164:1567-1587.
42. Evanno G, Regnaut S, Goudet J: Detecting the number of clusters of individuals using the software STRUCTURE: a simulation study. Mol
Ecol 2005, 14:2611-2620.
43. Kumar S, Tamura K, Nei M: MEGA 3: integrate software for molecular evolutionary genetics analysis and sequence alignment. Brief Bioinform 2004, 5:150-163.
44. Thompson JD, Gibson TJ, Plewniak F, Jeanmougin F, Higgins DG: The ClustalX windows interface: flexible strategies for multiple sequence alignment aided by quality analysis tools. Nucl Ac Res 1997, 24:4876-4882.
45. Rozas J, Sanchez-Delbarrio JC, Messeguer X, Rozas R: DnaSP, DNA polymorphism analyses by the coalescent and other methods.
Bioinformatics 2003, 19:2496-2497.
46. Tajima F: The effect of change in population size on DNA polymorphism. Genetics 1989, 123:597-601.
47. Fu YX: Statistical tests of neutrality of mutations against population growth, hitchhiking and background selection. Genetics 1997, 147:915-925.
48. Fu YX, Li WH: Statistical tests of neutrality of mutations. Genetics 1993, 133:693-709.
49. Foster P, Toronni A, Renfew C, Röhl A: Phylogenetic star contraction applied to Asian and Papuan mtDNA evolution. Mol Biol Evol 2001, 18:1864-1881.
50. Marshall JC, Powell JR, Caccone A: Phylogenetic relationships of the antropophilic Plasmodium falciparum malaria vectors in Africa. Am J
Trop Med Hyg 2005, 73:749-752.
51. Lanzaro GC, Zheng L, Touré YT, Traoré SF, Kafatos FC, Vernick KD: Microsatellite DNA and isoenzyme variability in West African populations of Anopheles gambiae. Insect Mol Biol 1995, 4:105-112. 52. Lehmann T, Hawley WA, Kamau L, Fontenille D, Simard F, Collins FH: Genetic differentiation of Anopheles gambiae populations from East and West Africa: comparison of microsatellite and allozyme loci.
Heredity 1996, 77:192-200.
53. Antonio-Nkondjio C, Ndo C, Awono-Ambene HP, Ngassam P, Fontenille D, Simard F: Population genetic structure of the malaria vector An.
moucheti in south Cameroon forest region. Acta Trop 2007, 101:61-68.
54. Lehmann T, Blackston CR, Besansky NJ, Escalante AA, Collins FH, Hawley WA: The Rift Valley complex as a barrier to gene flow for Anopheles
gambiae in Kenya: the mtDNA perspective. J Hered 2000, 91:165-168.
55. Mas-Coma S, Bragues MD: Populations, hybrids and systematic concept of species and subspecies in Chagas disease triatomine vectors inferred from nuclear ribosomal and mitochondrial DNA. Acta Trop 2009, 110:112-136.
56. Guillot G: On the inference of spatial structure from population genetics data. Bioinformatics 2009, 25:1796-1801.
57. Liao D: Concerted evolution: molecular mechanism and biological implications. Am J Hum Genet 1999, 64:24-30.
58. Collins FH, Paskewitz SM: A review of the use of ribosomal DNA (rDNA) to differentiate among cryptic Anopheles species. Insect Mol Biol 1996, 5:1-9.
59. Krzywinski J, Besansky NJ: Molecular systematics of Anopheles: from subgenera to subpopulations. Annu Rev Entomol 2003, 48:111-139.
60. Dean MD, Ballard JW: High divergence among Drosophila simulans mitochondrial haplogroups arose in midst of long term purifying selection. Mol Phylogenet Evol 2005, 36:328-337.
61. Ballard JW, James AC: Differential fitness of mitochondrial DNA in perturbation cage studies correlates with global abundance and population history in Drosophila simulans. Proc R Soc Lond B 2004, 271:1197-1201.
62. Melvin RD, Jace WR, Mattson JG, Moore A: Phylogenetic of two mitochondrial metabolic genes sampled in parallel from Agiosperms find fundamental interlocus incongruence. Am J Botany 2008, 95:871-884.
63. Sexton JP, McIntyre PJ, Angert AL, Rice KJ: Evolution and ecology of species range limits. Annu Rev Ecol Evol Syst 2009, 40:415-436. 64. Donnelly M, Simard F, Lehmann T: Evolutionary studies of malaria
vectors. Trends Parasitol 2002, 18:75-80.
65. Le Goff G, Carnevale P, Robert V: Low dispersion of anopheline malaria vectors in the african equatorial forest. Parasite 1997, 2:187-189. 66. Antonio-Nkondjio C, Ndo C, Kengne P, Mukwaya L, Awono-Ambene HP,
Fontenille D, Simard F: Population structure of the malaria vector
Anopheles moucheti in the equatorial forest region of Africa. Malar J
2008, 7:120.
doi: 10.1186/1475-2875-9-161
Cite this article as: Ndo et al., Population genetic structure of the malaria