HAL Id: hal-03127371
https://hal-enpc.archives-ouvertes.fr/hal-03127371
Preprint submitted on 1 Feb 2021HAL is a multi-disciplinary open access archive for the deposit and dissemination of sci-entific research documents, whether they are pub-lished or not. The documents may come from teaching and research institutions in France or abroad, or from public or private research centers.
L’archive ouverte pluridisciplinaire HAL, est destinée au dépôt et à la diffusion de documents scientifiques de niveau recherche, publiés ou non, émanant des établissements d’enseignement et de recherche français ou étrangers, des laboratoires publics ou privés.
Paying extra for better wind nearshore
Minh Ha-Duong
To cite this version:
Paying extra for better wind nearshore
Minh Ha-Duong
12020-02-01
Abstract
Analysts often divide wind power projects into two categories: onshore and offshore. A third category recently emerged: nearshore projects, built on the intertidal flats. We observe a quasi cross-sectional sample of Vietnam's wind power projects, exhaustive regarding projects at the operating and building stages, comprising projects in the three categories. The median investment for onshore wind power projects in Vietnam is 1 680 USD/kW. It is 2 174 USD/kW for nearshore projects. We computed the relative extra investment distribution for intertidal projects compared to onshore projects in our sample. On average, a MW of generation capacity requires about 50% more investment nearshore than onshore. But variation is considerable, the interquartile range 20% – 70% represents the extra cost better. It does not follow that electricity from nearshore stations costs more. Annual generation depends on the capacity factor. Projects developers are paying extra for better wind nearshore.
Keywords
Wind power; Vietnam; Investment cost; Energy transition
JEL Classification codes
Q42; D24
Highlights
• We observe a quasi cross-sectional sample of wind power projects in Vietnam. • Neither onshore nor offshore, many projects are located nearshore on intertidal flats. • The median investment for onshore wind power projects in Vietnam is 1 680 USD/kW. • The median investment for nearshore wind power projects in Vietnam is 2 174 USD/kW. • On average, a nearshore MW generation capacity requires about 50% more investment than
onshore (interquartile range 20%-70%).
• Nearshore wind power stations cost more to install but have better winds than onshore.
1 CIRED, CNRS. Campus du Jardin Tropical, 45 avenue de la Belle Gabrielle, 94736 Nogent sur
1. Introduction
Investment in new wind power generation capacity reached 138 billion USD in 2019 worldwide according to the REN21 report (2020, fig. 51), rising by 8% and outweighing that in solar PV. That report, like all others, divides wind power projects into two categories: onshore and offshore. We characterize a third category: nearshore, wind power projects build on the intertidal flats close to the coastline.
Nearshore stations have pros and cons compared to onshore or offshore ones. Winds over the sea tend to be stronger and more regular than over the continent. Land use and terrain constrain less the project design. Machines can be accessed on foot from the shore at low tide. Access at high tide remains possible with a causeway to the wind turbines. While access to nearshore stations by sea is more straightforward than access to remote hilltops by road, the build requires expensive specialized vessels and is more at risk from weather. Undevelopped tidal areas are richer in biodiversity than open sea or anthropized land surfaces. Erecting towers on wet sand is more complicated than on solid rock. And as the electric grid mostly runs over land, nearshore projects will be further away on average, so it may be more expensive to build the connection line. Generally, over one year a 5 MW turbine costs more to install nearshore than onshore, but it will produce more electricity.
In this letter, we present a historical comprehensive sample of the wind power industry in Vietnam. Then we compute the nominal investment costs of projects in USD per kW of installed capacity, and compare nearshore projects with onshore projects to determine how much more capital intensive they are. Offshore projects in our dataset are not comparable for reasons discussed in the final section.
2. Material and methods
We extracted the sample from our Vietnam wind power dataset (Ha-Duong, Minh 2021) –see
companion data paper– by selecting projects with more than 5 MW capacity for which the Location type and the Investment cost fields were available. The key features of the source dataset are:
• It aims to provide a comprehensive historical record of the wind power sector in Vietnam. • It reveals investment costs for all projects currently operational or at the implementation stage. • It includes projects onshore, offshore and nearshore.
• Publicly available sources justify all records.
• The overwhelming majority of projects in our sample aim at commercial delivery in 2021. The last point is somewhat atypical. Our sample is quasi cross-sectional. In many countries, renewable energy sources have entered the market over a long period, ten years or more. To the contrary,
expansion of wind power in Vietnam followed a hockey stick curve: fifteen years of trials before a wind rush starting in 2019.
The Bạch Long Vĩ island hybrid diesel + wind project inaugurated on 30 October 2004 was a false start, not appropriate to the local capacities at the time. Vietnam's first high-capacity wind farm, 30 MW, was inaugurated in the central province of Bình Thuận on 18 April 2012. The next two projects – the Phú Quý island hybrid grid with 6 MW and the nearshore Bạc Liêu phase 1 with 16 MW – both completed in 2013. These three pioneer projects had their lot of technical trouble: one turbine of the Phú Quý system broke down unrepaired; the wind farm in Bình Thuận had acute thermal management issues; the construction of Bac Liêu phase 2 stalled for years. No new capacity was added in 2014 or 2015. The
83 MW Bạc Liêu phase 2 finally completed in 2016. That year also delivered the 24 MW Phú Lạc project in Bình Thuậnh province. The following year, the 30 MW Hướng Linh 2 project in the Quảng Trị province connected. In 2018, the total installed wind power capacity in Vietnam reached 228 MW. Then Government's Decision 39 raised the Feed-in tariff for wind power projects in Vietnam. From 78 USD / MWh since 2011, it jumped to 85 USD / MWh for onshore wind power projects and
98 USD / MWh for offshore wind power projects (Nguyễn Xuân Phúc 2018). The new electricity tariff applies to a part or whole of the grid-connected wind power projects with commercial operation date before 1 November 2021. The tariff will apply for 20 years from the date of commercial operation. Already operating projects will benefit from the tariffs retroactively from 1 November 2018 for the signed power purchase agreement's remaining period.
On 19 March 2020, Letter 1931 noted two facts: "only nine wind power projects with a capacity of 350 MW have been put into operation so far" and "Total capacity of wind power projects already added to the Planning is approximately 4 800 MW" (Hoàng Quốc Vượng 2020). Following up, Decision 795 approved the addition of 6 924 MW of wind power projects to the Electricity Masterplan VII (Trịnh Đình Dũng 2020). Overall there is about 11 000 MW of wind power projects in Vietnam vying to beat the November 2021 deadline.
Letter 10052 issued at the end of 2020 identified the second wave of about 6 500 MW of wind power projects proposed for inclusion into the next electricity masterplan (Đặng Hoàng An 2020). However, as of January 2021, that wave has not been approved by the Prime Minister. These projects would have no chance to deliver before November 2021. Tariffs for wind power projects completed after that deadline remain under discussion as we write this.
3. Results
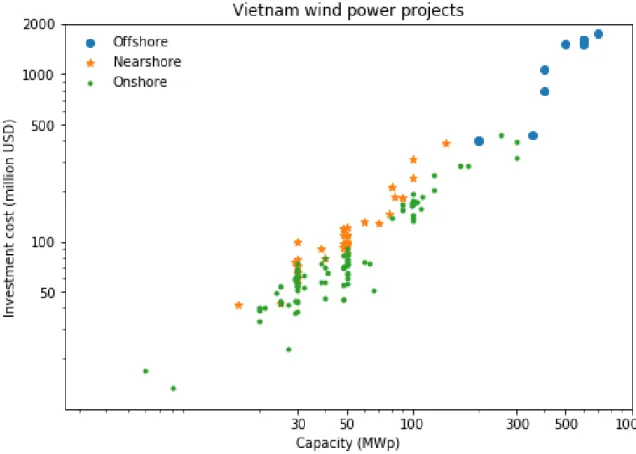
Figure 1 shows that nearshore projects tend to have higher investment cost per MW of generation capacity than onshore projects. The yellow stars are above the green dots. We will call technology cost the ratio of a project’s investment over its installed capacity. It is a standard metric in energy economics. It determines production costs for electricity generation technologies that do not use fuels.
Figure 2 top panel compares the three types of wind power projects in terms of technology cost. The median technology cost for an onshore project is 1 680 USD/kWh (interquartile range 1 449 – 1 867). The median technology cost for a nearshore project is 2 174 USD/kWh (interquartile range 2 000 – 2 455). The statistical significance of the difference between the distribution of nearshore projects technology costs and onshore projects technology costs is very high (Mann Whitney U test p = 3.1 10-12, Kolmogorov
Smirnov test p = 4,0 10-12). The companion data paper provides source code and statistics tables.
The middle panel in Figure 2 shows that nearshore projects compare to onshore projects in installed capacity, on the lower side. The bottom panel indicates again that nearshore projects compare to onshore projects, on the higher side. Only the joint analysis on the top panel shows clearly that nearshore projects tend to be more investment intensive. How much more intensive? We used three approaches to answer.
Figure 2: Distribution of wind power project characteristics for different types of projects in Vietnam. Top: Technology cost in M$/MW. Middle: Capacity in MW. Bottom: Investment in M$. Source: Author.
The first is to compare median technology costs. This suggests that nearshore is 29% more expensive. The second is to compare the slopes when explaining Investment (in M$) by Capacity (in MW). The intercept is not significant for the nearshore ordinary least squares regression model, so we omit it in both models for simplicity.
Onshore projects: Investment = 1.498 * Capacity Nearshore projects: Investment = 2.326 * Capacity
The regression approach suggests that the extra technology cost is 55%, about double the first estimate. To reconcile these numbers, we used a third approach: Monte Carlo simulations to compute the extra technology cost distribution. We compared a nearshore MW with an onshore MW in our sample, using weighted random draws with replacement. On average the extra technology cost is 50%, with an interquartile range of 19% – 69%. These numbers vary by about +/-1% between runs of 30 000 draws, and to avoid presenting a false precision we round it to 20% – 70%.
4. Discussion and concluding remarks
Figure 1, using a log-log axis, shows that offshore projects differ from the rest as they are larger. The smallest offshore project is 200 MW, and it is the pilot phase of a much larger project. Offshore projects in Vietnam are not comparable to the other in our sample, because these projects are not trying to beat the November 2021 deadline. Offshore projects aim to benefit from rapid cost-reducing technological progress. Their announced investment costs are somewhat aspirational.
REN21 (2019, 131) reports that onshore wind power technology cost for projects commissioned in 2017 was on average 1 173 USD/kW for China (min-max range 1 099 – 1 261). Our observed median at
1 680 USD/kW for projects in Vietnam commissioning in 2021 is higher than China's number, especially considering the four years of technical progress. We conjecture that the reason why projects in Vietnam tend to be more expensive is that the market is less mature, and projects tend to be on hilltops instead of flatlands in China. REN21 also reports a technology cost of 2 237 USD/kW for Asia excluding China and India (min-max range 1 783 – 2 565), which is over our observed median for Vietnam. It is not surprising that costs are higher in the richer countries like Japan, Thailand, South Korea and Taiwan. Jakob Lundsager, Nguyễn Ngọc, and Mikael Togeby (2019) published an official technology catalogue specific to Vietnam, based on engineering and analogues. They estimate (page 63) the technology cost for wind power onshore in 2020 to be 1 600 USD/kW (uncertainty range 1 400 – 2 000). Our
econometric estimate for onshore projects is very close to theirs. But we suggest that analysts should not use their estimate for nearshore projects. Access to better winds nearshore comes at higher investment costs.
Acknowledgements
We acknowledge the contributions to data collection from Nguyen Thi Lan Anh, Minh-Quan Tong and Hoang Nguyen, and comments from An Ha Truong. We started data collection while the author was visiting research director at the Vietnam Initiative for Energy Transition Social Enterprise (VIET SE) in Hanoi. The author research visit at VIET SE received financial support from the European Climate Foundation.
Đặng Hoàng An. 2020. ‘Letter 10052 from MOIT to PM to Propose Additional Wind Power Projects in the Electricity Masterplan’. Letter 10052/BCT-DL. Ha Noi, Viet Nam: MOIT.
Ha-Duong, Minh. 2021. ‘List of Wind Power Projects in Vietnam’. Zenodo. https://doi.org/10.5281/ZENODO.3698080.
Hoàng Quốc Vượng. 2020. ‘Letter 1931 from MOIT to PM to Propose Additional Wind Power Projects in the Electricity Masterplan’. Letter 1931/BCT-DL. Ha Noi, Viet Nam: MOIT.
Jakob Lundsager, Hưng Nguyễn Ngọc, and Mikael Togeby. 2019. ‘Vietnam Technology Catalogue - Technology Data Input for Power System Modelling in Viet Nam’. [Data set]. Hanoi: EREA/MOIT, Institute of Energy, Ea Energy Analyses, Danish Energy Agency. http://doi.org/10.5281/zenodo.2859959.
REN21. 2019. Renewables 2019 Global Status Report. Paris: REN21 Secretariat. https://www.ren21.net/gsr-2019.
———. 2020. Renewables 2020 Global Status Report. Paris: REN21 Secretariat.
Trịnh Đình Dũng. 2020. ‘Decision 795/TTg-CN on adding wind power projects into power development plan’. Decision 795/TTg-CN. Hanoi, Vietnam: The Prime Minister, Government of Vietnam. https://thuvienphapluat.vn/cong-van/dau-tu/Cong-van-795-TTg-CN-2020-bo-sung-danh-muc-du-an-dien-gio-vao-quy-hoach-phat-trien-dien-luc-446039.aspx.

![Synthesis, Spectroscopic Characterization, Electrochemical Properties and Biological Activity of 1-[(4Hydroxyanilino)-methylidene] naphthalen-2(1H)-one and its Mn (III) Complex](data:image/gif;base64,R0lGODlhAQABAIAAAP///wAAACH5BAEAAAAALAAAAAABAAEAAAICRAEAOw==)