HAL Id: hal-02267485
https://hal.archives-ouvertes.fr/hal-02267485
Submitted on 20 Sep 2019
HAL is a multi-disciplinary open access
archive for the deposit and dissemination of
sci-entific research documents, whether they are
pub-lished or not. The documents may come from
teaching and research institutions in France or
abroad, or from public or private research centers.
L’archive ouverte pluridisciplinaire HAL, est
destinée au dépôt et à la diffusion de documents
scientifiques de niveau recherche, publiés ou non,
émanant des établissements d’enseignement et de
recherche français ou étrangers, des laboratoires
publics ou privés.
Distributed under a Creative Commons Attribution| 4.0 International License
Water transit time and active recharge in the Sahel
inferred by bomb-produced 36Cl
Camille Bouchez, Pierre Deschamps, Julio Goncalves, Bruno Hamelin,
Abdallah Mahamat Nour, Christine Vallet-Coulomb, Florence Sylvestre
To cite this version:
Camille Bouchez, Pierre Deschamps, Julio Goncalves, Bruno Hamelin, Abdallah Mahamat Nour, et
al.. Water transit time and active recharge in the Sahel inferred by bomb-produced 36Cl. Scientific
Reports, Nature Publishing Group, 2019, 9 (1), pp.7465. �10.1038/s41598-019-43514-x�. �hal-02267485�
www.nature.com/scientificreports
Water transit time and active
recharge in the sahel inferred by
bomb-produced
36
Cl
Camille Bouchez
1,2, Pierre Deschamps
1, Julio Goncalves
1, Bruno Hamelin
1,
Abdallah Mahamat Nour
1,3, Christine Vallet-Coulomb
1& Florence sylvestre
1the lack of data and suitable methods to quantify regional hydrological processes often hinders sustainable water management and adaptation to climate change in semiarid regions, particularly in the Sahel, which is known for its climatic variability. Here we show that 36Cl from nuclear tests is a
promising method to estimate water transit times and groundwater recharge rates on the catchment scale, and to distinguish water and chloride cycles. 36Cl was measured in 131 surface and groundwater
samples in the Chari-Logone sub-catchment of the emblematic Lake Chad Basin, located in central Sahel. It was found that only 12 ± 8% of the catchment is connected to the main rivers. Groundwater supporting rivers in the upper humid part of the catchment has a mean transit time of 9.5 ± 1 years and a recharge rate of 240 ± 170 mm yr−1. In the lower Sahelian part of the catchment, stream-focused
recharge yields recharge rates up to 78 ± 7 mm yr−1 in riparian groundwater against 16 ± 27 mm yr−1
elsewhere. Our estimates suggest that aquifers in the Sahel host a significant amount of renewable water, which could therefore be used as a strategic freshwater resource.
Freshwater resources in semi-arid regions are facing a number of stress factors, such as rapid population growth with the associated economic and agricultural developments, and climate change1. Concerns have been raised
that growing pressure on freshwater resources might result in conflicts at sub-national to international lev-els. Sustainable water management relies on a sound understanding of fundamental hydrological catchment characteristics such as hydrologically active areas, catchment scale water transit times2–4 or groundwater recharge
rates5,6. However, the assessment of these key parameters of the hydrological cycle remains difficult in semi-arid
regions for two main reasons. First concepts are mainly adapted to temperate climates and thus can only be partly applied to these areas7, second hydrological and climatological data in many semi-arid and arid regions
are scarce, particularly in sub-Saharan Africa8. The Sahel, a latitudinal belt stretching across the southern edge of
Sahara, has been subject to humanitarian crises and social instability, exacerbated by the recurrence of persistent severe droughts since the 1980s9. Since then, standing debates have arisen on both the driving forces of climate
variability in the Sahel10 and the complex non-linear hydrological responses to climate variability11. Despite
inter-national research programs12, Sahel’s catchment hydrology remains too poorly understood to support sustainable
water governance. In particular, data on aquifer recharge rates and surface water – groundwater connectivity are lacking. Located in the centre of the Sahel, the Lake Chad Basin (LCB) is an endorheic catchment of 2.5 million km2. As Lake Chad integrates climatic and hydrologic changes over the region, it is a relevant scientific study site
of Sahelian hydrology. The LCB is a hotspot of water-related issues in the Sahel, as the escalating conflicts over natural resources in Lake Chad point to the urgent need for a fair and sustainable management of natural resources.
Dissolved gas tracers (such as CFCs, 3H/3He, SF
6, 85Kr) provide temporal constraints on the water transit time
of surface and subsurface flows within a catchment13. However, contamination by atmospheric or soil gases14
often limits their applicability as age tracers to open-water systems. Bomb-produced tritium was widely applied as a young age tracer in the 1960s6, but the combined effect of removal by rain and radioactive decay (t
1/23H = 12.3
years) leads to an ambiguous age determination for recharge periods between 1975 and 201015,16. 36Cl appears
to be a relevant alternative tracer17: chloride is a ubiquitous ion, the production of 36Cl associated with nuclear 1Aix Marseille Univ, CNRS, IRD, INRA, Coll France, CEREGE, Aix en Provence, France. 2Univ Rennes, CNRS,
Géosciences Rennes, UMR 6118, 35000, Rennes, France. 3University of N’Djamena, Département de Géologie,
Ndjamena, Chad. Correspondence and requests for materials should be addressed to C.B. (email: Camille.bouchez@ univ-rennes1.fr)
Received: 21 September 2018 Accepted: 15 April 2019 Published: xx xx xxxx
www.nature.com/scientificreports
www.nature.com/scientificreports/
tests reached three orders of magnitude above the natural 36Cl level18 and 36Cl is not affected by radioactive decay
(t1/236Cl = 301,000 years) for the time periods of interest. The nuclear 36Cl imprints in hydrological systems have
therefore been used to estimate processes at a small scale in aquifers, soils or caves19–22 but, to our knowledge, have
not been used to identify catchment characteristics on a regional scale.
Here, we developed an innovative approach based on 36Cl contents in all the components of the water cycle, to
estimate regional-scale hydrological catchment characteristics in the LCB. First, the distribution of 36Cl in rivers,
lakes and aquifers along a 500 km north-south transect was used to characterize both surface water and ground-water dynamics and infer their interactions. Second, from the combined study of the chloride and 36-chloride cycles, the hydrologically active proportion of the catchment was quantified and its mean transit time was evalu-ated. Third, the recharge rates of the aquifers were calculevalu-ated.
Hydrology of the Lake Chad Basin revealed by the spatial distribution of
36Cl.
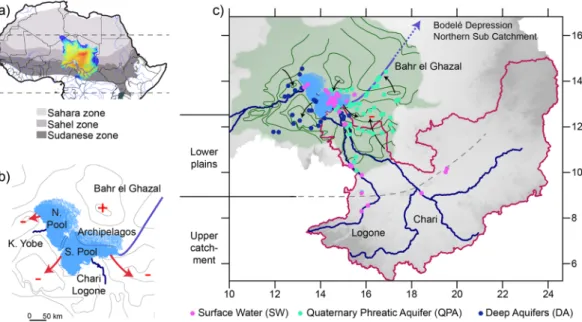
The LCB is locatedin the centre of the Sahel and spans contrasting eco-climatic areas (Fig. 1), from south to north as a consequence of latitudinally decreasing rainfall. The Sudanese zone (~8°N–12°N) receives a mean annual rainfall between 1300 mm and 600 mm and is covered by dry forests and woody grasslands. The Sahelian zone (~10°N–16°N), with an annual rainfall between 600 and 200 mm, is dominated by grasslands and the Saharan zone (~16°N–30°N) is a desert with rainfall below 200 mm/yr23. Its hydrology is dominated by the Chari-Logone river that drains water
from the southern humid Sudanese zones into the endorheic Lake Chad24 (Fig. 1). Lake Chad is very sensitive to
climatic changes as its surface decreased from 25,000 km2 to 4,000 km2 during the severe drought that affected
the Sahel in the 1980s25. Groundwater occurs in saprolite aquifers in the Sudanese upstream part of the catchment
(referred to as UCSA) and in large sedimentary aquifers in the Sahelian downstream part. From the deepest to the shallowest, the main downstream aquifers are the confined Continental Terminal and Pliocene aquifers (referred to as Deep Aquifers, DA) and the shallow Quaternary phreatic aquifer (referred to as QPA) (Fig. S-A).
One hundred and thirty-five samples of rainfall, rivers, Lake Chad waters and groundwater of the QPA and DA were collected over the Chari-Logone catchment, a sub-catchment of the Lake Chad Basin, and analysed for
36Cl, δ18O, δ2H and major elements (S.M. 2 for details on the hydrogeological settings, sampling points, chemical and
isotopic analyses and raw data). Groundwater samples with high concentrations in both Cl− and NO
3− could be
indicative of human pollution by agricultural or industrial inputs, and were therefore excluded from the following results (8/71 samples, S.M. 2.2 - Table S1 - Fig. S-B).
A large range of 36Cl/Cl ratios (10–5000 × 10−15 at at−1) and chloride concentrations (0.1–300 mg L−1) were
measured (Fig. 2). In the DA, 36Cl/Cl ratios did not exceed 150 × 10−15 at at−1 while shallow QPA groundwater
and surface waters had similar ranges of 36Cl/Cl ratios, between 200 and 5000 × 10−15 at at−1. DA groundwater
also had significantly more depleted δ18O and δ2H compositions than QPA groundwater and surface waters (Fig.
S-C). The low 36Cl/Cl ratios (down to 10 × 10−15 at at−1) and depleted δ18O values in the DA water samples mark
old groundwater recharged during previous humid periods. Based on the radioactive decay of 36Cl, groundwater
ages up to 1 Ma were suggested in the deep aquifers26.
Figure 1. Lake Chad Basin location. (a) Extent of Lake Chad basin (2.5 million km2), coloured by elevation
(dark blue >1000 m, dark red <200 m), with climatic zones and hydrological network. (b) Present-day Lake Chad (Southern Pool: S.Pool, Northern Pool: N.Pool and Archipelagos), main tributaries (Chari-Logone, Komadougou Yobe: K. Yobe) and present-day dry Bahr El Ghazal overflow channel. Arrows indicate flow directions. (c) Sampling locations (pink: Surface Water (SW), green: Quaternary Phreatic Aquifer (QPA), blue: Deep Aquifers (DA), Table 1 SI) with Chari-Logone catchment in red, Chari, Logone and Komadougou Yobe rivers in dark blue, Lake Chad in light blue, QPA extent and piezometric lines in green. Information on sampling points is available in Table S1.
www.nature.com/scientificreports
www.nature.com/scientificreports/
QPA groundwaters have 36Cl/Cl ratios between 100 and 5000 × 10−15 at at−1. A constant 36Cl/Cl ratio of
216 ± 23 × 10−15, independently of the chloride concentration, was measured in a large number of samples
located all across the QPA (n = 25, Fig. 2). It corresponds to the natural 36Cl/Cl atmospheric input in this region,
from which a natural 36Cl fallout of 9 ± 5 at m−2 s−1 can be calculated (S.M. 3.2). This value is consistent with 36Cl fallout latitude-dependent modelling yielding 10 at m−2 s−1 in the 10 to 20°N latitudinal band17. Only two
groundwater samples in the QPA have a 36Cl/Cl ratio lower than the natural atmospheric ratio, showing that
halite dissolution is not a major source of chloride in the LCB. QPA groundwaters with 36Cl/Cl ratios above the
natural atmospheric ratio trace an anthropogenic source of 36Cl linked to nuclear tests performed in the 1960s.
QPA waters that contain bomb-produced 36Cl mark a recharge during the last 60 years, commonly referred to as
modern groundwaters6. Conversely, and because present-day surface waters still show ratios above the natural
atmospheric ratio, groundwater samples that exhibit 36Cl/Cl ratios within the natural background level mark a
recharge prior to the nuclear tests and thus older than 60 years.
The age but also the origin of the recharge of the QPA can be inferred from combining 36Cl data with δ18O
data, since as a result of the progressive evaporation of water flowing towards the terminal Lake Chad, the surface waters show a wide range of δ18O compositions (δ18O rainfall = −4‰, δ18O river = −3‰, δ18O lake = 2 − 10‰).
Modern groundwaters (36Cl-enriched) are found in the vicinity of the Chari-Logone river and Lake Chad
(δ18O-enriched), showing that focused recharge tied to the surface hydrological network dominates in the QPA,
as expected in semi-arid environments7 (Fig. S-D). Pre-modern groundwaters (36Cl-background) can be
clas-sified into δ18O -enriched samples (δ18O > −2‰) and δ18O -depleted samples (δ18O < −2‰). δ18O -enriched
pre-modern groundwaters are located around the Bahr El Ghazal (Fig. 1), an overflow channel of Lake Chad, active only during high levels of the lake (h > 283 m, latest overflow in the 1950s). High-level Lake Chad stages therefore increase recharge of the QPA. δ18O –depleted pre-modern groundwaters, characterized by higher total
dissolved solutes (EC > 1500 μS cm−1), are located in piezometric depressions, which are common but poorly
understood hydrogeological features throughout the Sahel27,28. 36Cl/Cl ratios similar to present-day background
ratios and 14C contents above 50 pmc (S.M. 5.3) also point to Holocene waters29 Therefore, groundwaters of the
piezometric depressions are likely related to the replenishment of Sahelian aquifers during the African Humid Period30, from 12,000 to 5,000 years ago31.
Present-day surface waters depicted enriched 36Cl/Cl ratios, while rainfall ratios fell to around the natural 36Cl/
Cl ratio, even if the restricted rainfall sampling might not be fully representative of the 36Cl annual variability32
(Fig. 2). The presence of nuclear 36Cl in surface waters and not in rainfall highlighted an input of long-term
chlo-ride, carrying anthropogenic 36Cl, during water transfer through the subsurface. The upper Chari-Logone, the
lower Chari-Logone rivers and the Southern Pool of Lake Chad (Fig. 1) had similar 36Cl signatures (Table S1),
suggesting that anthropogenic 36Cl entered the headwaters in the Sudanese part of the LCB and was preserved
downstream. The Komadougou Yobe river, which drains the Sahelian region between Niger and Nigeria (Fig. 1), had less 36Cl-enriched waters than the Chari-Logone, revealing different water dynamics between these two
sub-catchments (Table S1).
The 36Cl data gathered on LCB waters show that shallow aquifers are relevant objects to determine the 36Cl/Cl
regional natural background, as they integrate spatial and temporal variations of 36Cl in rainfall32. Data show Figure 2. Distributions of 36Cl/Cl ratios measured in waters of the Lake Chad Basin. 36Cl/Cl (x10−15 at at−1)
ratios as a function of chloride concentration (mg L−1) with analytical uncertainties (1-sigma), measured in all
water components of the LCB: rainfall (black), surface waters (pink), QPA (green) and DA (blue). The 36Cl/Cl
natural atmospheric input for the region (216 ± 23 × 10−15 at at−1, see calculations SI section 4.1) is represented
www.nature.com/scientificreports
www.nature.com/scientificreports/
that the upstream Sudanian reach of the Chari-Logone river is gaining and received input from 36Cl-enriched
subsurface waters, while the downstream Sahelian reach of the Chari-Logone is losing and recharges the QPA.
Quantification of the present-day hydrologically active surface of the Lake Chad Basin.
Thechloride mass balance was calculated under the assumption that anthropogenic Cl sources were negligible compared to natural Cl deposition. The chloride export through the Chari-Logone (6.9 ± 3.4 × 10⁶ kg yr−1, S.M.
2.3) corresponds to 12 ± 8% of the chloride that was deposited on the total surface of the Chari-Logone catchment
(1 ± 0.2 kg yr−1 ha−1 × 600 000 km2 = 6 ± 1 × 10⁷ kg yr−1, S.M. 3.1 and 4.3). The majority of Cl deposition was thus
not exported through the Chari-Logone river, indicating that a large portion of deposited Cl accumulates in the basin because most of the rainfall is intercepted before reaching the main river. Several climatic and geomor-phological features of the catchment could explain this large discrepancy between precipitation and river flows. First, this region is characterized by very high evaporation rates (1300–2000 mm yr−1). Second, long distances to
the closest drain, and low slopes of the catchment landscape, could exacerbate water evapotranspiration. Third, because the DA only outcrops in the south of the catchment, some of the rainfall is likely to recharge this aquifer and therefore not contribute to the surface water cycle.
The chloride deficit between deposition and river export was as high as 88 ± 8%, suggesting that only 12 ± 8% of the catchment is hydrologically connected with the Chari-Logone network. Over this connected part of the catchment, a runoff coefficient of 29 ± 20% was calculated based on the downstream runoff and a rainfall rate of 1350 ± 200 mm yr−1, which corresponds to the average rainfall over the 12 ± 8% most humid part of the
catch-ment. Therefore, the previous estimate of a 7% runoff coefficient33over the entire basin is misleading as it neglects
climatic heterogeneity. Here we distinguished between disconnected areas, with a 0% runoff coefficient and where salt accumulates, from connected areas, with a positive runoff coefficient and where chloride is transported to the river. We determined a theoretical precipitation over potential-evapotranspiration ratio threshold of 0.95 (S.M. 4.3), below which an area is considered to be disconnected from the main river and chloride accumulates either in soils or aquifers or is exported by eolian transport. This value is higher than the threshold values typically encountered in arid regions34 but since it is close to unity, it indicates that the hydrology of this catchment is very sensitive to
changes in precipitation. The large proportion of disconnected areas together with the strong control of climate on surface hydrology might yield rapid connections or disconnections of sub-catchments. This could be one explanation for the non-linear dynamics of Sahelian catchments observed previously11. It also suggests that in arid
regions, the chemical memory effects of catchments are likely to be relatively important35.
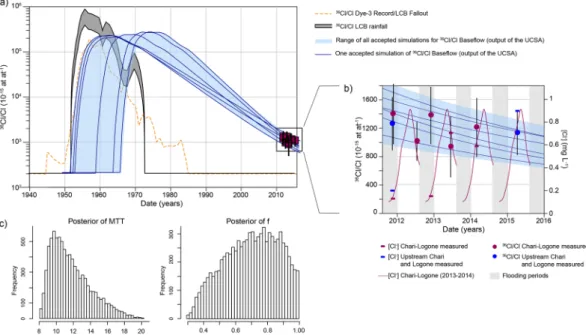
Figure 3. Mean transit time in the saprolite aquifer (UCSA), located in the Sudanese zone and supporting
baseflow of the Chari Logone in the Sahelian zone. (a) Measured 36Cl/Cl in the Chari-Logone (red squares), 36Cl/Cl range in rainfall (gray band) – calculated from simulated 36Cl deposition39 and calculated Cl depositions
on the LCB, 36Cl/Cl measured at Dye-351 (orange dotted line), simulated 36Cl/Cl of baseflow (=output of the
bedrock aquifer): envelope of all simulations in pale blue and individual realizations of the EPM (with different MTT and f) in dark blue lines. (b) Measured (purple and blue dots) and simulated (envelope in pale blue and individual simulations in dark blue lines) 36Cl/Cl in the Chari-Logone, and measured [Cl-] (purple lines) in the
Chari-Logone between 2011–2015. Data are available in Table S2 and calculations are fully described in the SM. Error bars on measured 36Cl/Cl account for both analytical errors and uncertainties of the baseflow proportion
estimate. (c) Posterior distributions of parameters MTT and f calculated from accepted parameters of the MCMC (15%).
www.nature.com/scientificreports
www.nature.com/scientificreports/
Determination of transit time in the upper Sudanian sub-catchment.
The 36Cl/Cl ratio measuredin the Chari-Logone river decreased over the sampling period, which can be attributed to a progressive dilution of the bomb-produced 36Cl18 (Fig. 3). The measured 36Cl/Cl ratios were used to determine the water transit time
in the connected part of the Chari-Logone catchment, where water transit time can be estimated from chloride transit time, as chloride does not accumulate in this part of the catchment. To do so, the 36Cl/Cl ratio in the
Chari-Logone headwaters was simulated between 1956 and 2015, by a mixing model between surface runoff and subsurface runoff through the UCSA (S.M. 4.1 and 4.2). The mixing proportion was determined via three meth-ods, Na+ mass balance36, δ18O amplitude ratio2 and hydrograph separation37. The 36Cl/Cl time series in surface
runoff was taken equal to the 36Cl/Cl time series of rainfall. The 36Cl/Cl time series in the baseflow was simulated
by convoluting the 36Cl/Cl time series of rainfall with an Exponential-Piston flow model (EPM) with two
param-eters, the mean transit time (MTT) and the ratio of exponential to piston flow (f) (SM section 4.2). The choice of the EPM to represent the transit time distribution within the aquifer was motivated by the geometry of an uncon-fined aquifer sampled at its outlet (in the river)38. The 36Cl/Cl ratio of rainfall between 1950 and 2015 was obtained
from worldwide simulations of bomb-produced 36Cl deposition39 divided by atmospheric chloride deposit over
the catchment (SM section 3.1 and 3.4). Combined uncertainties of 36Cl and Cl depositions yield a range of 36Cl/Cl
time series of rainfall (Fig. 3). Oriented Markov Chain Monte Carlo procedures using a Metropolis-Hasting algo-rithm (n = 10 000 simulations) were implemented with ten input 36Cl/Cl rainfall series, uniformly distributed
within the calculated range of 36Cl/Cl time series in rainfall. Analytical uncertainties on observed 36Cl/Cl in
the Chari-Logone river were taken into account in the calculation of the lognormal likelihood function of the Metropolis-Hasting algorithm40. Posterior distributions of the two parameters (MTT and f) were calculated based
on the accepted set of parameters of all Metropolis-Hasting runs. Therefore, the distributions of parameters reflect the deviation which would still match 36Cl/Cl input of rainfall within its uncertainty, as well as the measured 36Cl/Cl
ratios within their standard analytical error.
The annual subsurface runoff accounted for 60% (±10%) of the Chari-Logone discharge and for 70% (±10%) of Cl inputs. MTT of 9.5 ± 2 years and a proportion of exponential flows of 0.8 ± 0.2 were estimated (Fig. 3). Consistently with previous studies of catchments with a MTT below 40 years15, the model was found less sensitive
to the f parameter than to the MTT, which is supported by the higher standard deviation of f compared to MTT. Simulations matched the observed 36Cl/Cl ratios and their decreasing trend (Fig. 3). However, the same
calibra-tion procedure using other models yielded MTT ranging between 2 and 12 years, with a maximum of likelihood around 3 years (S.M. 4.3). The estimated MTT might therefore be overestimated by the EPM model. As the pro-ductive hydrological area is restricted to a small sub-catchment, uncertainties associated with aggregation in the determination of MTT are likely to be limited under the present climatic conditions. However, if the catchment wets up, the contribution of groundwater from other sub-catchments is likely to cause aggregation effects yield-ing large errors in the estimation of the MTT2,41. High flows were slightly more enriched in 36Cl than low flows,
although this difference is within the range of uncertainties associated with the lumped-parameter model. At low flows, 36Cl could be immobilized and subsequently remobilized at high flows. A seasonal retention of Cl could
therefore occur in the productive basin, but may be buffered at an annual time step, which is consistent with short flows in the unsaturated zone suggested by the small piston flow proportion parameter (0.2)15,38.
Quantification of groundwater recharge in the upstream Sudanian part and the downstream
Sahelian part.
Based on the water, Cl and 36Cl budgets, we inferred that the hydrologically active surfacewas restricted to 12 ± 8% (70 000 km2) of the total surface of the catchment with a total runoff coefficient of
29 ± 20%, 60 ± 10% of which transited through the UCSA with a mean transit time of 9.5 ± 1 years. Therefore, the UCSA is characterised by a recharge rate of 240 ± 170 mm yr−1 (60% of 29% of 1350 mm) and an equivalent
depth of groundwater stored of 2.3 ± 1.6 m (0.24 * 9.5), consistently with global estimates of modern groundwater volumes6.
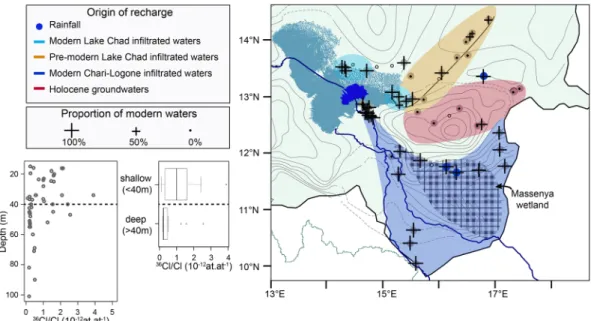
In the Sahelian part of the catchment, the 36Cl and Cl distributions in groundwaters of the QPA were
inter-preted by a binary mixing between old groundwater and modern groundwater, affected by evaporation (Fig. S-F). On average, waters recharged since 1952 account for 94 ± 8% of groundwater in the vicinity of the hydrological network and only 19 ± 32% further away, which confirms that recharge derives mainly from nearby streams in the Sahelian part of the catchment (Fig. 4). Modern groundwaters were only found at shallow depth (<40 m), which corresponds to the upper half of the aquifer (Fig. 4). A present-day annual renewal rate of 0.74 ± 0.06% yr−1 (0.94
* 0.5/(2015–1952)) and a recharge rate of 78 ± 7 mm yr−1 can be derived for groundwater close to the
hydrolog-ical network (using mean saturated thickness and porosity of respectively 35 m and 0.3). However far from the hydrological network, recharge is much lower and we estimate a present day annual renewal rate of 0.1 ± 0.3% yr−1 and a recharge rate of 16 ± 27 mm yr−1. Recharge estimates are higher than present-day withdrawal rates out
of the QPA42.
Sahelian water resources.
Mean transit time in a complex hydrogeological system provides a first indi-cation about its potential to buffer hydrologic variability43. The Sahel shows quite homogeneous climatic andgeologic settings and its hydrology is strongly controlled by the humid zones of equatorial Africa (here named the Sudanese zone). The decadal mean transit time and the low storage capability of the basement aquifer providing baseflow demonstrate the vulnerability of Sahelian surface waters to potential climate or land-use changes in the tropical humid zone. Sahelian aquifers showed a present day recharge restricted to the south of the catch-ment and the near-surface hydrological network. However, the calculated renewal rate and the net infiltration rates suggested that Sahelian aquifers host a significant amount of water inherited mainly from past humid peri-ods but still recharged presently. Most of the Sahelian population resides in the south where one of the highest population growth rates in the world is recorded. In the South of the Chari-Logone, 100% of irrigation water is supplied by surface water, and 65% in the North42, while surface waters are vulnerable. On the other hand,
www.nature.com/scientificreports
www.nature.com/scientificreports/
Sahelian aquifers are not over-exploited, as recharge is higher than extraction rates, contrary to most aquifers in the world44. Therefore, if adequate infrastructures are developed and strong regulation policies are adapted to
prevent depletion44, Sahelian aquifers could act as a strategic freshwater resource, mitigating the high pressure on
water resources in the area.
The present study demonstrates the suitability of 36Cl to quantify the regional hydrological cycle and,
combined with Cl to distinguish between the chloride and water cycles. Our data suggest that a large proportion of the catchment is presently disconnected from the main drainage network. However, the present approach integrates processes over long time periods, from years to decades, and neglects short temporal variability, while extreme events were shown to be major drivers of groundwater recharge45,46. Extreme events might also have the
potential to reconnect formerly disconnected parts of the catchment, with unknown consequences for water qual-ity and water residence time distributions. As climate models predict higher frequency and intensqual-ity of extreme rain in the Sahel47, future studies should aim at gathering high-frequency data to evaluate the transient dynamic
of catchment hydrology in the Sahel.
Methods
Measurements of 36Cl were carried out by Accelerator Mass Spectrometry48 at the French AMS National facility,
ASTER at CEREGE49. Because of low chloride contents in surface and some groundwater samples, the addition
of a 35Cl enriched spike was required to reach a total chloride amount of 2 mg and to precisely determine the Cl
concentration using the ID-AMS technique50. Water samples were processed in batches of 10–15 samples with a
spiked blank and an unspiked blank at the end of each batch to estimate chemical contaminations on chloride con-centrations and on 36Cl/Cl ratios. Ultra-pure reagents were used to minimize contamination with natural chloride.
Chloride was extracted by precipitation of purified AgCl. Precipitates were dried and pressed in 6.6 mm diame-ter Ni-target holders. The measured 36Cl/Cl of spiked samples are at least one order of magnitude above spiked
blanks (36Cl/Cl = 4.0 10−15 at at−1, n = 12) and the calculated 36Cl/Cl sample ratios were corrected from the blanks.
Measured 36Cl/Cl of unspiked samples are at least one order of magnitude above unspiked blanks (36Cl/Cl = 1.0
10−15 at at−1, n = 19). Total uncertainties, including internal errors and external reproducibility, on the
determina-tion of 36Cl/Cl ratios and chloride concentrations by ID-AMS were respectively estimated at 7% and 5%50.
The calculations made on the 36Cl data are succinctly described in the main paper, and more extensively in the
Supplementary Materials.
References
1. Vörösmarty, C. J. et al. Global threats to human water security and river biodiversity. Nature 467, 555–561 (2010).
2. Kirchner, J. W. Aggregation in environmental systems-Part 1: Seasonal tracer cycles quantify young water fractions, but not mean transit times, in spatially heterogeneous catchments. Hydrol. Earth Syst. Sci. 20, 279–297 (2016).
3. McDonnell, J. J. et al. How old is streamwater? Open questions in catchment transit time conceptualization, modelling and analysis. Hydrol. Process. 24, 1745–1754 (2010).
4. Jasechko, S. Partitioning young and old groundwater with geochemical tracers. Chem. Geol. 427, 35–42 (2016).
5. Döll, P., Douville, H., Güntner, A., Schmied, H. M. & Wada, Y. Modelling Freshwater Resources at the Global Scale: Challenges and Prospects. Surv. Geophys. 37, 195–221 (2016).
Figure 4. Map of the modern recharge in the Quaternary Aquifer of the Lake Chad Basin. The map synthetises
the location and the source of the recharge of the quaternary aquifer in the downstream Chari-Logone basin. The proportion of modern water is represented by black crosses. The source of the infiltrated waters (inferred from 36Cl/Cl ratios and δ18O) is displayed with coloured zones. Black circles show polluted samples. See SM for
www.nature.com/scientificreports
www.nature.com/scientificreports/
6. Gleeson, T., Befus, K. M., Jasechko, S., Luijendijk, E. & Cardenas, M. B. The global volume and distribution of modern groundwater. Nat. Geosci. 9, 161–167 (2016).
7. Scanlon, B. R. et al. Global synthesis of groundwater recharge in semiarid and arid regions. Hydrol. Process. 20, 3335–3370 (2006). 8. Wohl, E. et al. The hydrology of the humid tropics. Nat. Clim. Change 2, 655–662 (2012).
9. Boyd, E. et al. Building resilience to face recurring environmental crisis in African Sahel. Nat. Clim. Change 3, 631–637 (2013). 10. Biasutti, M. Hydrology: What brings rain to the Sahel? Nat. Clim. Change 6, 897–898 (2016).
11. Descroix, L. et al. Spatio-temporal variability of hydrological regimes around the boundaries between Sahelian and Sudanian areas of West Africa: A synthesis. J. Hydrol. 375, 90–102 (2009).
12. Lebel, T. et al. AMMA-CATCH studies in the Sahelian region of West-Africa: An overview. J. Hydrol. 375, 3–13 (2009).
13. Alley, W. M., Healy, R. W., LaBaugh, J. W. & Reilly, T. E. Flow and Storage in Groundwater Systems. Science 296, 1985–1990 (2002). 14. Cook, P. G. & Solomon, D. K. Recent advances in dating young groundwater: chlorofluorocarbons, 3H3He and 85Kr. J. Hydrol. 191,
245–265 (1997).
15. Morgenstern, U., Stewart, M. K. & Stenger, R. Dating of streamwater using tritium in a post nuclear bomb pulse world: continuous variation of mean transit time with streamflow. Hydrol Earth Syst Sci 14, 2289–2301 (2010).
16. Stewart, M. K., Morgenstern, U. & McDonnell, J. J. Truncation of stream residence time: how the use of stable isotopes has skewed our concept of streamwater age and origin. Hydrol. Process. 24, 1646–1659 (2010).
17. Bentley, H. W., Phillips, F. M. & Davis, S. N. Chlorine-36 in the terrestrial environment. Handb. Environ. Isot. Geochem. 2, 427–480 (1986).
18. Bentley, H. W. et al. Thermonuclear 36Cl pulse in natural water. Nature 300, 737–740 (1982).
19. Cook, P. G. et al. Unsaturated zone tritium and chlorine 36 profiles from southern Australia: Their use as tracers of soil water movement. Water Resour. Res. 30, 1709–1719 (1994).
20. Tosaki, Y., Tase, N., Sasa, K., Takahashi, T. & Nagashima, Y. Estimation of Groundwater Residence Time Using the 36Cl Bomb Pulse.
Ground Water 49, 891–902 (2011).
21. Münsterer, C. et al. Cosmogenic 36Cl in karst waters from Bunker Cave North Western Germany – A tool to derive local
evapotranspiration? Geochim. Cosmochim. Acta 86, 138–149 (2012).
22. Poghosyan, A. & Sturchio, N. C. Temporal evolution of 36Cl abundances in the Great Lakes. J. Environ. Radioact. 144, 62–68 (2015).
23. White, F. La Vegetation de L’Afrique (The Vegetation of Africa). (IRD Editions, 1986).
24. Bouchez, C. et al. Hydrological, chemical, and isotopic budgets of Lake Chad: a quantitative assessment of evaporation, transpiration and infiltration fluxes. Hydrol. Earth Syst. Sci. 20(4), 1599–1619, https://doi.org/10.5194/hess-20-1599-2016 (2016).
25. Lemoalle, J., Bader, J.-C., Leblanc, M. & Sedick, A. Recent changes in Lake Chad: Observations, simulations and management options (1973–2011). Glob. Planet. Change 80–81, 247–254 (2012).
26. Bouchez, C. et al. Investigation of 36Cl Distribution: Towards a New Estimation of Groundwater Residence Times in the Confined
Aquifer of the LCB? Procedia Earth Planet. Sci. 13, 147–150 (2015).
27. Aranyossy, J. F. & Ndiaye, B. Étude et modélisation de la formation des dépressions piézométriques en Afrique sahelienne. Rev. Sci. Eau 6, 81 (1993).
28. Archambault, J. L’alimentation des nappes en Afrique Occidentale. Cpt R L’Hydro Soc Hydro Fr. 383 (1960).
29. Leduc, C., Sabljak, S., Taupin, J.-D., Marlin, C. & Favreau, G. Estimation de la recharge de la nappe quaternaire dans le Nord-Ouest du bassin du lac Tchad (Niger oriental) à partir de mesures isotopiques. Comptes Rendus Académie Sci. - Ser. IIA - Earth Planet. Sci. 330, 355–361 (2000).
30. Lézine, A.-M., Hély, C., Grenier, C., Braconnot, P. & Krinner, G. Sahara and Sahel vulnerability to climate changes, lessons from Holocene hydrological data. Quat. Sci. Rev. 30, 3001–3012 (2011).
31. Gasse, F. Hydrological changes in the African tropics since the Last Glacial Maximum. Quat. Sci. Rev. 19, 189–211 (2000). 32. Pupier, J. et al. Monthly record of the Cl and 36Cl fallout rates in a deciduous forest ecosystem in NE France in 2012 and 2013. Quat.
Geochronol. 35, 26–35 (2016).
33. Gac, J.-Y. Géochimie du bassin du lac Tchad: Bilan de l’altération de l’érosion et de la sédimentation. (ORSTOM, 1980).
34. Small, E. E. Climatic controls on diffuse groundwater recharge in semiarid environments of the southwestern United States. Water Resour. Res. 41, W04012 (2005).
35. Kirchner, J. W., Feng, X. & Neal, C. Fractal stream chemistry and its implications for contaminant transport in catchments. Nature 403, 524 (2000).
36. Yu, Z. & Schwartz, F. W. Automated calibration applied to watershed-scale flow simulations. Hydrol. Process. 13, 191–209 (1999). 37. Arnold, J. G. & Allen, P. M. Automated Methods for Estimating Baseflow and Ground Water Recharge from Streamflow Records1.
JAWRA. J. Am. Water Resour. Assoc. 35, 411–424 (1999).
38. Jurgens, B. C., Böhlke, J. K. & Eberts, S. M. TracerLPM (Version 1): An Excel
®
workbook for interpreting groundwater age distributions from environmental tracer data (2012).39. Heikkilä, U. et al. 36Cl bomb peak: comparison of modeled and measured data. Atmos Chem Phys 9, 4145–4156 (2009).
40. Kuczera, G. & Parent, E. Monte Carlo assessment of parameter uncertainty in conceptual catchment models: the Metropolis algorithm. J. Hydrol. 211, 69–85 (1998).
41. Stewart, M. K., Morgenstern, U., Gusyev, M. A. & Małoszewski, P. Aggregation effects on tritium-based mean transit times and young water fractions in spatially heterogeneous catchments and groundwater systems. Hydrol. Earth Syst. Sci. 21, 4615–4627 (2017).
42. SDEA. Schema Directeur de l’Eau et de l’Assainissement 2003–2020. (2003).
43. McGuire, K. J. & McDonnell, J. J. A review and evaluation of catchment transit time modeling. J. Hydrol. 330, 543–563 (2006). 44. Aeschbach-Hertig, W. & Gleeson, T. Regional strategies for the accelerating global problem of groundwater depletion. Nat. Geosci.
5, 853–861 (2012).
45. Taylor, R. G. et al. Evidence of the dependence of groundwater resources on extreme rainfall in East Africa. Nat. Clim. Change 3, 374–378 (2013).
46. Taylor, R. G. et al. Ground water and climate change. Nat. Clim. Change 3, 322–329 (2013).
47. Taylor, C. M. et al. Frequency of extreme Sahelian storms tripled since 1982 in satellite observations. Nature 544, 475–478 (2017). 48. Elmore, D. et al. Analysis of 36Cl in environmental water samples using an electrostatic accelerator. Nature 277, 22–25 (1979).
49. Arnold, M. et al. The French accelerator mass spectrometry facility ASTER: Improved performance and developments. Nucl. Instrum. Methods Phys. Res. Sect. B Beam Interact. Mater. At. 268, 1954–1959 (2010).
50. Bouchez, C. et al. Isotope Dilution-AMS technique for 36Cl and Cl determination in low chlorine content waters. Chem. Geol. 404,
62–70 (2015).
51. Synal, H.-A., Beer, J., Bonani, G., Suter, M. & Wölfli, W. Atmospheric transport of bomb-produced 36Cl. Nucl. Instrum. Methods Phys.
www.nature.com/scientificreports
www.nature.com/scientificreports/
Acknowledgements
Thanks are owed to the ASTER Team for measuring 36Cl at the ASTER-AMS, to Jean-Luc Seidel (HSM,
Montpellier) for major element analysis and to Jean-Luc Michelot (GEOPS) for 14C analyses at LMC14 laboratory
(CEA-CNRS-IRD- IRSN-MCC, France). This study was supported by the French National Research Institute for Sustainable Development (IRD), as well as by the Equipex ASTER-CEREGE and the LABEX OT-Med of the French Investissement d’Avenir program. The study was also funded by the ‘Fond Français de l’Environnement Mondial’ (FFEM) through the ‘Préservation du Lac Tchad: Contribution à la stratégie de développement du Lac’ project. The authors are grateful to the University of N’Djamena, the Centre National de la Recherche pour le Développement of Chad (CNRD), the Chadian Ministry of Hydraulics and the French Embassy in Chad for their logistical support. The authors are grateful to Jonas L. Schaper for his valuable comments on the manuscript.
Author Contributions
C.B., F.S., P.D., A.M.-N. conducted fieldwork. C.V.-C. and C.B. measured δ18O and δ2H compositions. F.S. lead the
Lake Chad Project, P.D., J.G. and B.H. designed the study. C.B. conducted sample preparations, chemical analysis, modelling, interpretation and writing. All authors contributed to the discussion of results and commented the manuscript.
Additional Information
Supplementary information accompanies this paper at https://doi.org/10.1038/s41598-019-43514-x.
Competing Interests: The authors declare no competing interests.
Publisher’s note: Springer Nature remains neutral with regard to jurisdictional claims in published maps and
institutional affiliations.
Open Access This article is licensed under a Creative Commons Attribution 4.0 International
License, which permits use, sharing, adaptation, distribution and reproduction in any medium or format, as long as you give appropriate credit to the original author(s) and the source, provide a link to the Cre-ative Commons license, and indicate if changes were made. The images or other third party material in this article are included in the article’s Creative Commons license, unless indicated otherwise in a credit line to the material. If material is not included in the article’s Creative Commons license and your intended use is not per-mitted by statutory regulation or exceeds the perper-mitted use, you will need to obtain permission directly from the copyright holder. To view a copy of this license, visit http://creativecommons.org/licenses/by/4.0/.