HAL Id: hal-03043458
https://hal.archives-ouvertes.fr/hal-03043458
Submitted on 7 Dec 2020
HAL is a multi-disciplinary open access
archive for the deposit and dissemination of
sci-entific research documents, whether they are
pub-lished or not. The documents may come from
teaching and research institutions in France or
L’archive ouverte pluridisciplinaire HAL, est
destinée au dépôt et à la diffusion de documents
scientifiques de niveau recherche, publiés ou non,
émanant des établissements d’enseignement et de
recherche français ou étrangers, des laboratoires
Long-Term Uplift in Northern Chile
Romain Jolivet, M. Simons, Z. Duputel, J.-A Olive, H. Bhat, Quentin Bletery
To cite this version:
Romain Jolivet, M. Simons, Z. Duputel, J.-A Olive, H. Bhat, et al.. Interseismic Loading of Subduction
Megathrust Drives Long-Term Uplift in Northern Chile. Geophysical Research Letters, American
Geophysical Union, 2020, 47 (8), pp.e2019GL085377. �10.1029/2019GL085377�. �hal-03043458�
Interseismic loading of subduction megathrust drives long term
1
uplift in northern Chile
2
R. Jolivet1,5, M. Simons2, Z. Duputel3, J.-A. Olive1, H. S. Bhat1& Q. Bletery4
3
1Laboratoire de Géologie, Département de Géosciences, École Normale Supérieure, CNRS UMR 8538, PSL Research
4
University, 75005 Paris, France 5
2Seismological Laboratory, California Institute of Technology, Pasadena, California, 91125, USA
6
3Institut de Physique du Globe de Strasbourg, Université de Strasbourg/EOST, CNRS UMR 7516, Strasbourg, France
7
4Université Côte d’Azur, IRD, CNRS, Observatoire de la Côte d’Azur, Géoazur, 250 rue Albert Einstein, Sophia Antipolis
8
06560 Valbonne, France 9
5Institut Universitaire de France, 1 rue Descartes, 75005 Paris, France.
10
Key Points:
11
• We propose an approach to quantify the ratio between elastic and inelastic
deforma-12
tion in subduction forearcs 13
• Two distinct correlations can be observed between interseismic and quaternary
up-14
lift rates 15
• We propose that 4 to 8% of interseismic uplift rates translates into persistent
defor-16
mation in Northern Chile 17
Abstract
18
Large earthquakes are the product of elastic stress that has accumulated over decades to 19
centuries along segments of active faults. Assuming an elastic crust, one can roughly esti-20
mate the location and rate of accumulation of elastic stress. However, this general frame-21
work does not account for inelastic, irrecoverable deformation, which results in large scale 22
topography. We do not know over which part of the earthquake cycle such deformation 23
occurs. Using InSAR and GNSS measurements, we report on a potential correlation be-24
tween long-term, inelastic and short-term, interseismic vertical rates in northern Chile. 25
Approximately 4 to 8% of the geodetically-derived interseismic vertical rates translates 26
into permanent deformation, suggesting topography of the forearc builds up during the 27
interseismic period. This observation provides a quantitative basis for an improved under-28
standing of the interplay between short-term and long-term dynamics along convergent 29
plate boundaries. 30
1 Introduction
31
Along a subduction interface, the quasi-continuous motion of converging plates leads 32
to the build up of elastic stress where the interface is locked [Savage, 1983]. Large earth-33
quakes, occurring as slip on the megathrust interface, redistribute elastic energy accu-34
mulated within the surrounding medium. In addition to these sudden changes in stress, 35
parts of the subduction interface may slip aseismically during the interseismic period, 36
either episodically during slow slip events [Hirose et al., 1999; Dragert et al., 2001] or 37
over decades to centuries [Mazzotti et al., 2000; Metois et al., 2016]. Averaged over the in-38
terseismic period, a coupling coefficient, γ, is usually used to describe the inferred local 39
slip deficit normalized by the long term convergence rate along the subduction megathrust 40
(Fig. 1). γ = 1 corresponds to a fully locked interface, with a potential for slip during fu-41
ture earthquakes. γ = 0 indicates an inferred slip rate equal to the local plate convergence 42
rate [Savage, 1983]. Subduction interfaces are paved with locked sections (i.e. portions of 43
the interface with γ ' 1) separated by creeping sections [e.g. Konca et al., 2008; Nocquet 44
et al., 2014] (i.e. γ << 1).
45
Large megathrust earthquakes uplift the surface located above a patch of slip and 46
induce subsidence around it [Savage, 1983; Vigny et al., 2011; Simons et al., 2011]. To 47
the extent that the coupling coefficient, γ, is stable through time, segments that ruptured 48
during a large event reload during the interseismic period causing surface deformation of 49
opposite sign to that occurring during the earthquake. In the most simplistic model, the 50
amount of slip during earthquakes should be balanced by the slip deficit that builds up in 51
the interim period, at least once integrated over many earthquake cycles. However, along 52
several subduction zones, the coastal domain, a region defined to extend from the coast 53
to the continental shelf (Fig. 1), experiences long-lived vertical displacement, either sub-54
sidence or uplift, over geological times (i.e. 105-106 years), for example as inferred from
55
the geometry of raised terraces in Chile [Saillard et al., 2009; Regard et al., 2010], Japan 56
[Matsu’ura, 2015] or Greece [Mouslopoulou et al., 2016] or the erosion patterns along 57
rivers in Mexico [Ramírez-Herrera et al., 2018]. Such long-term, irrecoverable deforma-58
tion can be modeled with a purely plastic rheology, for instance using critical taper theory 59
[Davis et al., 1983]. Such models, however, cannot address the question of when inelastic 60
deformation cumulates in the forearc with respect to the different phases of the earthquake 61
cycle. 62
For comparison, typical vertical displacement rates over geological times for the 63
coastal domain are generally one order of magnitude lower than typical interseismic uplift 64
or subsidence rates [a fraction of millimeter per year vs several millimeters per year, e.g. 65
Béjar-Pizarro et al., 2013; Jolivet and Simons, 2018; Regard et al., 2010; Melnick, 2016;
66
Hashima and Sato, 2017, Fig. 1]. Comparatively, large megathrust earthquakes will
gen-67
erate meter-scale vertical displacements every time they occur [e.g. Vigny et al., 2011; Si-68
mons et al., 2011]. We cannot yet assess how much permanent uplift or subsidence occurs
69
during earthquakes [Baker et al., 2013; Melnick, 2016] or during the interseismic period 70
[Béjar-Pizarro et al., 2013; Saillard et al., 2017], as our understanding of the earthquake 71
cycle is limited to simplified elastic and visco-elastic models which do not allow for per-72
manent deformation to build up within the upper crust. 73
Focusing on the interseismic period, correlations between distributions of coupling 74
coefficients along megathrusts and morphotectonic features [Victor et al., 2011; Saillard 75
et al., 2017] or large amplitude gravity anomalies [Song and Simons, 2003; Wells et al.,
76
2003] suggest that interseismic fault locking is to first order a long-term feature, stable 77
over many seismic cycles. Interseismic fault locking is thought to imprint its signature 78
in the morphology of the subduction forearc. For instance, a qualitative relationship has 79
been described between the maximum depth of high coupling coefficient along subduc-80
tion megathrust and the position of the coastal domain [Béjar-Pizarro et al., 2013; Rousset 81
et al., 2015; Mouslopoulou et al., 2016; Saillard et al., 2017] (Fig. 1). If part of the uplift
82
measured during the interseismic period is not recovered elastically during earthquakes oc-83
curring along the megathrust, then anelastic deformation accumulates and the coastal do-84
main will uplift over geological times [Song and Simons, 2003; Mouslopoulou et al., 2016; 85
Saillard et al., 2017]. Because most of the slip is often located offshore, earthquakes along
86
subduction zones tend to lower the coastal domain [Simons et al., 2011; Duputel et al., 87
2015]. However, if coseismic slip reaches depths below the coastline, the coastal domain 88
will uplift coseismically [Grandin et al., 2016; Vigny et al., 2011]. 89
The residual permanent vertical displacement will therefore depend on the relative 90
balance between coseismic slip and interseismic slip deficit and on the position of the 91
hinge line with respect to the coastal domain [Saillard et al., 2017]. Contradictory conclu-92
sions have been reached considering the contribution of earthquakes and interseismic load-93
ing to the permanent deformation of the forearc. For instance, Melnick [2016] proposes 94
that intermediate-depth earthquakes are responsible for the uplift of the northern Chilean 95
coast while he discards the influence of interseismic fault locking. Other studies point to 96
spatial relationships between patterns of coupling coefficients and long term features of 97
the forearc in support of the influence of interseismic fault locking on topography building 98
[Béjar-Pizarro et al., 2013; Rousset et al., 2015; Mouslopoulou et al., 2016; Saillard et al., 99
2017]. 100
2 Data and Methods: The case of northern Chile
101
Here, we use direct estimates of interseismic displacement rates and compare these 102
with long term uplift rates in subduction regions. Geodetic measurements of surface dis-103
placement rates, including GNSS (historically referred to as GPS) and InSAR (Synthetic 104
Aperture Radar Interferometry) measurements, are available over many subduction fore-105
arcs. InSAR provides measurements of surface deformation along the direction of the 106
Line-Of-Sight (LOS) of a satellite. For SAR acquisitions from the Envisat satellite, for 107
instance, the LOS incidence angle is approximately 23◦resulting in a high sensitivity to
108
vertical displacements. However, InSAR is also sensitive to horizontal displacements con-109
founding attempts to isolate a purely vertical component of displacement. GNSS provides 110
time series of three-component displacements at sparsely distributed locations. However, 111
uncertainties on GNSS-derived vertical displacement rates typically reach several millime-112
ters per year, making it a challenge to measure the sub-millimetric displacement rates ex-113
pected from permanent deformation [Melnick, 2016]. 114
One solution is to estimate a model of the distribution of coupling coefficients along 115
the megathrust that captures all measurements of vertical, horizontal and LOS displace-116
ments along with their respective uncertainties in order to produce an a posteriori estimate 117
of vertical interseismic motion, and compare those predictions with long-term displace-118
ment rates. Along subduction zones, where locking of the megathrust is mostly offshore, 119
it is possible to infer locked asperities with geodetic measurements made onshore [Béjar-120
Pizarro et al., 2013; Lin et al., 2015]. However, because we are generally limited to
ob-121
servations made at the surface and onshore, inferred distributions of coupling coefficient 122
often differ significantly due to different modeling strategies and different regularizations 123
of the inverse problem. In the present study, we do not particularly care about this non-124
uniqueness since we only use these models to provide the best possible estimate of verti-125
cal displacement rates over the interseismic period consistent with the available geodetic 126
data. Effectively, models are used to interpolate the data. 127
Considering the duration of the modern instrumental period with respect to both 128
the characteristic time of the earthquake cycle and the longer time required to accumulate 129
significant anelastic deformation, it is crucial to focus on a region where we will be able 130
to measure surface displacements that are unambiguously related to interseismic loading 131
of the megathrust. In particular, the relaxation period following a large earthquake might 132
extend over decades and could strongly influence what is considered as interseismic de-133
formation [Trubienko et al., 2013; Hashima and Sato, 2017]. Finally, this region must be 134
densely sampled by GNSS measurements and its geographical characteristics must be opti-135
mal for InSAR. 136
Northern Chile has been hit by several earthquakes, including the large, Mw7.7,
To-137
copilla earthquake [Bejar-Pizarro et al., 2010; Schurr et al., 2012] in 2007 and the great, 138
Mw8.1, Iquique earthquake [Duputel et al., 2015] in 2014. There, inferences of
along-139
strike variations of coupling coefficients are broadly consistent between models [Metois 140
et al., 2016; Schurr et al., 2014]. The last great megathrust event prior to the 2014 Iquique
141
earthquake occurred in 1877 with an estimated magnitude of 8.6 [Comte and Pardo, 1991; 142
Metois et al., 2013]. Therefore, we assume that surface displacement rates in this region
143
prior to the 2014 Iquique earthquake are not significantly changing due to postseismic vis-144
cous relaxation and truly reflect the effect of locking along the megathrust. 145
The relative aridity of northern Chile makes it an ideal target for InSAR measure-146
ments [e.g. Pritchard and Simons, 2002; Béjar-Pizarro et al., 2013]. We use SAR data ac-147
quired by the Envisat satellite over the 2003-2010 period to derive a map of LOS ground 148
velocity (Fig. 2). We use a multi-pixel method to infer displacement time series, displace-149
ment rates averaged over the observation period and earthquake-related offsets accounting 150
for spatial covariances as well as other nuisance parameters [Jolivet and Simons, 2018]. 151
Our approach resolves long wavelength signals in SAR acquisitions, hence does not re-152
quire input from GNSS data. The resulting map of LOS displacement rates highlights a 153
variable uplift rate along the coastal domain, with LOS rates spanning a 0-4 mm/yr range. 154
Measurements of horizontal interseismic displacement rates are available thanks to the 155
dense continuous GNSS measurements that have been deployed since 2000 [Simons et al., 156
2010] and are complementary to our InSAR displacement rate maps [Metois et al., 2016]. 157
We use a backslip approach to estimate the coupling coefficient from geodetic dis-158
placement rates [Savage, 1983] and apply a Bayesian formalism to explore the range of 159
possible models given the GNSS and InSAR surface rates [Jolivet et al., 2015]. The mean 160
interseismic coupling model is broadly consistent with the most recent published studies 161
[Li et al., 2015; Metois et al., 2016]. We infer a highly coupled segment extending north-162
wards from, at least, Antofagasta in the south up to 20.5◦S and a relatively less coupled
163
segment offshore Iquique (Fig. 3). The mean model has lower coupling coefficients at the 164
trench but this feature is not resolved given that we are limited to observations made on-165
shore (see supplementary materials). There is a clear and robust separation between the 166
coupled segments, with a narrow barrier with a coupling coefficient of 0 (maximum a pos-167
teriori, mean equals 0.1 ± 0.1). Contrary to recently published models [Li et al., 2015;
168
Metois et al., 2016], we do not infer fault locking underneath the south American
conti-169
nent. This inference of no kinematic locking extending below the coastline is driven by 170
the InSAR observations indicating only onshore uplift [Béjar-Pizarro et al., 2013]. 171
Our goal is to compare the short-term vertical displacements predicted by our cou-172
pling models to long-term estimates of coastal uplift. Figure 4 shows the vertical displace-173
ment rates over the forearc predicted by our mean coupling model. To first order, topog-174
raphy shows striking similarities with this pattern of vertical rates, as maximum uplift is 175
located in the coastal cordillera. However, topography is a signal integrated over millions 176
of years, amalgamating the effects of tectonics, mantle dynamics and erosion. Therefore, 177
topography alone cannot be simply used to study the influence of short term megathrust 178
dynamics on the building of topography. 179
The presence of marine terraces all along the chilean coast documents the long term 180
uplift of the coastal domain over the quaternary [Regard et al., 2010; Saillard et al., 2017]. 181
Using a landscape evolution model that accounts for variations in sea level to reproduce 182
the topography of the coastal domain and, in particular, the shape of the so-called coastal 183
rasa, based on the competition of wave erosion and uniform uplift, Melnick [2016] de-184
termined uplift rates over the quaternary with dense spatial sampling. These rates quan-185
tify the uplift of the Chilean coast at an average rate of 0.13 ± 0.04 mm/yr since, at least, 186
1 Myr. 187
Lateral variations within these quaternary uplift rates are visible along the coast. 188
Melnick[2016] finds no obvious correlation between the long-term rates and interseismic
189
rates. However, the interseismic model used to predict interseismic rates assumes fully 190
homogeneous kinematic locking of the megathrust down to 35 km-depth without along-191
strike variations, which is inconsistent with our observations and model of coupling co-192
efficient (Fig. 3) as well as with some previously published models [e.g. Li et al., 2015; 193
Metois et al., 2016].
194
3 Results: comparing short and long term uplift rates
195
In contrast to previous analysis, we observe a slight correlation (Pearson product-196
moment correlation coefficient of 0.5) between the distribution of coupling coefficients 197
offshore (i.e. 50 km offshore in the direction of convergence) and quaternary uplift of the 198
coastal domain (Fig. 4). Quaternary uplift appears faster where coupling coefficient is high 199
along the megathrust. However, because of the inherent limitations in inferred models of 200
coupling (i.e. non-uniqueness), we rather rely on the relationship between predicted inter-201
seismic and long-term uplift. Effectively, as alluded to earlier, we consider our coupling 202
model as no more than a physics-based interpolation, including uncertainties, of interseis-203
mic surface displacements along the coast. Although we do not include vertical GNSS-204
derived velocities in our inversion, a first order comparison of the predicted interseismic 205
uplift at available GNSS stations suggests a relatively correct agreement with our predic-206
tions [see supp. mat. and Blewitt et al., 2016]. Such validation against an independent 207
data set should be taken with caution as formal uncertainties in GNSS-derived velocities 208
might be underestimated, especially for vertical rates of motion. In addition, we need to 209
consider that numerous active faults have been recognized in the forearc, in particular over 210
the regions of Tocopilla, Salar Grande and North of Pisagua [Allmendinger and González, 211
2010]. All types of faulting, reverse, normal and strike slip, active over the neogene and 212
quaternary have been identified in specific regions along the coastline, which could indi-213
cate along strike variations in the long term behavior of the forearc. 214
Plotting the interseismic, predicted, uplift rates with respect to the modeled quater-215
nary uplift rates, it appears that points can be separated in two groups (please refer to sup-216
plementary materials for a plot without our interpretation). Within each group, short and 217
long term rates correlate. After separating these points in two distinct groups, we find that 218
there is a spatial coherence within these groups. In a first group (colored dots on figure 219
4), we consider points from regions that have experienced extensive neogene and quater-220
nary active faulting according to Allmendinger and González [2010], while in the second 221
group, we consider points from regions devoid of active faulting (black dots in Fig. 4). 222
Points are not randomly taken in a group or the other and rather cluster spatially along the 223
coastline. Taken independently, the correlation between short-term and quaternary uplift 224
shows correlation coefficients of 0.74 and 0.76 for the areas with and without recent ac-225
tive faulting, respectively. While the separation might sound ad hoc at first, we believe the 226
spatial coherence of these two groups of points is the signature of an along-strike variable 227
behavior of the forearc subjected to interseismic loading. 228
For a given interseismic uplift rate, estimates of long term coastal uplift are consis-229
tently slower in areas that have experienced significant quaternary faulting. We fit both 230
data sets separately using a Bayesian regression technique (see supp. mat.) and infer the 231
distribution of plausible linear relationships between quaternary and short-term uplift. In 232
both cases, we observe that inferred quaternary uplift rates correspond to 4 to 8% of our 233
estimated interseismic rates in northern Chile. In addition, it appears that, while a zero-234
valued interseismic uplift rate corresponds to a zero-valued quaternary uplift rate for the 235
regions affected by recent active faulting, this is not the case for regions without identi-236
fied active faulting. In the later case, a zero-valued interseismic uplift rate corresponds to 237
a 0.1±0.05 mm/yr quaternary uplift rate. 238
4 Discussion: Internal anelastic deformation and the role of faulting
239
We interpret the observed correlation(s) between million-year time scale uplift and 240
present-day interseismic uplift as the long-term signature of interseismic deformation. 241
We explain the distribution of short vs. long term uplift rates as the combination of three 242
overlapping mechanisms. First, a broad regional scale uplift of 0.1±0.05 mm/yr affects 243
the whole coastline in northern Chile. Second, 4 to 8% of the interseismic uplift is not 244
balanced by co- and post-seismic slip related to large megathrust earthquakes. Third, a 245
systematic offset of about 0.1 mm/yr is observed between regions that have and have not 246
experienced active faulting over the quaternary. Our interpretation therefore suggests that 247
interseismic and coseismic deformations do not cancel each other over many cycles and 248
that approximately 4 to 8% of the vertical interseismic uplift is permanent. While the im-249
print of fault locking on the forearc morphology has been previously hypothesized based 250
on the trench parallel gravity anomaly [e.g. Song and Simons, 2003; Wells et al., 2003], we 251
provide here a quantitative estimate of the amount of permanent deformation for northern 252
Chile. 253
Then, two hypotheses could explain the systematic difference of uplift rates in re-254
gions with and without recent (neogene to quaternary) active faulting. First, slip along 255
shallow structures within the forearc may have dissipated part of the energy that should 256
have transferred into gravitational potential energy (i.e. topography), hence a lesser effi-257
ciency at building topography. Second, the presence of such pervasive faulting could im-258
ply variations in forearc material properties along the coast. These hypotheses now need 259
to be tested against in-depth modeling. 260
Essential to our interpretation is that forearc materials must deform beyond their 261
elastic limit in between large megathrust earthquakes at characteristic interseismic strain 262
rates of 10−17 to 10−15 s−1 (i.e. 0.1 to 10 nanostrain per year), and upper crustal
temper-263
atures and pressures below ∼ 400◦C and ∼ 200 MPa, respectively. Among possible
can-264
didate mechanisms, pressure solution processes enable viscous-like creep under low de-265
viatoric stress and temperature, particularly in shallow porous rock units (e.g., sedimen-266
tary layers) [Niemeijer et al., 2002]. Under greater deviatoric stresses, low-porosity rocks 267
are more likely to deform inelastically through brittle creep – the macroscopic manifesta-268
tion of grain-scale cracks that nucleate from pre-existing defects and grow sub-critically 269
through stress- and temperature-activated chemical processes [Paterson and Wong, 2005; 270
Brantut et al., 2013].
271
We illustrate the possible behavior of the forearc through the example of quartz, a 272
material typical of a continental crust, which can deform visco-plastically through dislo-273
cation glide at low temperature [Bhat et al., 2011]. Under a compressive load, such mate-274
rial behaves elastically at low strain regime and starts to deviate from elasticity at higher 275
strain and the style of deformation (i.e. elastic or inelastic) depends on the ambient strain 276
rate (Fig. 5). For strain rates on the order of those expected for the interseismic period 277
within the forearc (i.e. 10−17to 10−15s−1), quartz behaves elastically for stresses lower
278
than about 100 MPa, with inelastic strain increasing at higher stresses. Such a visco-plastic 279
material would allow for interseismic loading up to absolute stresses on the order of those 280
of a typical stress drop (i.e. less than 100MPa), while accumulating permanent strain. In 281
addition, because quartz tends to be elastic at high strain rates, we can assume the forearc 282
would behave elastically during the coseismic (and maybe immediate post-seismic) period. 283
Our interpretation focuses only on the behavior of the upper crust of the overrid-284
ing plate, and thus does not account for the viscous rheology of the upper mantle over 285
the earthquake cycle [Wang et al., 2012], which may affect surface strain rates and es-286
timates of coupling along the megathrust [Li et al., 2015]. Also, we do not account for 287
other potential transient deformation events. Post-seismic stress relaxation following large 288
earthquakes, for instance, occurs through aseismic slip [e.g. Hsu et al., 2006] and viscous 289
flow within the upper-mantle [e.g. Trubienko et al., 2013]. The influence of mantle relax-290
ation considering a crust that can deform inelastically has not been extensively modeled 291
yet. That said, we believe that accounting for viscous processes in the mantle and afterslip 292
would not modify our conclusions based purely on the comparison of surface deformation. 293
First, given the geological time scales required to build topography, we can consider large 294
earthquakes and their corresponding afterslip as single slip events. Second, post-seismic 295
viscous flow within the upper-mantle following a large earthquake puts the forearc in com-296
pression for a period of time that depends on the characteristic time involved [Sun et al., 297
2014]. If that characteristic time is small with respect to large megathrust cycles, it should 298
be negligible. 299
Other examples worldwide do not necessarily compare simply with the behavior we 300
observe in northern Chile. For instance, in Japan, the coastline of Tohoku subsides both 301
during large earthquakes [e.g. Simons et al., 2011] and during the interseismic period [e.g. 302
Hu et al., 2016]. Only during the post-seismic period, a selection of GNSS-derived ground
303
velocities indicates uplift of the forearc. Although all phases of the earthquake cycle have 304
been recorded in this region, the summation of observed coseismic, modeled postseismic 305
and observed interseismic motion cannot explain the long-term uplift observed in the area. 306
Visco-elastic models of interseismic motion allow for a potential reversal of rates of ver-307
tical motion during the interseismic period [Trubienko et al., 2013; Hashima and Sato, 308
2017], which could reconcile long and short term observations in this part of Japan. In 309
northern Chile, the only available surface deformation measurements are during the inter-310
seismic period and for moderate sized earthquakes and their respective post-seismic se-311
quences. Considering the example of Tohoku, surface displacements related to the largest 312
possible event (and its postseismic displacements) along the megathrust completely over-313
ride signals from other smaller magnitude events. Therefore, a complete budget of vertical 314
displacements is impossible here and we can only hypothesize based on the observed cor-315
relation. Systematic mapping of short- and long-term vertical motion of subduction fore-316
arcs is therefore required to determine globally how much of plate convergence actually 317
ends up in permanent deformation of subduction forearcs worldwide in order to constrain 318
future geodynamical models attempting at bridging time scales, from seconds to millions 319 of years. 320 Acknowledgements 321
This project has received funding from NASA (grant NNX16AK58G). This project 322
has received funding from the European Research Council (ERC) under the European 323
Union’s Horizon 2020 research and innovation program (grant agreements 758210 and 324
805256). This work was granted access to the HPC resources of MesoPSL financed by 325
the Region Ile de France and the project Equip@Meso (reference ANR-10-EQPX-29-326
01) of the program Investissements d’Avenir supervised by the Agence Nationale pour la 327
Recherche. Envisat raw data have been obtained upon request via the EOLISA tool. We 328
thank the European Space Agency for the acquisition and the distribution of these data. 329
ERA-Interim products are directly available for download at ECMWF (https://www.ecmwf.int/). 330
The authors are grateful for enlightening discussions with J.-P. Avouac, N. Cubas, L. Dal 331
Zilio and N. Brantut. The authors thank the editor and both an anonymous reviewer and 332
R. Bürgmann for their constructive comments that helped crafting a better manuscript. 333
References
334
Allmendinger, R. W., and G. González (2010), Invited review paper: Neogene to Qua-335
ternary tectonics of the coastal Cordillera, northern Chile, Tectonophysics, 495(1-2), 336
93–110. 337
Baker, A., R. W. Allmendinger, L. A. Owen, and J. A. Rech (2013), Permanent deforma-338
tion caused by subduction earthquakes in northern Chile, Nature Geoscience, 6(5), 492– 339
496. 340
Bejar-Pizarro, M., D. Carrizo, A. Socquet, R. Armijo, S. Barrientos, F. Bondoux, S. Bon-341
valot, J. Campos, D. Comte, J. B. de Chabalier, O. Charade, A. Delorme, G. Gabalda, 342
J. Galetzka, J. Genrich, A. Nercessian, M. Olcay, F. Ortega, I. Ortega, D. Remy, J. C. 343
Ruegg, M. Simons, C. Valderas, and C. Vigny (2010), Asperities and barriers on the 344
seismogenic zone in North Chile: state-of-the-art after the 2007 Mw 7.7 Tocopilla 345
earthquake inferred by GPS and InSAR data, Geophysical Journal International, 183(1), 346
390–406. 347
Béjar-Pizarro, M., A. Socquet, R. Armijo, D. Carrizo, J. Genrich, and M. Simons (2013), 348
Andean structural control on interseismic coupling in the North Chile subduction zone, 349
Nature Geoscience, 6(5), 462–467.
350
Bhat, H. S., C. G. Sammis, and A. J. Rosakis (2011), The Micromechanics of Westerley 351
Granite at Large Compressive Loads, Pure appl. geophys., 168(12), 2181–2198. 352
Blewitt, G., C. Kreemer, W. C. Hammond, and J. Gazeaux (2016), MIDAS robust trend 353
estimator for accurate GPS station velocities without step detection, Journal of Geophys-354
ical Research-Solid Earth, 121(3), 2054–2068–15.
355
Brantut, N., M. J. Heap, P. G. Meredith, and P. Baud (2013), Time-dependent cracking 356
and brittle creep in crustal rocks: A review, Journal of Structural Geology, 52(C), 17– 357
43. 358
Comte, D., and M. Pardo (1991), Reappraisal of great historical earthquakes in the north-359
ern Chile and southern Peru seismic gaps, Nat Hazards, 4(1), 23–44. 360
Davis, D. M., J. Suppe, and F. A. Dahlen (1983), Mechanics of Fold-and-Thrust Belts and 361
Accretionary wedges, Journal of Geophysical Research, 88(B2), 1153–1172. 362
Dragert, H., K. Wang, and J. S. Thomas (2001), A Silent Slip Event on the Deeper Casca-363
dia Subduction Interface, Science, 292(5521), 1525–1528. 364
Duputel, Z., J. Jiang, R. Jolivet, M. Simons, L. Rivera, J. P. Ampuero, B. Riel, S. E. 365
Owen, A. W. Moore, S. V. Samsonov, F. Ortega Culaciati, and S. E. Minson (2015), 366
The Iquique earthquake sequence of April 2014: Bayesian modeling accounting for pre-367
diction uncertainty, Geophys. Res. Lett., 42(19), 7949–7957. 368
Ekström, G., M. Nettles, and A. M. Dziewonski (2012), The global CMT project 369
2004–2010: Centroid-moment tensors for 13,017 earthquakes, Physics of the Earth and 370
Planetary Interiors, 200–201(0), 1–9.
371
Farr, T. G., and M. Kobrick (2000), Shuttle radar topography mission produces a wealth of 372
data, Eos Trans. AGU, 81(48), 583–585. 373
Grandin, R., E. Klein, M. Metois, and C. Vigny (2016), Three-dimensional displace-374
ment field of the 2015 Mw8.3 Illapel earthquake (Chile) from across- and along-track 375
Sentinel-1 TOPS interferometry, Geophys. Res. Lett., 43(6), 2552–2561. 376
Hashima, A., and T. Sato (2017), A megathrust earthquake cycle model for Northeast 377
Japan: bridging the mismatch between geological uplift and geodetic subsidence, Earth 378
Planets Space, 69(1), 1–10.
379
Hirose, H., K. Hirahara, F. Kimata, N. Fujii, and S. Miyazaki (1999), A slow thrust slip 380
event following the two 1996 Hyuganada Earthquakes beneath the Bungo Channel, 381
southwest Japan, Geophys. Res. Lett., 26(21), 3237–3240. 382
Hsu, Y.-J., M. Simons, J. P. Avouac, J. Galetzka, K. Sieh, M. Chlieh, D. Natawidjaja, 383
L. Prawirodirdjo, and Y. Bock (2006), Frictional Afterslip Following the 2005 Nias-384
Simeulue Earthquake, Sumatra: Supplementary material, Science, 312(5782), 1921– 385
1925. 386
Hu, Y., R. Bürgmann, N. Uchida, P. Banerjee, and J. T. Freymueller (2016), Stress-driven 387
relaxation of heterogeneous upper mantle and time-dependent afterslip following the 388
2011 Tohoku earthquake, J Geophys Res-Sol Ea, 121(1), 385–411. 389
Jolivet, R., and M. Simons (2018), A Multipixel Time Series Analysis Method Accounting 390
for Ground Motion, Atmospheric Noise, and Orbital Errors, Geophys. Res. Lett., 45(4), 391
1814–1824. 392
Jolivet, R., M. Simons, P. S. Agram, Z. Duputel, and Z. K. Shen (2015), Aseismic slip 393
and seismogenic coupling along the central San Andreas Fault, Geophys. Res. Lett., 394
42(2), 297–306.
395
Konca, A. O., J.-P. Avouac, A. Sladen, A. J. Meltzner, K. Sieh, P. Fang, Z. Li, J. Galet-396
zka, J. Genrich, M. Chlieh, D. H. Natawidjaja, Y. Bock, E. J. Fielding, C. Ji, and D. V. 397
Helmberger (2008), Partial rupture of a locked patch of the Sumatra megathrust during 398
the 2007 earthquake sequence, Nature, 456(7222), 631–635. 399
Li, S., M. Moreno, J. Bedford, M. Rosenau, and O. Oncken (2015), Revisiting viscoelastic 400
effects on interseismic deformation and locking degree: A case study of the Peru-North 401
Chile subduction zone, J Geophys Res-Sol Ea, 120(6), 4522–4538. 402
Lin, Y. N., R. Jolivet, M. Simons, P. S. Agram, H. R. Martens, Z. Li, and S. H. Lodi 403
(2015), High interseismic coupling in the Eastern Makran (Pakistan) subduction zone, 404
Earth and Planetary Science Letters, 420(C), 116–126.
405
Matsu’ura, T. (2015), Late Quaternary uplift rate inferred from marine terraces, Muroto 406
Peninsula, southwest Japan: Forearc deformation in an oblique subduction zone, Geo-407
morphology, 234(C), 133–150.
408
Mazzotti, S., X. Le Pichon, P. Henry, and S.-I. Miyazaki (2000), Full interseismic locking 409
of the Nankai and Japan-west Kurile subduction zones: An analysis of uniform elastic 410
strain accumulation in Japan constrained by permanent GPS, J. Geophys. Res., 105(B6), 411
13,159–13,177. 412
Melnick, D. (2016), Rise of the central Andean coast by earthquakes straddling the Moho, 413
Nature Geosci, 9(5), 401–407.
414
Metois, M., A. Socquet, C. Vigny, D. Carrizo, S. Peyrat, A. Delorme, E. Maureira, M. C. 415
Valderas-Bermejo, and I. Ortega (2013), Revisiting the North Chile seismic gap seg-416
mentation using GPS-derived interseismic coupling, Geophysical Journal International, 417
194(3), 1283–1294.
418
Metois, M., C. Vigny, and A. Socquet (2016), Interseismic Coupling, Megathrust Earth-419
quakes and Seismic Swarms Along the Chilean Subduction Zone (38°–18°S), Pure appl. 420
geophys., pp. 1–19.
421
Mouslopoulou, V., O. Oncken, S. Hainzl, and A. Nicol (2016), Uplift rate transients at 422
subduction margins due to earthquake clustering, Tectonics, 35(10), 2370–2384. 423
Niemeijer, A. R., C. J. Spiers, and B. Bos (2002), Compaction creep of quartz sand at 424
400–600°C: experimental evidence for dissolution-controlled pressure solution, Earth 425
and Planetary Science Letters, 195(3-4), 261–275.
426
Nocquet, J. M., J. C. Villegas-Lanza, M. Chlieh, P. A. Mothes, F. Rolandone, P. Jar-427
rin, D. Cisneros, A. Alvarado, L. Audin, F. Bondoux, X. Martin, Y. Font, M. Régnier, 428
M. Vallée, T. Tran, C. Beauval, J. M. Maguiña Mendoza, W. Martinez, H. Tavera, and 429
H. Yepes (2014), Motion of continental slivers and creeping subduction in the northern 430
Andes, Nature Geoscience, 7(4), 287–291. 431
Paterson, M. S., and T.-f. Wong (2005), Experimental Rock Deformation — The Brittle 432
Field, Springer-Verlag, Berlin/Heidelberg.
433
Pritchard, M., M. Simons, P. A. Rosen, S. Hensley, and F. H. Webb (2002), Co-seismic 434
slip from the 1995 July 30 Mw=8.1 Antofagasta, Chile, earthquake as constrained by 435
InSAR and GPS observations, Geophysical Journal International, 150, 362–376. 436
Pritchard, M. E., and M. Simons (2002), A satellite geodetic survey of large-scale defor-437
mation of volcanic centres in the central Andes, Nature, 418(6894), 167–171. 438
Ramírez-Herrera, M. T., K. Gaidzik, S. Forman, V. Kostoglodov, R. Bürgmann, and C. W. 439
Johnson (2018), Relating the long-term and short-term vertical deformation across a 440
transect of the forearc in the central Mexican subduction zone, Geosphere, 14(2), 419– 441
439. 442
Regard, V., M. Saillard, J. Martinod, L. Audin, S. Carretier, K. Pedoja, R. Riquelme, 443
P. Paredes, and G. Hérail (2010), Renewed uplift of the Central Andes Forearc revealed 444
by coastal evolution during the Quaternary, Earth and Planetary Science Letters, 297(1-445
2), 199–210. 446
Rousset, B., C. Lasserre, N. Cubas, S. Graham, M. Radiguet, C. DeMets, A. Socquet, 447
M. Campillo, V. Kostoglodov, E. Cabral-Cano, N. Cotte, and A. Walpersdorf (2015), 448
Lateral Variations of Interplate Coupling along the Mexican Subduction Interface: Re-449
lationships with Long-Term Morphology and Fault Zone Mechanical Properties, Pure 450
appl. geophys., 173(10), 3467–3486.
451
Saillard, M., S. R. Hall, L. Audin, D. L. Farber, G. Hérail, J. Martinod, V. Regard, R. C. 452
Finkel, and F. Bondoux (2009), Non-steady long-term uplift rates and Pleistocene ma-453
rine terrace development along the Andean margin of Chile (31°S) inferred from 10Be 454
dating, Earth and Planetary Science Letters, 277(1-2), 50–63. 455
Saillard, M., L. Audin, B. Rousset, J. P. Avouac, M. Chlieh, S. R. Hall, L. Husson, and 456
D. L. Farber (2017), From the seismic cycle to long-term deformation: linking seismic 457
coupling and Quaternary coastal geomorphology along the Andean megathrust, Tecton-458
ics, 36(2), 241–256.
459
Savage, J. C. (1983), A Dislocation Model of Strain Accumulation and Release at a Sub-460
duction Zone, Journal of Geophysical Research, 88(B6), 4984–4996. 461
Schurr, B., G. Asch, M. Rosenau, R. Wang, O. Oncken, S. Barrientos, P. Salazar, and J. P. 462
Vilotte (2012), The 2007 M7.7 Tocopilla northern Chile earthquake sequence: Impli-463
cations for along-strike and downdip rupture segmentation and megathrust frictional 464
behavior, Journal of Geophysical Research, 117(B5), B05,305. 465
Schurr, B., G. Asch, S. Hainzl, J. Bedford, A. Hoechner, M. Palo, R. Wang, M. Moreno, 466
M. Bartsch, Y. Zhang, O. Oncken, F. Tilmann, T. Dahm, P. Victor, S. Barrientos, and 467
J.-P. Vilotte (2014), Gradual unlocking of plate boundary controlled initiation of the 468
2014 Iquique earthquake, Nature, 512(7514), 1–13. 469
Simons, M., J. Galetzka, J. F. Genrich, F. Ortega Culaciati, D. Comte, B. Glass, G. Gon-470
zales, and E. Norabuena (2010), Central Andean Tectonic Observatory Geodetic Array, 471
UNAVCO Inc. 472
Simons, M., S. E. Minson, A. Sladen, F. Ortega, J. Jiang, S. E. Owen, L. Meng, J. P. Am-473
puero, S. Wei, R. Chu, D. V. Helmberger, H. Kanamori, E. Hetland, A. W. Moore, and 474
F. H. Webb (2011), The 2011 Magnitude 9.0 Tohoku-Oki Earthquake: Mosaicking the 475
Megathrust from Seconds to Centuries, Science, 332(6036), 1421–1425. 476
Song, T.-R. A., and M. Simons (2003), Large trench-parallel gravity variations predict 477
seismogenic behavior in subduction zones, Science, 301(5633), 630–633. 478
Sun, T., K. Wang, T. Iinuma, R. Hino, J. He, H. Fujimoto, M. Kido, Y. Osada, S. Miura, 479
Y. Ohta, and Y. Hu (2014), Prevalence of viscoelastic relaxation after the 2011 Tohoku-480
oki earthquake, Nature, 514(7520), 1–13. 481
Trubienko, O., L. Fleitout, J.-D. Garaud, and C. Vigny (2013), Interpretation of interseis-482
mic deformations and the seismic cycle associated with large subduction earthquakes, 483
Tectonophysics, 589, 126–141.
484
Victor, P., M. Sobiesiak, J. Glodny, S. N. Nielsen, and O. Oncken (2011), Long-term 485
persistence of subduction earthquake segment boundaries: Evidence from Mejillones 486
Peninsula, northern Chile, J Geophys Res-Sol Ea, 116(B2), B02,402. 487
Vigny, C., A. Socquet, S. Peyrat, J. C. Ruegg, M. Metois, R. Madariaga, S. Morvan, 488
M. Lancieri, R. Lacassin, J. Campos, D. Carrizo, M. Bejar-Pizarro, S. Barrientos, 489
R. Armijo, C. Aranda, M. C. Valderas-Bermejo, I. Ortega, F. Bondoux, S. Baize, 490
H. Lyon-Caen, A. Pavez, J. P. Vilotte, M. Bevis, B. Brooks, R. Smalley, H. Parra, 491
J. C. Baez, M. Blanco, S. Cimbaro, and E. Kendrick (2011), The 2010 Mw 8.8 Maule 492
Megathrust Earthquake of Central Chile, Monitored by GPS, Science, 332(6036), 1417– 493
1421. 494
Wang, K., Y. Hu, and J. He (2012), Deformation cycles of subduction earthquakes in a 495
viscoelastic Earth, Nature, 484(7394), 327–332. 496
Wells, R. E., R. J. Blakely, Y. Sugiyama, D. W. Scholl, and P. A. Dinterman (2003), 497
Basin-centered asperities in great subduction zone earthquakes: A link between slip, 498
subsidence, and subduction erosion?, Journal of Geophysical Research, 108(B10), 119– 499
30. 500
Coupling co
eff. = 1
Coupli
ng coeff
. = 0
? ? ?
6.7 cm/yr
Hinge
Line
???
Interseismic vertical
displacement rates
Uplift
Subsidence
Coastal Domain
FOREARC
SUBDUCTING P
LATE
OCEAN
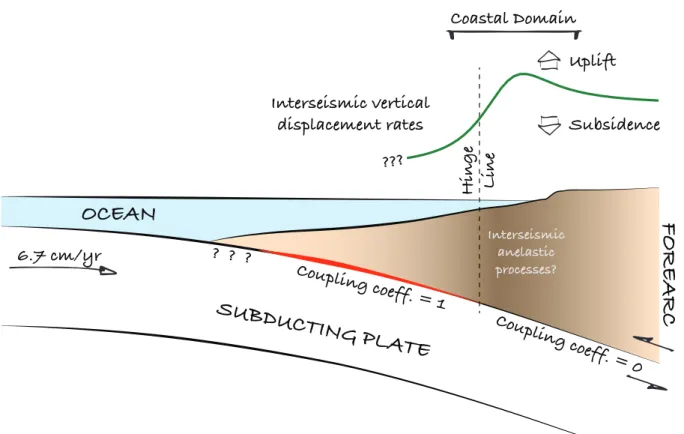
Interseismic anelastic processes?Figure 1. Simplified seismotectonic setting of the subduction forearc– An oceanic plate slides
under-neath the subduction forearc. The interface is divided between a locked section and a creeping, unlocked section. The coupling coefficient is the parameter describing the apparent slip deficit normalized by the long-term plate convergence rate. A coupling coefficient of 0 indicates slip at plate rate along the interface while a coupling coefficient of 1 indicates full kinematic locking. The coastal domain is the region proximal to the coastline that is submitted to changes in sea level. During the interseismic period, uplift is maximum at the hinge line, which corresponds to the surface projection of the transition between the locked and unlocked sections of the interface at depth.
501 502 503 504 505 506 507 508
24˚S 24˚S 23˚S 23˚S 22˚S 22˚S 21˚S 21˚S 20˚S 68˚W 73˚W 72˚W 71˚W 70˚W 69˚W 68˚W 71˚W 70˚W 69˚W 19˚S Mw 8.1 1995 Mw 7.7 2014 Mw 8.1 2014 Mw 7.8 2005 6.7 cm/yr 18 6 8 /1 8 7 7 S e ism ic G a p Antofagasta Iquique Pisagua Tocopilla Mejillones Peninsula −10 −5 0 5 10 mm/yr LOS velocity 100 km 1 cm/yr LOS 19˚S
Figure 2. Tectonic setting and data set – Maps of the northern Chilean subduction zone. Arrows on the
top map are GNSS-derived velocities from Metois et al. [2016] for the interseismic period preceeding the 2014 earthquake. Color indicates ground velocity in the direction of the satellite line-of-sight for Envisat acquisitions along track 96 [Jolivet and Simons, 2018]. Dark red contour lines are 2 m slip contours for earth-quakes of magnitude larger than 8, including the Antofagasta, Mw 8.1, 1995 event [Pritchard et al., 2002] and the Iquique, Mw 8.1, 2014 event [Duputel et al., 2015]. Orange contour lines are 0.5 m slip contours for earthquakes of magnitude between 7 and 8, including the 2007, Mw 7.7, Tocopilla event [Béjar-Pizarro
et al., 2013] and the 2014, Mw 7.7, Iquique’s biggest aftershock [Duputel et al., 2015]. Focal mechanisms for
earthquakes larger than magnitude 7.5 since 1995 are from the Global CMT project [Ekström et al., 2012]. Topography is from SRTM [Farr and Kobrick, 2000].
509 510 511 512 513 514 515 516 517 518
73˚W 72˚W 71˚W 71˚W 70˚W 70˚W 69˚W 69˚W 68˚W 68˚W 24˚S 24˚S 23˚S 23˚S 22˚S 22˚S 21˚S 21˚S 20˚S 73˚W 72˚W 20˚S 19°S Mw 8.1 1995 Mw 7.7 2014 Mw 8.1 2014 Mw 7.8 2005 Antofagasta Iquique Pisagua Tocopilla 6.7 cm/yr 1 8 6 8 /18 77 S e is m ic G a p 0.0 0.5 1.0 Geodetic Coupling 100 km 0.0 0.1 0.2
Holocene uplift (mm/yr)
Figure 3. Megathrust coupling and slip distributions – Mean of the posterior PDF of the coupling
coeffi-cient along the megathrust. Color indicates wether the fault is kinematically coupled (red) or creeping at the plate rate (blue). Colored circles are the inferred quaternary uplift rates from Melnick [2016]. Earthquake slip distributions and moment tensors are similar as in Figure 2
519
520
521
71˚W 70˚W 69˚W 23˚S 22˚S 21˚S 20˚S 19˚S + + + TOCOPILLA AREA SALAR GRANDE AREA NORTH PISAGUA AREA −1.0 0.0 1.0 2.0 3.0 4.0
Interseismic uplift rate (mm/yr)
REGIONALUPLIFT ?
Interseismic uplift (mm/yr)
0.0 0.1 0.2
Quaternary uplift (mm/yr)
−4 −2 0 2 4 0.00 0.05 0.10 0.15 0.20 0.25 Q ua te rna ry upl ift ra te (m m /yr) 0.0 0.5 1.0 Coupling 0.00 0.05 0.10 0.15 0.20
Figure 4. Comparison between short term interseismic fault behavior and quaternary coastal uplift – Map
shows quaternary coastal uplift rate [Melnick, 2016] (colored circles) and interseismic uplift rates predicted from our model (background color). (Top right) Quaternary coastal uplift as a function of coupling coefficient offshore, 50 km from the coast in a direction parallel to relative plate motion. (Bottom right) Quaternary coastal uplift as a function of interseismic uplift with our interpretation of the relationship between interseis-mic and quaternary uplift. Colored dots indicate locations where quaternary active faulting has been identified [please refer to the map for the location of these colored points; Allmendinger and González, 2010]. Thick blue and black lines are the linear trends predicted from the Bayesian regression for the region where quater-nary active faulting has been identified and not identified, respectively. Thin lines show a hundred realizations of the posterior PDF derived by the Bayesian regression, reflecting the range of possible trends for each group of points. See supplementary materials for a similar plot without interpretation, for a figure highlighting the position of the various points on a map and for a description of the regression applied.
523 524 525 526 527 528 529 530 531 532 533 534
400 300 200 100 0 0 5x10⁻³ 1x10⁻²
Strain
S
tre
ss
(M
P
a
)
CONFININGPRESSURE: 70 MPa
TEMPERATURE: 413K 1e-14 s-1 1e-15 s-1 1e-16 s-1 1e-17 s-1
S
tre
ss
Strain
INT ER SE ISM ICINCREASING FINITE STRAIN
CO SEIS MIC + A FTER SLI P
Figure 5. Schematic model for the accumulation of permanent strain throughout the earthquake cycle –
(Left) Stress-strain relationship for the visco-plastic low temperature deformation of quartz at 70 MPa and 413 K, conditions corresponding to a depth of about 7 km. As the visco-plastic response of quartz is strain rate dependent, we show the corresponding behavior for 4 strain rates corresponding to a range of interseismic strain rates. (Right) Schematic behavior of a visco-plastic material to the cycles of loading and unloading imposed by the succesion of interseismic and coseismic phases on the megathrust. During the interseismic phase, stress increases in the forearc, at a strain rate imposed by the slip rate on the megathrust, hence the variable irrecoverable strain that builds up lateraly. During the coseismic phase, stress drops to a lower level, leaving persistent strain within the forearc.
535 536 537 538 539 540 541 542 543


![Figure 4. Comparison between short term interseismic fault behavior and quaternary coastal uplift – Map shows quaternary coastal uplift rate [ Melnick , 2016] (colored circles) and interseismic uplift rates predicted from our model (background color)](https://thumb-eu.123doks.com/thumbv2/123doknet/13735882.436775/23.892.147.784.279.676/comparison-interseismic-behavior-quaternary-quaternary-interseismic-predicted-background.webp)

