HAL Id: hal-03164868
https://hal.archives-ouvertes.fr/hal-03164868
Submitted on 18 Mar 2021HAL is a multi-disciplinary open access
archive for the deposit and dissemination of sci-entific research documents, whether they are pub-lished or not. The documents may come from teaching and research institutions in France or abroad, or from public or private research centers.
L’archive ouverte pluridisciplinaire HAL, est destinée au dépôt et à la diffusion de documents scientifiques de niveau recherche, publiés ou non, émanant des établissements d’enseignement et de recherche français ou étrangers, des laboratoires publics ou privés.
Distributed under a Creative Commons Attribution - NonCommercial - NoDerivatives| 4.0 International License
Detection and quantification of low submarine
groundwater discharge flows by radionuclides to support
conceptual hydrogeological model of porous aquifers
S. Santoni, E. Garel, A. Mayer, Olivier Radakovitch, Y. Travi, F. Huneau
To cite this version:
S. Santoni, E. Garel, A. Mayer, Olivier Radakovitch, Y. Travi, et al.. Detection and quantifi-cation of low submarine groundwater discharge flows by radionuclides to support conceptual hy-drogeological model of porous aquifers. Journal of Hydrology, Elsevier, 2020, 583, pp.124606. �10.1016/j.jhydrol.2020.124606�. �hal-03164868�
1 Detection and quantification of low submarine groundwater discharge flows by
1
radionuclides to support conceptual hydrogeological model of porous aquifers
2 3
S. Santoni1,2,*, E. Garel1,2 , A. Mayer 3
, O. Radakovitch4,5, Y. Travi3, F. Huneau1,2
4 5
1
Université de Corse Pascal Paoli, Faculté des Sciences et Techniques, Département
6
d'Hydrogéologie, Campus Grimaldi, BP 52, F-20250 Corte, France.
7
2
CNRS, UMR 6134, SPE, F-20250 Corte, France.
8
3
Avignon Université, UMR 1114 EMMAH, UAPV, 301 rue Baruch de Spinoza, BP 21239, F-84916
9
Avignon, France.
10
4
Aix-Marseille Univ, CNRS, IRD, INRA, Coll France, CEREGE, 13545 Aix-en-Provence, France.
11
5
Institut de Radioprotection et de Sureté Nucléaire (IRSN), PSE-ENV/SRTE/LRTA, BP 3, 13115
Saint-12
Paul-Les-Durance, France.
13 14
(*)
Corresponding author: Sébastien Santoni, Département d'Hydrogéologie, UMR CNRS SPE 6134
15
Université de Corse Pascal Paoli, Campus Grimaldi, F-20250 Corte, France. Contact:
16 santoni_s@univ-corse.fr or santonisebastien17@gmail.com 17 18 Highlights 19
• Low and diffuse submarine groundwater discharge flows are investigated. 20
• Groundwater flow velocity from 222Rn and from Darcy law are in agreement. 21
• Discharge rates are in agreement with recharge rates solving aquifer water 22 balance. 23 24 Abstract 25
Submarine groundwater discharge (SGD) is considered as a good indicator of the natural 26
behavior of coastal aquifers especially in the case of intense groundwater withdrawal or 27
when the aquifer recharge conditions are limited. Indeed, a decrease in SGD flows would 28
result in saline intrusion compromising the groundwater reservoir use. The need for SGD 29
studies in Mediterranean and semi-arid environments have long been recognized and little is 30
known on low and diffuse flows. For this reason, the detection and quantification of low and 31
diffuse SGD flows have been attempted in a Mediterranean porous aquifer with low potential 32
of recharge and high touristic pressure from using a multi-tracing approach combining aerial 33
thermal infrared images (TIR), temperature (T), electric conductivity (E.C.), major ions, 34
selected trace elements, 2H, 18O, 222Rn, 223Ra and 224Ra. The TIR images allowed the 35
detection of slight temperature variations at the seawater surface. Contrasted lithology and 36
strong water-rock interactions due to groundwater residence time of many decades favor the 37
222Rn, 223Ra and 224Ra contents in groundwater that reach the seashores. Low temperature
38
and E.C, as well as high radon and radium activities, evidenced SGD flows in agreement 39
with the known flow conditions within the aquifer. The quantification of SGD flows revealed in 40
2 very good agreement with the known recharge rates of the aquifer that validates its 41
conceptual hydrogeological model. For the first time in the Mediterranean or in semi-arid 42
context, a natural tracing experiment based on geochemistry and isotope hydrology tools 43
allowed the quantification of SGD flows to validate the hydrogeological conceptual model and 44
to solve the water balance at the whole aquifer scale. Such a methodology could be applied 45
worldwide to other similar coastal aquifers with low and diffuse SGD flow conditions. 46
47
Keywords
48
Diffused SGD flows, Low Recharge, TIR imagery, Radon, Radium, Aquifer Water Balance. 49
50
1. Introduction
51
To ensure sustainable management of groundwater resources, it is necessary to rely 52
on detailed conceptual hydrogeological models. This includes the quantification of all 53
water balance terms at the aquifer scale. For coastal aquifers, an important water 54
balance term is the submarine groundwater discharge (SGD) (Burnett et al., 2006; 55
Baudron et al., 2015). The aquifer recharge areas contributing to SGD flows being 56
frequently densely populated, SGD flows are then recognized to be a source of 57
nutrients, contaminants and pollutants that may affect the coastal hydrosystems 58
functioning (Kaleris, 2006; Tomasky-Holmes et al., 2013; Rodellas et al., 2015). 59
Furthermore, the amount of fresh SGD flows can reduce or even disappear due to 60
over-pumping, causing seawater intrusion into coastal aquifers compromising the 61
groundwater reservoir use (Moujabber et al., 2006; Mahlknecht et al., 2017; Nlend et 62
al., 2018).
63
The issue of seawater intrusion is obviously stronger for coastal aquifers displaying 64
large interface with the sea that can be worsened by pumping rates (McCoy and 65
Corbett, 2009; Mahlknecht et al., 2017) and/or by increasing climate change effects 66
such as seawater rise (Sherif and Singh, 1999; Barlow and Reichard, 2009; Werner 67
et al., 2013) or modifications in aquifer recharge conditions governing groundwater
3
levels (Holding et al., 2016; Meixner et al., 2016; Santoni et al., 2018). Bokuniewicz 69
et al. (2003) propose a typology for coastal groundwater and provides order of 70
magnitude for SGD flows rates in porous media from various location and climate 71
conditions highlighting very low values around 1 – 2 litter/day/linear meter in arid 72
regions. Such coastal aquifers displaying low SGD flows are then more vulnerable to 73
saline intrusion due to the precarious balance between freshwater and seawater of 74
the salt wedge. Dependant of climate change, coastal drainage geometry and 75
groundwater withdrawal for coastal population, irrigation, and industrial activities, the 76
presence of SGD flows is consequently considered as a good indicator of the natural 77
behavior of aquifers (Sawyer et al., 2017). 78
Coastal aquifers of the Mediterranean area are known to be particularly vulnerable 79
facing climate and anthropogenic pressures, so much so saline intrusions are already 80
common (Richts et al., 2011; Pachauri et al., 2014). Destouni and Prieto (2003) 81
made a numerical modelling of whole-aquifer water balance terms including SGD 82
flows in a selection of porous aquifers in Israel, Greece and Cyprus for several 83
management conditions. Later, Mazi et al. (2014, 2016) used an analytical approach 84
to optimize groundwater exploitation conditions in a selection of porous aquifers 85
located in the Nile Delta, Israel, and Cyprus based on water balance components 86
quantification at the whole aquifer scale too. They also define the concept of 87
sustainable management space to prevent any major seawater intrusion. 88
In addition to numerical modelling and analytical solutions, experimental 89
methodologies have been developed to study SGD flows. TIR Imagery be used to 90
localize them, based on the detection of warm or cold groundwater inputs into the 91
sea with a contrasted temperature (Rapaglia et al., 2015; Tamborski et al., 2015). 92
This technique has been employed worldwide and may be combined with in situ 93
4
measurements of T, E.C. and/or geochemical tracers including natural radioactive 94
isotopes, particularly radon and radium isotopes (Mulligan and Charette, 2009; 95
Mejías et al., 2012; Povinec et al., 2012; Lee, 2014; Rapaglia et al., 2015; Tamborski 96
et al., 2015). These radionuclides are produced in the aquifer or poral waters of the
97
sediment by the decay chain of uranium and thorium within the aquifer rocks and 98
sediments, and are released in coastal waters by advection or diffusion, making them 99
useful tracers of SGD flows (Moore, 2000; Burnett et al., 2006; Beck et al., 2010). 100
Radium isotopes are indeed relevant tools thanks to their wide range of half-lives 101
(from 3.63 days for 224Ra to 1600 years for 226Ra). They can also be used to describe 102
SGD processes in discriminating freshwater inputs from rivers or aquifers with those 103
of recirculated seawater (Moore, 1996; Povinec et al., 2006; Stieglitz et al., 2010; 104
Bejannin et al., 2017). In the current literature, SGD flows are widely investigated 105
through experimental methodologies in mainly large diffuse or channelized flows 106
provided by karst, fractured or porous aquifers (Burnett et al., 2003; Burnett et al., 107
2006; Lamontagne et al., 2008; Povinec et al., 2008; Mejías et al., 2012; Santos et 108
al., 2012; Post et al., 2013; Montiel et al., 2018). However, to our knowledge,
109
experimental methodologies have never been used to quantify diffuse SGD flows 110
necessary to solve the water balance at the whole aquifer scale in Mediterranean 111
and semi-arid areas. 112
An experimental multi-tracing approach combining TIR imagery, T, E.C., major ions, 113
selected trace elements, 2H, 18O, 222Rn, 223Ra and 224Ra was attempted on the well 114
documented Mediterranean coastal aquifer of Bonifacio (Corsica Island, France). 115
Even if no major seawater intrusion is yet detected, the Bonifacio aquifer is highly 116
vulnerable facing seawater intrusion because more than a half of its boundaries 117
conditions are the Mediterranean Sea (Santoni, 2016). In addition, the equilibrium 118
5
between groundwater and seawater is fragile since SGD flows are expected to be 119
low due to limited recharge conditions typical of the Mediterranean area (Stigter et 120
al., 2012; Ghiglieri et al., 2014). Previous studies already demonstrated its low
121
potential of recharge (Chesnaux et al., 2018; Santoni et al., 2018) and highlighted its 122
porous matrix composition (Orsini et al., 2010; Reynaud et al., 2012). As a 123
consequence, the Bonifacio coastal aquifer is an ideal study site to evaluate the 124
potential of TIR, geochemical and isotope tools to detect and quantify low and diffuse 125
SGD flow conditions. For this aquifer, recharge and groundwater withdrawal rates 126
being already known, the SGD flows quantification is intended to validate its 127
conceptual hydrogeological model as well as to solve the water balance at the whole 128 aquifer scale. 129 130 2. Study site 131
The Bonifacio aquifer (Corsica Island, France) is part of a coastal plateau located in 132
the western Mediterranean (Figure 1). The study site is under a typical 133
Mediterranean climate with mean annual precipitation and temperature about 605 134
mm and 16.8 °C respectively (calculated from 01/2000 to 01/2012 at the Bonifacio 135
Meteo France station). The sector of Bonifacio is known for its wind blowing up to 136
300 days per year, often with gusts above 60–80 km/h especially in the extreme 137
south of the plateau. 138
The Bonifacio plateau is constrained in equal proportions by the Mediterranean Sea 139
at the South and Northeast and by granites on East and West. Its shape is triangular 140
and it extends over only 25 km² with a mean elevation of 80 m asl. It is made of 141
Miocene sediments filling a fractured Hercynian granitic depression up to 270 m deep 142
continuing in the surface at an altitude of 243 m at the Monte Corbu (west) and of 143
6
113 m at the Punta di San Mulari (Rossi and Cocherie, 1991; Orsini et al., 2010). The 144
3,000 inhabitants of the Bonifacio city reside mainly along the St. Julien and the St. 145
Jean valleys and also around the harbour. All the Bonifacio municipality coastlines 146
constitute a Natural marine reserve of National importance. Many campgrounds and 147
villas spread all over the plateau are crowded during the summer due to tourism 148
activities equivalent to 1.8 million people each year. 149
The hydrogeology of the Bonifacio plateau consists of two aquifer levels separated 150
by an aquitard (Santoni, 2016). The two aquifers levels are mainly found in the 151
Bonifacio and Balistra geologic formations (Reynaud et al., 2012), forming an upper 152
and a lower aquifer level, respectively. They are separated by an aquitard 153
corresponding to a silty layer of the Cala di Labra geologic formation. Both aquifer 154
levels are composed of sandy calcarenites and calcareous sandstones representing 155
a very compacted material with a cemented granular structure whose effective 156
porosity is on average 7% (Dörfliger et al., 2002; Chesnaux et al., 2018). 157
Potentiometric levels and geochemical tracers highlighted a recharge area on the 158
plateau (autochthonous recharge) and another within the surrounding fractured 159
granitic massifs (allochthonous recharge) from which two main flow lines are 160
identified in direction of the Bonifacio Harbour and of the Sant’Amanza Bay (Figure 161
1). The Canali River is the only permanent river and it has very low flow. It takes its 162
source at the West within granitic massifs before flowing on the plateau and draining 163
the upper aquifer until the Sant'Amanza bay (Santoni, 2016). 164
The carbonate plateau of Bonifacio is in continuity with the large Miocene 165
sedimentary basin developing between Corsica and Sardinia islands. The 166
sedimentary deposits of the Bonifacio plateau are conditioned by the granitic 167
substratum and the thickness of the sediments is a function of the palaeo-168
7
morphology of this one. Since no karst morphology is observed and considering the 169
porous matrix of the aquifer, the SGD flows are expected to reach the sea very close 170
to the shorelines and according to the salt wedge position (Figure 1). 171
The groundwater residence time was estimated from dissolved anthropogenic gases 172
CFCs and SF6 concentrations in groundwater (Santoni et al., 2016b). Weighted ages
173
range from 0 to 50 years in the upper aquifer and from 35 to 60 years in the lower 174
aquifer implying a low dynamic of renewal and a long residence time amplifying 175
water-rock interactions. An approach using 87Sr/86Sr validated groundwater flow 176
pattern and residence time by computing water-rocks interaction kinetics and mixing 177
rates between the granites, the upper and the lower aquifer (Santoni et al., 2016a). 178
Recently, Chesnaux et al. (2018) and Santoni et al. (2018) highlighted favourable 179
aquifer recharge rates about respectively 23 and 26 % of annual rainfall that 180
suggests the presence of low but detectable SGD flows near the coastal shores. 181
182
3. Method
183
The investigation strategy consisted in three main steps: (i) the acquisition of 184
airborne TIR images of the coastlines on the 9th September 2011 to detect and 185
quantify SGD flows; (ii) the measurement of physicochemical parameters, short half-186
lives radionuclides (222Rn, 223Ra, 224Ra), major ions, trace elements and stable 187
isotopes of the water molecule in one stream and nine groundwater samples (Figure 188
1) on the 27th, 28th and 30th October 2012. A fixed measurement for 222Rn in position 189
A in the Harbour was also made; (iii) the measurement of temperature, E.C., 222Rn 190
223
Ra and 224Ra in seashores to validate and refine the SGD flows localisation and 191
also to try their quantification on the 8th, 9th, and 10th January 2014. The objective 192
of the groundwater and river sampling was to identify the main hydrochemical 193
8
features to ensure the presence of sufficient radon and radium activities in 194
groundwater to detect SGD flows later in the sea. 195
196
3.1.1. Thermal Infrared imagery
197
TIR images were acquired along the carbonated rocks shores on the 09th September 198
2011 using a FLIR thermal system B20HSV. This period was chosen to provide the 199
best thermal contrast between groundwater and seawater. The flight acquisition of 200
airborne TIR images was performed by the service-provider company “l’Avion 201
Jaune”. The flight was conducted at 2200 m altitude from 10:30 am to 11:00 am 202
without any cloud and during low wind (7.8 m/s, ESE direction at the Meteo France 203
weather Station of Bonifacio, Pertusato). The atmospheric temperature during the 204
flight was 24.2°C and no significant rain event was observed during the last 6 days. 205
The TIR camera wave-length range from 7.5 to 14 µm with 16384 grey levels set on 206
a temperature palette between -40 to +150°C with an accuracy of ± 1°C. At 2200 m 207
altitude, the pixel field of view is about 2.0 × 2.0 m. 208
209
3.1.2. Geochemistry and stable isotopes of the water molecule
210
E.C. and T were directly measured in the field using a WTW Cond 3310 (WTW 211
GmbH, Weilheim, Germany). Bicarbonates were also determined in the field with a 212
HACH digital titrator (HACH Company, Loveland, USA). Major ions samples were 213
filtrated through 0.45 mm nitrocellulose membranes in two 50 mL polyethylene 214
bottles before storage at 4°C. One bottle was acidified using ultrapure nitric acid for 215
cation analysis. A Dionex ICS 1100 chromatograph (Thermo Fischer Scientific, 216
Waltham, USA) was used to determine ionic concentrations at the EMMAH 217
9
laboratory of the University of Avignon, France. The analysis quality was validated for 218
ionic balance error of less than 5%. 219
Samples for trace elements were filtered through 0.20 µm nitrocellulose membranes 220
and acidified with ultrapure nitric acid in 50 mL polyethylene bottles before storage at 221
4°C. A Thermo Fisher Q-ICP MS X-series II was used to determine trace elements 222
concentrations at the AETE technical platform of the University of Montpellier, 223
France. Samples for the analysis of stable isotopes of the water molecule were 224
collected in 20 mL amber glass bottles with no head-space. A liquid–water stable 225
isotope analyzer DLT-100 (Los Gatos Research, San Jose, USA) was used in 226
accordance with the analytical scheme recommended by the International Atomic 227
Energy Agency (Penna et al., 2010) at the EMMAH laboratory of the University of 228
Avignon, France. The analysis quality was checked with standard deviation 229
conditions up to 0.1‰ for 18O and 1‰ for 2
H. 230
231
3.1.3. 222Rn, 223Ra and 224Ra activities measurements
232
The 222Rn activity was measured in groundwater and in seawater along the 233
coastlines and within the Bonifacio Harbour in six fixed positions by using a RAD7 234
radon monitor combined with a RADAQUA water exchanger (Durridge Co. Inc.). Prior 235
to the radon measurements, the wind was moderate (from 4.0 to 19.6 m/s, ESE 236
direction) from the 27th to the 30th October 2012 and low (from 3.8 to 5.0 m/s, SW 237
direction) from the 8th to the 10th January 2014. Each sampling campaign were 238
preceded by slight to moderate rain events (45 mm on the 23rd October 2012; 20 mm 239
on the 05th January 2014). Since seawater typically displays low activity, the 240
sensitivity of the system was increased using two RAD7 monitors connected with the 241
RAD-AQUA in closed loop (Mayer et al., 2016). The water was pumped with a 4.5 242
10
l/min flow rate for injection into the RADAQUA water exchanger. The 222Rn activity 243
measure is determined from the decay of daughter isotope 218Po when the 244
equilibrium in the air-loop between the gas-exchanger and the two RAD7 monitors is 245
reached (Dimova et al., 2009).The 222Rn activity of water is then calculated from that 246
of air knowing the partition Ostwald coefficient, which depends on salinity and 247
temperature (Schubert et al., 2011). For the coastlines survey, all devices were 248
installed on a semi-rigid vessel equipped with GPS, E.C. and T data loggers. The 249
system allowed continuous measurements during navigation or fixed position. For 250
more detailed information, sampling and analytical process are consistent with those 251
outlined in (Mayer et al., 2016). 252
The 223Ra and 224Ra activities were measured using Mn-fibers by filtration of surface 253
water, groundwater, and seawater samples. Sample positions for the Bonifacio 254
Harbour are the same as for 222Rn. The fibers were analysed using RaDeCC 255
counters systems at the EMMAH and CEREGE laboratories (Moore and Arnold, 256
1996). Calibration was made by using in-house mono-isotope standards of 227Ac and 257
232
Th (parents of 223Ra and 224Ra respectively) and multi-isotope standards, 258
containing 227Ac, 232Th, and 226Ra. All standards were prepared according to the 259
technique of Scholten et al. (2010). Efficiencies changes with time are within the error 260
range and thus not significant. Errors were calculated according to Garcia-Solsona et 261
al. (2008).
262
To assess whether the diffusive release of radionuclides from sediments could be a 263
significant radon source, five sediment samples were collected from the sea beaches 264
of Paraguanu, Pertusatu, San Mulari, Sant’Amanza and Canettu (Figure 1). To 265
estimate 222Rn diffusion from sediment, activities in pore water were analysed 266
following the equilibration method after Corbett et al. etc (Corbett et al., 1998; Burnett 267
11
et al., 2007; Kluge et al., 2012). Experiments were performed with 500 g of dry
268
sediment equilibrated in closed glass bottles with 900 mL of Ra-free seawater, 269
previously filtrated through Mn-fiber. Seawater and sediment equilibrated in closed 270
bottles over one month, according to the protocol of Corbett et al 1998. 271
272
4. Results and discussion
273
4.1. SGD flows detection from airborne TIR images
274
The seawater surface temperature obtained in September 2011 through the TIR 275
image varies from 19.7 to 23.5°C along the coast (Figure 2). In the Harbour, red 276
hotspots correspond to pontoons and moored boats. The most common value range 277
between 21.2°C and 23.5°C due to summer conditions, but the temperature may be 278
less than 21.2°C locally. This is especially the case in the Sant’Amanza Bay and in 279
the Bonifacio Harbour where a discreet but detectable decrease in temperature is 280
observed. This low thermal contrast is obviously the result of a high thermal diffusion 281
of groundwater in the sea. No plumes are visible unlike on other SGD flows studies 282
(Tamborski et al., 2015; Bejannin et al., 2017), but this weak and progressive 283
decrease in temperature is a first clue arguing in favour of low and diffuse SGD flows 284
as expected for this Mediterranean porous aquifer. The slight decrease in 285
temperature is detectable over a length of around 350 m in the Sant’Amanaza bay 286
and 140 m in the Bonifacio Harbour. Furthermore, cooler temperatures less than 287
21.2°C are also observed at the extreme south of the plateau. This is probably due to 288
the wind occurring in this specific area during the flight (7.8 m/s, ESE direction 289
measured at the Pertusato Meteo France weather station). 290
291 292
12 4.2. Groundwater-rock interactions as a source of radionuclides in SGD
293
flows
294
Groundwater from the upper aquifer (Bonifacio geologic formation) and stream water 295
were investigated to characterize their hydrochemical and isotopic signatures and to 296
identify mineralization processes that may further help the SGD flows detection 297
(Table 1). Groundwater temperatures are close to the average annual atmospheric 298
temperature at Bonifacio (+16.8°C) involving a low dynamic of renewal that favour 299
water-rocks interactions within the aquifer (Santoni et al., 2016b). The EC is rather 300
high for all samples with values from 990 to 2040 µS/cm, and is mainly influenced by 301
HCO3, Cl, Ca and Na contents. The pH values as well as the high contents in HCO3
302
and Ca indicate interactions with the aquifer carbonate matrix. The high Na, Cl and 303
Mg contents denote an influence from the sea, but the negative 2H and 18O 304
signatures exclude any large seawater intrusion into the aquifer and rather suggest 305
the influence of sea sprays in the mineralization (Santoni et al., 2016a). Groundwater 306
NO3 contents comply with those found in natural waters, except for three samples
307
above 20 mg/L which highlight locally the vulnerability of the aquifer influenced by 308
human activities. SiO2 and U contents are noticeable with values up to 17 mg/L and
309
1.5 µg/L, respectively, with a correlation coefficient r² about 0.81. These are elements 310
sourced by granitic rocks surrounding the aquifer or sourced by the calcarenites of 311
the aquifer that include sediments from the granite weathering. 312
The 222Rn, 224Ra and 223Ra activities were measured in stream and groundwater 313
(Table 2). The 223Ra activity is low (less than 1.5 Bq/m3) compared to the 222Rn and 314
224
Ra activity, varying from 1199 to 27853 Bq/m3 and from 8.8 to 34.3 Bq/m3, 315
respectively. Radon is fairly well correlated to dissolved uranium in groundwater, (r² = 316
0.79, Table 1), suggesting that the main sources of radon are the Herynian granites. 317
13
The higher activities are found in groundwater sampled at the interface with the 318
fractured granites (REP-B18 and CPO-B10). Stream water CANR-R1 and 319
groundwater from the plateau display lower radon activities, between 1199 and 6081 320
Bq/m3. Bonifacio groundwater and stream water have therefore radon activities
321
sufficiently elevated to provide a radon signature in seawater expected to be 322
detectable using our Rad7 system near the discharges points. 323
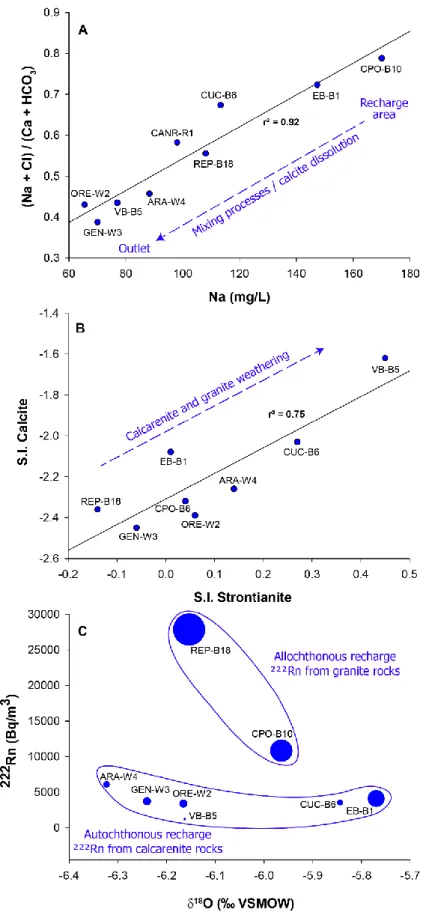
Figure 3 displays binary scatter plots combining hydrochemical and isotope data of 324
groundwater along the flow path from the recharge areas until the coastal outlets 325
where the SGD flows measurement is carried out. The (Na+Cl)/(Ca+HCO3) vs Na
326
graph (Figure 3-A) shows the influence of both marine context and carbonated 327
lithology on the groundwater mineralization through the Na+Cl and Ca+HCO3,
328
respectively. From the recharge areas to the aquifers outlets, the Na content coming 329
from sea sprays decrease by dilution due to a mixing of flow lines originated from 330
different recharge process such as focused recharge (fast transfert of rainwater to 331
the water table) or irrigation recharge (Santoni et al., 2018). In the same time, the 332
(Na+Cl)/(Ca+HCO3) ratio decreases, highlighting an increase in the (Ca+HCO3)
333
content due to the calcite dissolution. This is well supported by the increase in the 334
saturation indexes (SI) of calcite plotted in Figure 3-B. Moreover, in the same figure, 335
the increase in the SI of strontianite with calcite suggests the control of the magmatic 336
and sedimentary lithologies on groundwater mineralization along the flow path from 337
the granites to the carbonate aquifer as also observed in Santoni et al. (2016a). 338
Indeed, the high correlation coefficient between saturation indexes of calcite and 339
strontianite highlights dissolution of granites and of calcarenites that includes calcite 340
and granitic alteration products. The groundwater mineralization is consequently 341
14
influenced by the groundwater origins, by the contrasted lithologies found along the 342
flow path and finally by complex mixing processes. 343
This is also true for the groundwater radon activity: the groundwater flow line 344
originating from the granite surroundings (allochthonous recharge area) displays the 345
higher U concentration and radon activity (Figure 3-C). This feature slightly 346
decreases toward the Stentinu (Canali valley, Sant’Amanza Bay) outlet, probably due 347
to mixing with surface water with groundwater from the calcarenites. This is well 348
supported by the 18O enrichment suggesting the progressive addition of evaporated 349
surface water (Santoni et al., 2018). In addition, the groundwater flow line originating 350
from the plateau (autochthonous recharge area) displays lower U concentration and 351
radon activity that remains relatively high and quite stable until the outlet of the Saint 352
Julien valley (Bonifacio Harbour). The SGD flows detection from 222Rn survey along 353
the coastlines is then expected to be fruitfull in this context. 354
355
4.3. SGD flows detection from in situ T, E.C. and 222Rn survey along the
356
coastlines
357
The in situ seawater temperatures measured along the coastline during the survey 358
are mainly comprised between 14.5 and 15.0°C (Figure 4-A), typical for winter in the 359
western Mediterranean. The local decrease in temperature can be probably related 360
to temperature equilibrium with the cold atmosphere, especially in shallow areas. In 361
addition, thermal contrast between the groundwater and the sea or the atmosphere is 362
expected to be very limited, especially in case of diffuse outflow during winter when 363
the difference of temperature between the sea and the groundwater is the smallest. It 364
is then more relevant to refer to the Figure 2 for discussing temperature contrasts, 365
more visible and relevant during summer. Nevertheless, TIR images and in situ 366
15
temperature give insights on coastal water bodies structure, with differentiated water 367
bodies in the Stentinu and in the Maora areas of the Sant’Amanza bay as well as 368
within the Bonifacio Harbour. These water bodies does not instantly mix with external 369
seawater, suggesting low advection processes. 370
To detect the presence of continental freshwater inputs to the seashores, in situ E.C. 371
was also measured during the survey (Figure 4-B). The highest values are between 372
58 and 61 mS/cm and are found along the eastern granitic part of the study site as 373
well as between the Bonifacio Harbour and Pertusato. In opposition, lower values 374
between 55 and 58 mS/cm are found especially in the northern, southern and 375
western part of the Bonifacio plateau coasts including the Bonifacio Harbour and the 376
Sant’Amanza Bay (Stentinu). Since the E.C. variation is independent of 377
environmental temperature, it is then reasonable to relate a decrease in E.C. to a 378
continental water inflow even if it does not allow to distinguish between surface and 379
groundwater inputs. 380
The Figure 4-C displays the radon activity distribution along the coastline. The 381
eastern granitic part and the northern plateau coasts display intermediate radon 382
activity, comprised between 0 and 40 Bq/m3. The punctual increase observed along 383
the eastern coast may be explained by very local inputs of fresh groundwater through 384
the intense fracturation of the Hercynian granites (Orsini et al., 2010; Santoni et al., 385
2016a), but in any case they cannot be considered as Bonifacio aquifer outlets. The 386
coasts surrounding the Bonifacio plateau display no or low radon activity at the south 387
and the west, except in the harbour and in the Sant’Amanza bay where the values 388
may be greater than 50 Bq/m3, especially in the Maora and Stentinu areas. The low 389
E.C. value and low radon activity found at the south and west part of the plateau can 390
be explained by a weak input of surface water. In opposition, the low E.C. and high 391
16
radon activity found in the Bonifacio Harbour and in the Sant’Amanza Bay (including 392
the narrow Stentinu area of 70 m wide) reveals the presence of SGD flows. This is in 393
very good agreement with the potentiometric and ageing groundwater flow line 394
directions from Santoni (2016) and with the slight decrease in seawater temperature 395
observed from the TIR images displayed in Figure 2. 396
The Figure 5 displays E.C. box plots as a function of 222Rn activity classes for all the 397
coastline survey data. The correlation coefficient r² between E.C. and 222Rn activity is 398
about 0.53, hihlighting a relation between these two variables: the lower is the E.C., 399
higher is the radon activity. This means that the E.C. may be relevant for the 400
detection of SGD flows along the coastlines. Nevertheless, SGD flows may have 401
contrasted effects on coastal seawater E.C and 222Rn activity according to the 402
groundwater origins (i.e. recharge areas). The Figure 3-C clearly shows a wide range 403
of 222Rn activity in groundwater, with the highest values for groundwater coming from 404
the granites area and reaching the Stentinu (Figure 1, Figure 4-C). As a 405
consequence, low SGD flow rates may provide a high 222Rn activity with no major 406
influence on E.C. This observation may explain the moderate r² value (Figure 5). 407
Even if each parameter individually presents its limits, their combination allows here 408
to clearly detect the presence of SGD flows. 409
410
4.4. Estimates of SGD seepage velocities from radon and radium activities
411
An estimate of SGD seepage velocities using radon and radium activities from the 412
fixed measurements carried out over the 1800 m length of the Bonifacio Harbour 413
(Figure 1) is here attempted. As suggested by in situ temperature repartition along 414
seashores (Figure 4A) highlighting different water masses, this calculation assumes 415
that the mixing with external seawater is negligible. This assumption was tested 416
evaluating the eddy diffusion (Deddy) coefficient in the harbour’s water as in Moore
17
(2000). Under the assumption of isotropic medium and steady state condition, the 418
eddy diffusion coefficient is given by equation 1: 419
(equation 1) 420
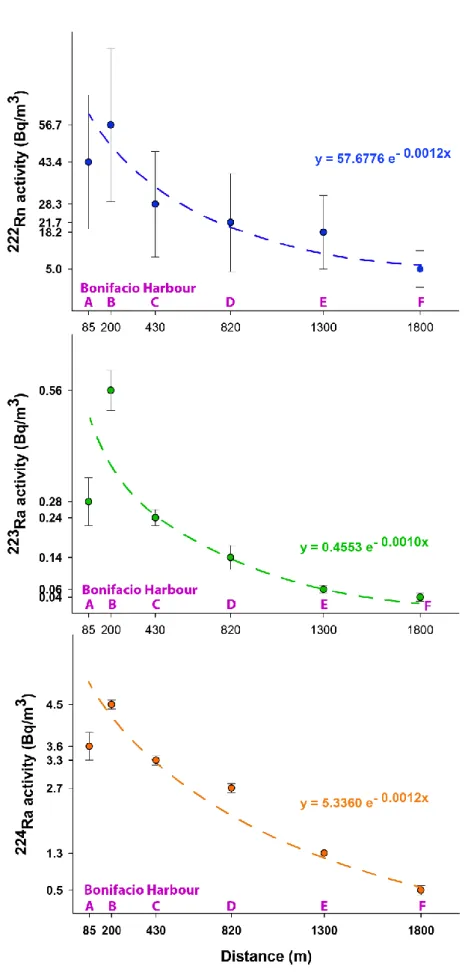
where C is the activity of tracer (radon or radium isotope), x the distance from the 421
input point and lambda the decay constant of the tracer. The computed distance vs. 422
logarithm activities regression line and eddy diffusion coefficients are reported in 423
Figure 6 and Table 4, respectively. The very good correlation between logarithm of 424
radionuclide activities and distance (Figure. 6), as well as the low eddy diffusion 425
coefficients deduced from them suggests that advection is minimal, diffusion and 426
radioactive decay from groundwater inputs in the inner side of the harbour are the 427
dominant processes governing the activity of these tracers in this setting and at the 428
time scales of the half lives of these tracers (3.8 days for 222Rn, 11.3 days for 223Ra, 429
and 3.6 days for 224Ra). This is probably due to the reduced volume and narrow 430
configuration of the Harbour. 431
The wind was low to moderate during the surveys (cf 3.1.3), and the narrow 432
configuration of the Bonifacio Harbour clealry limits the radon degassing from 433
seawater in this area. The radon degassing was therefore not taken into account in 434
the SGD seepage velocity calculation. The incertitude introduced by neglecting the 435
degassing term is discussed later. To evaluate the potential influence of 222Rn 436
diffusion from the sediment (not associated to the SGD flows from the aquifer), a 437
selection of near-shore sediments were sampled over the study area and analysed 438
for the 222Rn activity produced by their equilibration wtih seawater (Figure1, Table 3). 439
The 222Rn diffusive flux obtained from these sediments is very low, in the range from 440
18
1.4 to 6.2 Bq/m2/day. These marine sediments thus cannot constitute a source of 441
222
Rn capable to prevent the detection of SGD flux. 442
In order to calculate SGD seepage velocities, the 222Rn, 223Ra, and 224Ra inventories 443
in the harbour have been determined. Radon and radium activities in function of 444
distance have been fitted by exponential curves that are then integrated over the 445
1800 m length of the harbour (Figure 6). The general pattern of 222Rn, 223Ra and 446
224
Ra data clearly shows an exponential decrease in their activities with distance, 447
implying that the dilution of the isotopic signature with external seawater is negligible. 448
The good exponential data-fit also suggests that the activities of these tracers are 449
probably in a steady state equilibrium condition between sources (groundwater 450
advection) and sinks (diffusions and decay). In the case of the present study, the 451
narrow morphology of the harbour and the piezometric gradient organisation implies 452
major flowlines converging into the internal part of the Bonificio harbour (Santoni, 453
2016). For these reasons, SGD seepage directly through the bottom sediments of the 454
harbour are expected to be low. Assuming horizontal SGD flows as constrained by 455
the geomorphology and the salt wedge position (i.e. horizontal convergence of 456
groundwater flow lines in Figure 1), the radionuclides activities in groundwater inputs 457
are considered as vertically constant on the innermost face of the harbour made of 458
concretes and limestone. Then, the integrals of the activity in harbour water over the 459
distance correspond to the horizontal tracer’s inventories for 1 m² surface units 460
flowing perpendicularly to the innermost face of the harbour and in direction toward 461
the sea (sampling point A to the sampling point F in Figure 1). Parameters of this 462
calculation (distances, activities, exponential regression equations, inventories and 463
resulting seepages for 222Rn, 223Ra and 224Ra) are reported in Table 4. Under these 464
19
assumptions, the calculated horizontal inventories are independent of the water 465
depths in the harbour. 466
From the horizontal tracer inventories, the activity flux (Bq/m2/day) of 222Rn, 223Ra 467
and 224Ra necessary to maintain the diffusive – radioactive decay profile may be 468
calculated for a unit surface perpendicular to the length of the harbour (Table 4), 469
assuming a steady state condition. The groundwater seepage supporting this flux is 470
then calculated dividing the activity flux by the groundwater activity CGW as measured
471
in the sampled point ORE-W2 (Figure 1, Table 4). The computed SGD seepage 472
velocities necessary to compensate for diffusion and decay thus result about 2.24 473
and 3.19 m/day for 222Rn (for 2012 and 2014, respectively), 22.32 m/day for 223Ra 474
and 23.67 m/day for 224Ra. 475
The same approach was applied in the Sant’Amanza Bay, second outlet of the 476
aquifer. From using the in situ 222Rn in the Stentinu and considering CGW as the
477
sampled point CPO-B10, the computed SGD flows seepage velocity necessary to 478
compensate for the diffusion and decay is about 1.84 m/day (Table 4). However, this 479
estimation is probably impacted by degassing process during flow within the Canali 480
Valley until the Stentinu. To avoid this, a computation may also be performed 481
considering CGW as the canali river sample point CAN-R1. The computed SGD flows
482
seepage velocity is then about 18.6 m/day (Table 4). 483
The SGD seepage velocites calculated from 222Rn, 223Ra and 224Ra are in good 484
agreement with other similar contexts in the Mediterranean as obtained in the Port-485
Miou Calanques, southern France (0.1 to 0.4 m/s), in open Mediterranean sea in the 486
Gulf of Lion, southern France (23 m/s,) by Bejannin et al. (2017). Nevertheless, in 487
20
view of the fairly large range of SGD flows seepage velocities obtained, it appears 488
necessary to validate and better constrain these results. 489
4.5. Validation of SGD flows velocities by groundwater Darcy velocity
490
The eddy mixing coefficients deduced from the good exponential fit of radionuclides 491
activities over the 1800 m of the Bonifacio Harbour allow the application of the first 492
Fick’s law to calculate the SGD freshwater seepage velocity necessary to dilute the 493
seawater salinity in the Harbour as observed in the E.C. profile. The flux calculated 494
using the first Fick's law assumes a freshwater fraction gradient in the harbour of -495
1.89E-05 (m-1). This gradient is calculated from 3.5% freshwater dilution, obtained from
496
the E.C. difference between inner harbour and offshore waters, over a total length of 497
1800 m (Figure 1). Assuming a steady state condition and E.C. conservative, the 498
seepage velocity of SGD flows of the “pure” freshwater component, necessary to 499
sustain the diffusive profile observed for E.C., is between 0.44 and 2.06 m/day (Table 500
4), using respectively the Deddy obtained from 223Ra and 224Ra profiles. 501
Unlike for E.C., the SGD seepage velocities based on 222Rn, 223Ra, and 224Ra 502
corresponds to the sum of two flows, fresh groundwater and recycled seawater. The 503
quantification of the seawater recycling is however particularly difficult using radium 504
and radon isotopes because these tracers may be partially scavenged from seawater 505
when intruding a coastal aquifer, yielding in this case to an underestimation of total 506
SGD (Zhang et al., 2017). In other setting, the recycled seawater flux may constitute 507
a net tracer input in seawater inventory, yielding to an overestimation of the real 508
“continental” water SGD flux (Rodellas et al., 2015). 509
21
Nevertheless, by comparing the total SGD seepage velocity obtained from the radon 511
mass balance (2.25 m/d) and the freshwater SGD seepage velocity obtained from 512
the salinity profile with the first Fick’s Law (2.04 m/d), we may roughly estimate that 513
the recycled seawater component represents about 10 % of the total SGD. The 514
fraction of recycled seawater estimated by comparing 224Ra or 223Ra seepage 515
velocities and freshwater SGD seepage velocity from salinity profile is instead much 516
larger (seawater recycling would be about 10 times the freshwater SGD). We tend to 517
prefer the estimate based on 222Rn because sediment equilibration experiments 518
showed that radon diffusion from sediment is very low. Seawater recycling through 519
these sediments would therefore not affect significantly the total input flux of radon 520
and so the estimate of total SGD. Conversely, for the radium isotopes, since radium 521
diffusion from near shore sediments is unknown, the effect of seawater recycling on 522
the total SGD calculation cannot be estimated. The total SGD estimate based on 523
222
Rn (and the radon-based seawater recycling fraction) was also preferred because 524
the seepage velocities values obtained in 2012 and 2014 yielded similar results 525
(Table 4). 526
In order to validate the SGD velocities estimates, they are now compared with the 527
Darcy velocity deduced from hydrodynamic modelling and aquifer recharge rate 528
estimations previously published. 529
Table 5 shows Permeability (K) for the Bonifacio aquifer from existing literature and 530
associated Darcy velocity (q) computed between EB-B1 and ORE-W2 in the Saint 531
Julien Valley considering L = 1173 m and H = 48 m. The q values deduced from 532
Proton Magnetic Resonance and pumping tests are between 0.46 and 1.06 m/d. 533
These values are slightly lower but closest and in the same order of value to SGD 534
22
seepage velocities from radon and from the Fick law (Table 4). Uncertainties 535
nevertheless remain on q values because they are computed from permeability 536
coefficients K issued from different method as well as from various location over the 537
plateau. Furthermore, the Darcy groundwater velocities assume a steady state and 538
isotropic porous media, which is the case at the Saint Julien Valley’s scale 539
(Chesneaux et al., 2018) but not the case at the whole aquifer scale (Santoni et al., 540
2018). 541
The SGD seepage velocities from radon and from the Fick law are also in very good 542
agreement with values of groundwater Darcy velocity within the Bonifacio aquifer 543
from combining analytical solution with geochemical and dating tracers (Table 5). 544
Considering a steady-state Dupuit-type flow in the Saint Julien Valley, the analytical 545
solution of Chesnaux et al. (2018) applied between the sampling points EB-B1 and 546
ORE-W2 and assuming groundwater transit time of 30 years, an effective porosity of 547
7%, and a hydraulic conductivity from 1.3 to 3.0 × 10⁻⁴ m/s, the recharge was 548
calculated to be of 115 mm/year i.e. 23 % of the annual rainfall. This value is in very 549
good agreement with the aquifer functioning and with the 132 mm/year (26%) 550
obtained previously for this aquifer using 8 other methods by Santoni et al. (2018). 551
This highlights the strong relationship of groundwater flow velocity with groundwater 552
residence time, effective porosity, permeability and recharge for this aquifer. From 553
this steady-state Dupuit-type flow in the Saint Julien Valley, the Darcy groundwater 554
velocity computed considering the permeability range give values between 0.46 and 555
1.06 m/day, that is in the same order of value for the SGD flows seepage velocity 556
calculated from 222Rn and from the Fick law, allowing the SGD seepage velocities 557
from radon to be considered as robust. 558
23 4.6. SGD seepage flow and water balance quantification of the Bonifacio
559
Mediterranean porous aquifer
560
As shown through TIR images and in situ measurements, the aquifer outlet 561
generates diffuse outflow in the Bonifacio Harbour and within the Sant’Amanza Bay 562
including the Stentinu area. The computed SGD seepage flow velocities for surface 563
units of 1 m² being now considered as robust, SGD seepage flow rates can be 564
computed by multiplying SGD seepage flow velocities with the discharge area at the 565
outlets. The computation of SGD seepage flow rates assumes an outlet width of 140 566
m and 1.4 m depth in the Bonifacio Harbour, a outlet of 350 m width and 1.5 m depth 567
in the Sant’Amanza bay and a outlet of 70 m width and 1.5 m depth in the Stentinu. 568
The 222Rn seepage velocity considered is 2.24 m/d for the Bonifacio Harbour, 1.84 569
m/d in the Sant’Amanza Bay and 18.60 m/d in the Stentinu. The total seepage flow 570
rate obtained is then 38.9 L/s, with 5.1 L/s in the Bonifacio Harbour, 11.2 L/s in 571
Sant’Amanza and 22.6 L/s in the Stentinu (including the Canali River flow). 572
The SGD seepage flow rates can now be related to the hydrogeological functionning 573
of the Bonifacio aquifer. Considering a recharge about 132 mm/y in a 33 Km² 574
watershed, i.e. 138 L/s (Santoni et al., 2018) and a public water supply about 575
174,638 m3/y, i.e. 5.5 L/s (Santoni, 2016), the expected SGD seepage flow rate is 576
expected to be 132.5 L/s. In these conditions, the total 38.9 L/s SGD seepage flow 577
rate obtained represents 29 % of the expected flow, i.e. 28 % of the aquifer recharge 578
rate. According to this observation, 68 % of the recharge water are missing at the 579
identified aquifer outlets. 580
Assuming that the aquifer recharge value is robust (Chesnaux et al., 2018; Santoni et 581
al., 2018), many hypothesis may be formulated on this result : (1) the field campaign
582
corresponds to a low water level period, underestimating the SGD seepage flow rate 583
24
due to a loss of water pressure within the aquifer ; (2) due to diffuse SGD flow 584
conditions, the major part of the SGD flows is not detected ; (3) the major part of the 585
recharge water in the upper aquifer level supplies the lower aquifer level by 586
downward drainance. The first hypothesis can be rejected because 222Rn 587
measurements have been performed in the Bonifacio Harbour during October 2012 588
at low water level and during January 2014 at high water level without this causing 589
any major change in the SGD seepage flow velocities (2.24 m/d in Oct. 2012 and 590
3.19 m/d in Jan. 2014; Table 4) that is in relation with the known inertial behavior of 591
the aquifer (Santoni, 2016). The second hypothesis cannot be refuted as it stands but 592
the third hypothesis seems to be the most probable. Indeed, according to Santoni et 593
al. (2016a), the recharge of the lower aquifer by downward drainance is estimated by
594
a combined H218O – 86Sr/87Sr approach to be 65 – 70 %. This observation implies
595
that the outlet of the lower aquifer is different from those of the upper one. The first 596
should be governed by the paleomorphology of the underlying fractured granites 597
whereas the second one may be directly dependant of the present surface 598
morphology organized in valleys WSW-ENE oriented explaining the Bonifacio 599
Harbour and Sant’Amanza outlets. The outlet(s) of the lower aquifer is(are) probably 600
located further offshore and at greater depth, which explains its(their) non-detection 601
during the survey at 1 m depth performed for this study. 602
The SGD seepage flow being now solved, it is possible to propose a water balance 603
budget for the whole Bonifacio Mediterranean porous aquifer (Figure 7). From an 604
aquifer recharge rate about 132 mm/y, 32 % of the recharge water flows within the 605
upper aquifer until the Bonifacio Harbour (4 %), the Sant’Amanza Bay (8%) and until 606
the Stentinu as SGD flows and river flow (16 %). The public drinking water supply 607
also represents an outlet to the upper aquifer (4%). Finally, 68 % of the aquifer 608
25
recharge rate supply the lower aquifer level by downward drainance from the upper 609
aquifer. This water balance then validate and improve the conceptual 610
hydrogeological functioning of the Bonifacio aquifer. 611
From a management point of view, the detection and localization of SGD flows 612
suggest a natural behavior of the aquifer excluding major over-pumping and 613
seawater intrusion despite the limited potential of recharge, the large interface with 614
the sea, the touristic pressure and the changes in the climate. This seems to be 615
related to a low withdrawal pressure yet exerted on the aquifer as well as to a 616
predominant focused recharge process implying a fast transfer of rainwater to the 617
water table that may be favored by the increase in high rainfall events due to climate 618
change in the Mediterranean (Hartmann et al., 2017; Santoni et al., 2018). 619
620
5. Conclusions
621
This study allowed to validate and improve the conceptual hydrogeological model of 622
a Mediterranean porous aquifer with low potential of recharge and high vulnerability 623
due to a large interface with the sea, the tourism pressure and the changes in the 624
climate. The experimental approach coupling TIR, T, E.C., majors ions, selected 625
trace elements, 2H, 18O, 222Rn, 223Ra and 224Ra proved to be relevant in the detection 626
and quantification of low and diffuse SGD flows, highlighting quite natural flow 627
conditions and excluding any major over-pumping. The acquisition of TIR images is 628
able to detect slight temperature variations at the seawater surface. Such imagery 629
nevertheless loses effectiveness in windy areas. The in situ geochemical and isotopic 630
investigations allows ensuring the presence of sufficient radon and radium activities 631
in groundwater to detect SGD flows along the seashores. Favourable lithology and 632
strong water-rock interactions involved by long groundwater residence time favours 633
26
the radon content in coastal aquifer outlets. Most of the time, the lower is the 634
temperature and the E.C., the higher are the radon and radium activities. The SGD 635
flow velocity required for flow rates calculation from 222Rn is validated with 636
groundwater Darcy velocity in the aquifer. The quantification of SGD flows rates 637
revealed in very good agreement with the known recharge rates and flow conditions 638
within the aquifer. Such a methodology could be applied to other similar coastal 639
aquifers with low and diffuse SGD flow conditions worldwide. For the first time in the 640
Mediterranean or in semi-arid context, a natural tracing experiment based on 641
geochemistry and isotope hydrology tools allowed the quantification of SGD flows to 642
validate the hydrogeological conceptual model and to solve the water balance at the 643
whole aquifer scale. This study finally helped to better define the scope in terms of 644
detection limits for TIR images associated with in situ geochemical and isotopic tools 645
in the detection of low and diffuse SGD flows. 646
Acknowledgements
647
The PhD grant of Sébastien Santoni was financially supported by the Regional 648
Council of Corsica (Collectivité de Corse). The authors would like to thank the 649
municipality of Bonifacio for their support and contribution to the implementation of 650
the project as well as the Bonifacio inhabitants for access to their wells and 651
boreholes during the field sampling. The authors are also grateful to S. Cockenpot 652
and C. Claude for help provided at the very beginning of the project. 653
27 References
655
Barlow, P.M., Reichard, E.G., 2009. Saltwater intrusion in coastal regions of North America. 656
Hydrogeology Journal, 18(1): 247-260. DOI:10.1007/s10040-009-0514-3
657
Baudron, P., Cockenpot, S., Lopez-Castejon, F., Radakovitch, O., Gilabert, J., Mayer, A., Garcia-658
Arostegui, J.L., Martinez-Vicente, D., Leduc, C., Claude, C., 2015. Combining radon, short-659
lived radium isotopes and hydrodynamic modeling to assess submarine groundwater 660
discharge from an anthropized semiarid watershed to a Mediterranean lagoon (Mar Menor, 661
SE Spain). Journal of Hydrology, 525: 55-71. 662
DOI:http://dx.doi.org/10.1016/j.jhydrol.2015.03.015
663
Beck, A.J., Dulaiova, H., Cochran, J.K., 2010. Journal of Environmental Radioactivity special issue: 664
Radium and Radon Isotopes as Environmental Tracers. Journal of Environmental 665
Radioactivity, 101: 519-520. DOI:10.1016/j.jenvrad.2010.04.013
666
Bejannin, S., van Beek, P., Stieglitz, T., Souhaut, M., Tamborski, J., 2017. Combining airborne thermal 667
infrared images and radium isotopes to study submarine groundwater discharge along the 668
French Mediterranean coastline. Journal of Hydrology: Regional Studies, 13: 72-90. 669
DOI:10.1016/j.ejrh.2017.08.001 670
Bokuniewicz, H., Buddemeier, R., Maxwell, B., Smith, C., 2003. The typological approach to 671
submarine groundwater discharge (SGD). Biogeochemistry, 66: 145–158. 672
Burnett, W.C., Aggarwal, P.K., Aureli, A., Bokuniewicz, H., Cable, J.E., Charette, M.A., Kontar, E., 673
Krupa, S., Kulkarni, K.M., Loveless, A., Moore, W.S., Oberdorfer, J.A., Oliveira, J., Ozyurt, N., 674
Povinec, P., Privitera, A.M.G., Rajar, R., Ramessur, R.T., Scholten, J., Stieglitz, T., Taniguchi, 675
M., Turner, J.V., 2006. Quantifying submarine groundwater discharge in the coastal zone via 676
multiple methods. Science of The Total Environment, 367: 498-543. 677
DOI:10.1016/j.scitotenv.2006.05.009 678
Burnett, W.C., Bokuniewicz, H., Huettel, M., Moore, W.S., Taniguchi, M., 2003. Groundwater and 679
pore water inputs to the coastal zone. Biogeochemistry, 66: 3-33. 680
DOI:10.1023/B:BIOG.0000006066.21240.53 681
Burnett, W.C., Santos, I.R., Weinstein, Y., Swarzenski, P.W., Herut, B., 2007. Remaining uncertainties 682
in the use of Rn-222 as a quantitative tracer of submarine groundwater discharge. IAHS Publ., 683
312. DOI:9781901502046 684
Chesnaux, R., Santoni, S., Garel, E., Huneau, F., 2018. An Analytical Method for Assessing Recharge 685
Using Groundwater Travel Time in Dupuit-Forchheimer Aquifers. Ground Water. 686
DOI:10.1111/gwat.12794 687
Corbett, D.R., Burnett, W.C., Cable, P., Clarck, S., 1998. A multiple approach to the determination of 688
radon fluxes from sediments. Journal of radioanalytical and nuclear chemistry, 236(1-2). DOI: 689
https://doi.org/10.1007/BF02386351 690
Destouni, G., Prieto, C., 2003. On the possibility for generic modeling of submarine groundwater 691
discharge. Biogeochemistry, 66: 171-186. DOI:10.1023/B:BIOG.0000006101.12076.10 692
Dimova, N., Burnett, W.C., Lane-Smith, D., 2009. Improved Automated Analysis of Radon (222Rn) and 693
Thoron (220Rn) in Natural Waters. Environ. Sci. Technol., 43(22): 8599-8603. 694
DOI:10.1021/es902045c 695
Dörfliger, N., Ferrandini, J., Ferrandini, M., Mathieu, F., 2002. Caractérisation géométrique et 696
hydrodynamique du causse de Bonifacio (Corse) à partir d'une synthèse des connaissances 697
géologiques et hydrogéologiques et par méthodes géophysiques., BRGM/RP-51860-FR. 698
DOI:BRGM/RP-51860-FR 699
Garcia-Solsona, E., Masqué, P., Garcia-Orellana, J., Rapaglia, J., Beck, A.J., Cochran, J.K., Bokuniewicz, 700
H.J., Zaggia, L., Collavini, F., 2008. Estimating submarine groundwater discharge around Isola 701
La Cura, northern Venice Lagoon (Italy), by using the radium quartet. Marine Chemistry, 109: 702
292-306. DOI:10.1016/j.marchem.2008.02.007 703
Ghiglieri, G., Carletti, A., Pittalis, D., 2014. Runoff coefficient and average yearly natural aquifer 704
recharge assessment by physiography-based indirect methods for the island of Sardinia 705
28 (Italy) and its NW area (Nurra). Journal of Hydrology, 519: 1779-1791.
706
DOI:10.1016/j.jhydrol.2014.09.054 707
Hartmann, A., Gleeson, T., Wada, Y., Wagener, T., 2017. Enhanced groundwater recharge rates and 708
altered recharge sensitivity to climate variability through subsurface heterogeneity. 709
Proceedings of the National Academy of Sciences, 114: 2842-2847.
710
DOI:10.1073/pnas.1614941114 711
Holding, S., Allen, D.M., Foster, S., Hsieh, A., Larocque, I., Klassen, J., Van Pelt, S.C., 2016. 712
Groundwater vulnerability on small islands. Nature Climate Change, 6(12): 1100-1103. 713
DOI:10.1038/nclimate3128 714
Kaleris, V., 2006. Submarine groundwater discharge: Effects of hydrogeology and of near shore 715
surface water bodies. Journal of Hydrology, 325: 96-117. DOI:10.1016/j.jhydrol.2005.10.008 716
Kluge, T., von Rohden, C., Sonntag, P., Lorenz, S., Wieser, M., Aeschbach-Hertig, W., Ilmberger, J., 717
2012. Localising and quantifying groundwater inflow into lakes using high-precision 222Rn 718
profiles. Journal of Hydrology, 450-451: 70-81. DOI:10.1016/j.jhydrol.2012.05.026 719
Lamontagne, S., Le Gal La Salle, C., Hancock, G.J., Webster, I.T., Simmons, C.T., Love, A.J., James-720
Smith, J., Smith, A.J., Kämpf, J., Fallowfield, H.J., 2008. Radium and radon radioisotopes in 721
regional groundwater, intertidal groundwater, and seawater in the Adelaide Coastal Waters 722
Study area: Implications for the evaluation of submarine groundwater discharge. Marine 723
Chemistry, 109: 318-336. DOI:10.1016/j.marchem.2007.08.010
724
Lee, J.-Y., 2014. Use of environmental and applied tracers for groundwater studies in Korea. 725
Geosciences Journal, 18: 115-123. DOI:10.1007/s12303-013-0050-y
726
Mahlknecht, J., Merchan, D., Rosner, M., Meixner, A., Ledesma-Ruiz, R., 2017. Assessing seawater 727
intrusion in an arid coastal aquifer under high anthropogenic influence using major 728
constituents, Sr and B isotopes in groundwater. Sci Total Environ, 587-588: 282-295. 729
DOI:10.1016/j.scitotenv.2017.02.137 730
Mayer, A., Nguyen, B.T., Banton, O., 2016. Using radon-222 to study coastal groundwater/surface-731
water interaction in the Crau coastal aquifer (southeastern France). Hydrogeology Journal, 732
24: 1775-1789. DOI:10.1007/s10040-016-1424-9 733
Mazi, K., Koussis, A.D., Destouni, G., 2014. Intensively exploited Mediterranean aquifers: resilience to 734
seawater intrusion and proximity to critical thresholds. Hydrology and Earth System Sciences, 735
18: 1663-1677. DOI:https://doi.org/10.5194/hess-18-1663-2014 736
Mazi, K., Koussis, A.D., Destouni, G., 2016. Quantifying a Sustainable Management Space for Human 737
Use of Coastal Groundwater under Multiple Change Pressures. Water Resources 738
Management, 30: 4063-4080. DOI:10.1007/s11269-016-1363-1
739
McCoy, C.A., Corbett, D.R., 2009. Review of submarine groundwater discharge (SGD) in coastal zones 740
of the Southeast and Gulf Coast regions of the United States with management implications. 741
Journal of Environmental Management, 90: 644-651. DOI:10.1016/j.jenvman.2008.03.002
742
Meixner, T., Manning, A.H., Stonestrom, D.A., Allen, D.M., Ajami, H., Blasch, K.W., Brookfield, A.E., 743
Castro, C.L., Clark, J.F., Gochis, D.J., Flint, A.L., Neff, K.L., Niraula, R., Rodell, M., Scanlon, B.R., 744
Singha, K., Walvoord, M.A., 2016. Implications of projected climate change for groundwater 745
recharge in the western United States. Journal of Hydrology, 534: 124-138. 746
DOI:10.1016/j.jhydrol.2015.12.027 747
Mejías, M., Ballesteros, B.J., Antón-Pacheco, C., Domínguez, J.A., Garcia-Orellana, J., Garcia-Solsona, 748
E., Masqué, P., 2012. Methodological study of submarine groundwater discharge from a 749
karstic aquifer in the Western Mediterranean Sea. Journal of Hydrology, 464-465: 27-40. 750
DOI:10.1016/j.jhydrol.2012.06.020 751
Montiel, D., Dimova, N., Andreo, B., Prieto, J., García-Orellana, J., Rodellas, V., 2018. Assessing 752
submarine groundwater discharge (SGD) and nitrate fluxes in highly heterogeneous coastal 753
karst aquifers: Challenges and solutions. Journal of Hydrology, 557: 222-242. 754
DOI:10.1016/j.jhydrol.2017.12.036 755
Moore, W.S., 1996. Large groundwater inputs to coastal waters revelated by 226Ra enrichments. 756
Nature, 380: 612-614. DOI:10.1038/380612a0