Attentional Load and Sensory Competition in Human Vision: Modulation of fMRI Responses by Load at Fixation during Task-irrelevant Stimulation in the Peripheral Visual Field
17
0
0
Texte intégral
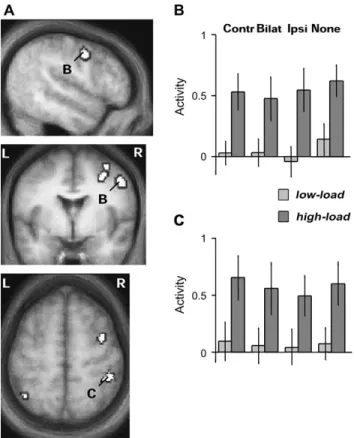
Figure
Documents relatifs