Feature-Based Attention Affects Direction-Selective fMRI Adaptation in hMT+
Sarah Weigelt
1,2,3, Wolf Singer
1,2,4,5and Axel Kohler
1,2,61
Department of Neurophysiology, Max Planck Institute for Brain Research, Frankfurt am Main D-60528, Germany
2Brain
Imaging Center Frankfurt, Frankfurt am Main D-60528, Germany
3Department of Brain and Cognitive Sciences and McGovern
Institute for Brain Research, Massachusetts Institute of Technology, Cambridge, MA 02139, USA
4Ernst Strüngmann Institute
(ESI) for Neuroscience in Cooperation with Max Planck Society, Frankfurt am Main D-60528, Germany
5Frankfurt Institute for
Advanced Studies, Goethe University, Frankfurt am Main D-60438, Germany and
6Department of Psychiatric Neurophysiology,
University Hospital of Psychiatry, University of Bern, Bern 60 3000, Switzerland
Address correspondence to Dr Sarah Weigelt, Massachusetts Institute of Technology, Department of Brain and Cognitive Sciences, McGovern Institute for Brain Research, 77 Massachusetts Avenue, Room 46-4141, Cambridge, MA 02139, USA. Email: weigelt@mit.edu
Functional magnetic resonance adaptation has been successfully
used to reveal direction-selective responses in the human motion
complex (hMT+). Here, we aimed at further investigating
direction-selective as well as position-direction-selective responses of hMT+ by
looking at how these responses are affected by feature-based
attention. We varied motion direction and position of 2 consecutive
random-dot stimuli. Participants had to either attend to the direction
or the position of the stimuli in separate runs. We show that
direc-tion selectivity in hMT+ as measured by funcdirec-tional magnetic
res-onance imaging (fMRI) adaptation was strongly in
fluenced by task
set. Attending to the motion direction of the stimuli lead to stronger
direction-selective fMRI adaptation than attending to their position.
Position selectivity, on the other hand, was largely unaffected by
attentional focus. Interestingly, the change in the direction-selective
adaptation pro
file across tasks could not be explained by
inheri-tance from earlier areas. The response pattern in the early
retinoto-pic cortex was stable across conditions. In conclusion, our results
provide further evidence for the
flexible coding of direction
infor-mation in hMT+ depending on task demands.
Keywords: direction selectivity, motion perception, neuroimaging,
repetition suppression, V1
Introduction
To adequately react to a moving object, our visual motion
system has to determine several features of that object: Its
pos-ition in 3D space, its motion direction, as well as its speed. In
the present paper, we investigate the effects of feature-based
attention
—attending to the position of a moving object versus
attending to its motion direction
—on position- and
direction-selective responses in the human motion complex (hMT+).
hMT+ has been identi
fied as a core region for the
proces-sing of motion information (
Zeki et al. 1991
;
Watson et al.
1993
;
Tootell, Reppas, Kwong et al. 1995
). Responses in
hMT+ and homologous regions in other primates are
modu-lated by feature-based attention as well as task set (
Corbetta
et al. 1990
;
1991
;
Beauchamp et al. 1997
;
Chawla et al. 1999
;
Treue and Martinez-Trujillo 1999
;
Huk and Heeger 2000
;
Saenz et al. 2003
;
Maunsell and Treue 2006
;
Liu et al. 2007
).
Furthermore, the amount of attentional modulation depends
on the attended feature: hMT+ is more strongly activated
when attention is directed toward speed in comparison to
color (
Corbetta et al. 1990
,
1991
;
Beauchamp et al. 1997
;
Chawla et al. 1999
), shape (
Corbetta et al. 1990
,
1991
), or
contrast of a moving object (
Huk and Heeger 2000
).
First evidence for the direction selectivity of hMT+ in
humans came from studies on the motion aftereffect (
Tootell,
Reppas, Dale et al. 1995
;
He et al. 1998
;
Culham et al. 1999
;
but see
Huk et al. 2001
). Experiments using functional
mag-netic resonance imaging (fMRI) adaptation (
Huk et al. 2001
;
Nishida et al. 2003
;
Ashida et al. 2007
;
Smith and Wall 2008
;
Lee and Lee 2012
) and employing multivariate pattern
ana-lyses (
Kamitani and Tong 2006
;
Serences and Boynton 2007
)
con
firmed and strengthened the finding of direction
selec-tivity in hMT+. With respect to position-selective information,
hMT+ presumably contains several retinotopic representations
of the contralateral hemi
field (
Huk et al. 2002
;
Gardner et al.
2008
;
Amano et al. 2009
;
Kolster et al. 2010
) with large
recep-tive
fields compared with early visual areas (
Amano et al.
2009
). It is also sensitive to depth (
Neri et al. 2004
;
Brouwer
et al. 2005
;
Likova and Tyler 2007
;
Smith and Wall 2008
;
Rokers et al. 2009
), thus providing information with regard to
the position of a moving object in 3D space.
In the present study, we aimed at extending previous
find-ings by examining not only the effect of feature-based
atten-tion on the overall activity of hMT+, but by its effect on
selectivity. Using fMRI adaptation, we investigated the
response pro
file of hMT+ during 2 different tasks focusing
the observers on changes in motion direction and position,
respectively. We were interested in the in
fluence of attentional
set on position- and direction-selective adaptation effects. To
control whether the effects are inherited from areas lower in
the processing hierarchy, we also analyzed the responses in
the early retinotopic cortex.
Materials and Methods
Subjects
Twenty-one healthy subjects participated in this study. Subjects were students recruited from the Goethe University of Frankfurt or members of the Frankfurt neuroscience community and gave their informed written consent to the procedure in accordance with insti-tutional guidelines and the Declaration of Helsinki. All subjects had normal or corrected-to-normal vision and were right-handed as assessed by an adapted version of the Edinburgh Handedness Scale. The data from one subject had to be excluded because of excessive head motion. From the remaining 20 subjects (9 female; mean age: 24.85 years; range: 20–32 years), 5 additional subjects had to be excluded during data analyses because of their low behavioral per-formance (<70% correct responses) in the direction task (see below). Of the remaining 15 subjects, 6 were female, the mean age was 25.4 years and the age range was 20–32 years. The study was approved by the ethics committee of the Medical School of the University Clinics Frankfurt.
Cerebral Cortex September 2013;23:2169–2178 doi:10.1093/cercor/bhs192
Procedure
Scanning took place at the Brain Imaging Center, Frankfurt, Germany. All subjects were measured on 2 separate days: Once for the adaptation experiment (both tasks) and once for the mapping experiment. The mapping session was always after the adaptation experiment, separated by approximately 8 weeks.
Apparatus
Visual stimuli were delivered via a video goggle system (VisuaStim Digital Glasses; Resonance Technology, Northridge, CA, United States of America). The refresh rate of the goggle monitors was set to 60 Hz for all stimuli. A custom-madefiber-optic button box allowed the sub-jects to communicate their decisions in the behavioral tasks.
Adaptation Experiment Stimuli
Visual stimuli were programmed using custom-made C++ code. The stimulus consisted of 8 circular apertures (random-dot aperture; with a size of 1.5° visual angle) that contained 40 moving white dots (each 0.056° visual angle) on a black background (Fig.1A). The random-dot apertures were aligned onto radii whose central point was in the middle of the screen. The position of each random-dot aperture on its particular radius was chosen randomly for each experimental trial, but restricted to an annulus between 3 and 8.25° visual angle. The dots of all random-dot apertures moved with 100% coherence (unlim-ited lifetime) and a speed of 6.78° visual angle per second on one of the diagonals (45°, 135°, 225°, or 315°). It is important to emphasize that the dots within the apertures moved, but the apertures them-selves remained stationary. One stimulus consisted of 300 ms of a random-dot sequence, presented at a frame rate of 60 Hz. A white fix-ation cross (sized 0.57 × 0.57° visual angle) was always displayed in the middle of the screen.
Experimental Design
Figure1B displays the course of an experimental trial that began with the presentation of the adaptor stimulus for 300 ms followed by a blank interstimulus interval (only the fixation cross was present) lasting 100 ms. Then, the test was presented for 300 ms. After that, a blank screen was displayed for 2300 ms, yielding a trial duration of 3000 ms in total. Figure1C displays the different experimental con-ditions defined by variations of the test. The test could be a repetition of the adaptor in terms of the motion direction of the dots and the position of the random-dot apertures (“same direction–same pos-ition”), or varied from the adaptor either with respect to the position of the apertures (“same direction–different position”) or with respect to the motion direction of the dots (“different direction–same pos-ition”) or with respect to both the position of the apertures and the motion direction of the dots (“different direction–different position”).
Figure 1. Stimulus and experimental design. (A) Scaled illustration of the stimulus. The stimulus consisted of 8 circular random-dot apertures (each sized 1.5° visual angle) that contained 40 moving white dots (each 0.056° visual angle) on a black background. The random-dot apertures were aligned onto radii whose central point
was in the middle of the screen. The position of each random-dot aperture on its radius was chosen randomly for each trial, but restricted to an annulus between 3° and 8.25° visual angle. (B) Sequence of an experimental trial. Each trial started with the presentation of the adaptor stimulus (adaptor) for 300 ms, followed by a blank interstimulus interval for 100 ms. Then, the test stimulus (test, in this case showing a position change) was presented for 300 ms. The trial ended with a 2300 ms intertrial interval, in which subjects responded according to the task. Adaptor and test were movies of white dots within random-dot apertures. Throughout the visual stimulation, afixation cross was shown at the center of the screen. (C) Schematic illustration of the 4 different experimental conditions. The test was varied along the dimensions “position of the random-dot apertures” (same/different) and “motion direction of the dots” (same/different) with regards to the adaptor. This led to 4 experimental conditions: A test that was identical to the adaptor (same direction– same position, cyan), a test in which the position changed, but the motion direction was the same (same direction–different position, dark blue), a test in which the motion direction changed, but the position of the random-dot apertures remained the same (different direction–same position, light green), or a test in which both the motion direction and the position changed (different direction–different position, dark green). Dotted white circles and lines, as well as white arrows, were not actually shown but aid visualization.
Thefirst and last experimental conditions served as lower and upper boundaries for the expected adaptation effects.
A change in the position of the random-dot apertures was defined by a shift of each aperture along their respective radii either toward or away from the center of the screen (fixation cross). The shift sub-tended 3.23° visual angle from center to center of the aperture, thus creating a gap of 0.23° visual angle between the old and the new outer border of the aperture. The inward/outward shift of all aper-tures together was set such that the average eccentricity of the adaptor and the test stimulus remained the same. A change in the motion direction of the dots was defined by a +90° or −90° step.
The order of the presentation of the experimental trials was coun-terbalanced across runs per subject (i.e. trials from each condition [fixation included] were preceded [two trials back] equally often by trials from each other condition). Because of this strategy, thefirst 3 experimental trials (which had no adequate history) were excluded from the analyses.
For the adaptation experiment, subjects underwent 6 experimental runs (7 min each; 3 runs per behavioral task) and an anatomical run (9 min 38 s). Each experimental run began with afixation point pre-sented for 16 s, then followed by an experimental block consisting of 125 trials, 3 s each (100 experimental trials, plus 25fixation trials, plus 3 extra trials; see below). At the end of each run, afixation point was shown for 16 s. In summary, each experimental run had 25 trials per experimental condition, resulting in 75 trials per subject per experimental condition for each of the 2 behavioral tasks.
Behavioral Task
Subjects were instructed to maintain fixation on the center cross throughout the experimental run, while performing the behavioral tasks. The behavioral task always consisted in a same/different com-parison between the test and the adaptor. In one half of the exper-imental runs, subjects were asked to indicate via a button press whether the random-dot apertures were at the same positions in the test as in the adaptor or whether their positions had changed (“attention-to-position task”). In the other half of experimental runs, subjects had to indicate via a button press whether the motion direc-tion of the dots was the same in the test as in the adaptor or whether the motion direction had changed (“attention-to-direction task”). Sub-jects did not receive feedback on their performance.
Subjects performed 3 runs of each task, which were separated by the anatomical run, for example, they started with 3 runs performing the attention-to-position task, then followed the anatomical run, and then they continued with 3 runs now performing the attention-to-direction task or vice versa. The order of tasks was counterba-lanced across subjects. Subjects always responded with their right index and middlefinger—the association of same/different to the 2 fingers was counterbalanced across subjects.
We analyzed percent correct responses and median reaction times. We chose to analyze median reaction times instead of mean reaction times because we did not explicitly instruct our subjects to respond as fast as possible and therefore were aiming at a stable measure of reac-tion time. Responses were defined by a button press in an interval between 500 and 2000 ms after the onset of the adaptor (which equals 100 and 1600 ms after the onset of the test). If no button press was detected in that time window, this was counted as a miss. Also, only thefirst button press was taken into account; if a second button press occurred, this was ignored. Data were averaged across runs (3 runs per task) per subject. The mean percent correct was 84.35% for the attention-to-direction task (standard deviation [SD], 10.89) and 96.86% (SD, 2.80) for the attention-to-position task. Ranking the sub-jects according to their performance in the attention-to-direction task and contrasting this performance with the performance in the attention-to-position task, we found that the performance of 5 sub-jects was below 1 SD of the average with <70% correct responses in the attention-to-direction task (while performance in the attention-to-position task was similar across subjects) and thus excluded those subjects from further analyses. Note that this pro-cedure did not lead to a complete matching of task difficulty. The remaining 15 subjects performed above 85% correct in both tasks
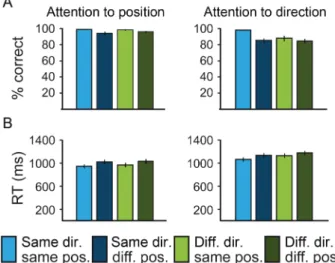
(Fig. 2), with 89.28% (SD, 6.48) in the attention-to-direction task and 97.12% (SD, 2.47) in the attention-to-position task. The attention-to-direction task was significantly more difficult than the attention-to-attention task ( paired t-test, t(14) = 4.66, P < 0.001). However, a full difficulty matching was impossible to achieve, as it would have meant either decreasing the saliency of the position change or increasing the saliency of the direction change. Decreasing the position change was not possible, as it would have resulted in an overlap of the two apertures in the different condition, which in turn would have abolished the rebound effect to a change in position and participants’ performance was already at ceiling. Increasing the direc-tion change was not possible either: In pilot experiments, we tried various speeds and also a change in direction of 180° instead of 90°– none led to a higher performance in the task. Thus, a complete matching of task difficulty was impossible for the intended design and research question. Importantly, however, we restricted our fMRI analyses to correct trials only. For a full analysis of the behavioral data, we computed repeated-measures ANOVAs with the factors “direction” (same and different) and “position” (same and different), separately for each task on percent correct responses (Fig. 2A) and median reaction times (Fig. 2B). With regard to percent correct responses, both tasks reveal a main effect for the position. The attention-to-direction task furthermore shows a main effect for the direction. With regard to median reaction times, all main effects and the interactions were significant (Supplementary Table 1).
fMRI Data Acquisition
Blood oxygenation level-dependent (BOLD) fMRI was performed on a 3 T Siemens Allegra scanner (Siemens, Erlangen, Germany) equipped with a 4-channel head coil at the Brain Imaging Center, Frankfurt am Main, Germany.
Adaptation Experiment
A gradient-recalled echo-planar imaging sequence was used with the following parameters: Number of slices, 20; repetition time (TR), 1000 ms; echo time (TE), 25 ms; slice thickness, 4.5 mm; in-plane res-olution, 3.3 × 3.3 mm²; gap thickness, 0.45 mm. The slices were or-iented to reach a total coverage of the occipital and parietal lobes and usually most of frontal and temporal lobes. In case a full coverage of the brain was not achievable, the orbitofrontal cortex and anterior portions of the temporal lobes were not covered. Functional images were acquired in 6 experimental runs in a single session. Each run comprised the acquisition of 420 volumes. Stimulus presentation was synchronized with the fMRI sequence at the beginning of each run. Figure 2. Behavioral results. Bar plots show percent correct responses (A) and median reaction times (B) averaged across participants for the 4 experimental conditions and the 2 tasks separately.
Each scanning session included the acquisition of a high-resolution magnetization-prepared rapid-acquisition gradient echo sequence for coregistration and anatomical localization of functional data (TR, 2250 ms; TE, 4.38 ms; voxel size, 1 × 1 × 1 mm³).
Mapping Experiment
For the mapping experiment, slightly different sequence parameters were used: Number of slices, 40; TR, 2000 ms; TE, 25 ms, slice thick-ness, 3 mm; in-plane resolution, 3 × 3 mm²; gap thickthick-ness, 0.3 mm. With these parameters, we achieved whole-brain coverage.
fMRI Data Preprocessing
Data analysis and visualization was performed using the BrainVoya-ger QX software package (Version 1.10.3; Brain Innovation, Maas-tricht, The Netherlands). Wefirst evaluated raw fMRI data quality in terms of technical artifacts such as signal jumps. We detected signal jumps that were caused by a temporarily malfunctioning head coil in 4 runs (1 run from the position task and 3 runs from the direc-tion task; out of a total of 90 runs), and excluded these runs from further analyses. Thefirst 4 volumes of each event-related run were discarded to preclude T1-saturation effects. Preprocessing of the functional data included 1) 3D motion correction, 2) linear trend removal and temporal high-pass filtering at 0.01 Hz, and 3) slice scan-time correction with sinc interpolation. We also employed a spatial smoothing of 6 mm full-width at half-maximum. For each subject, the functional and structural 3D data sets were transformed into Talairach coordinate space (Talairach and Tournoux 1988). The recorded high-resolution anatomies of all subjects were used for surface reconstruction, which included gray/white-matter segmenta-tion based on intensity values. The cortical surfaces were slightly smoothed and inflated.
Our rapid event-related fMRI study used closely spaced trials, leading to a substantial overlap in the resulting hemodynamic responses. Nevertheless, under the assumption of linearity, the under-lying hemodynamic responses can be assessed by deconvolution (Dale and Buckner 1997). A deconvolution analysis estimates the he-modynamic response function for each trial on the basis of a general linear model (GLM). Twenty predictors were defined to cover the tem-poral extent of a typical hemodynamic response. Because of the he-modynamic lag in the BOLD response, differences between conditions (as well as the peak in overall response) are expected to occur at a lag of several seconds after stimulus onset (Boynton et al. 1996;Cohen 1997). On the basis of the deconvolved fMRI signal, we identified the peak points at lags 4 and 5 s after trial onset.
Mapping Experiment: Definition of Regions of Interest hMT+
We mapped hMT+ in each subject individually with a design contain-ing blocks of full-field stimulation with a coherent flowfield stimulus, an incoherentflowfield stimulus, a flickering stimulus, a static stimu-lus, and purefixation. During the mapping experiment, subjects were instructed to fixate thoroughly on the fixation cross, which was visible at all times at the center of the screen. No additional behavioral task was employed. We acquired one functional run lasting 9 min 4 s.
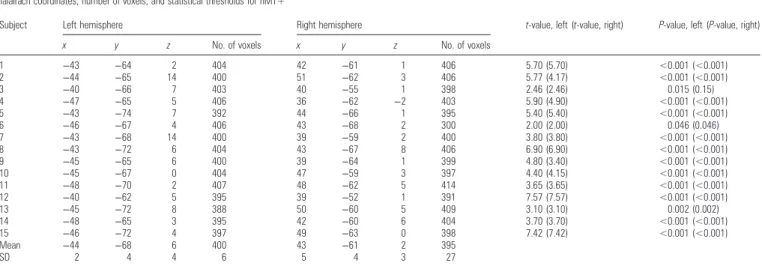
hMT+ was defined by contrasting the blocks with a coherent flow-field stimulus to blocks with a static stimulus. The known Talairach coordinates and anatomical landmarks were used as additional con-straints. Statistical thresholds were adjusted for each subject individu-ally to yield a size of the regions of interest (ROIs) of approximately 400 voxels (voxel size: 1 × 1 × 1 mm³) per hemisphere. Usually, thresholds were set at P < 0.001. In 3 subjects, thresholds had to be lowered to achieve sufficient voxel numbers (Subject 3: P = 0.015, Subject 6: P = 0.046, and Subject 13: P = 0.002). However, in Subject 6 even at this low threshold, the hMT+ ROI in the right hemisphere subtended only 300 voxels (instead of the intended 400). Table1 pro-vides an overview of t-/P-values for the individual thresholds as well as the number of voxels and Talairach coordinates for all hMT+ ROIs. Figure3A shows hMT+ ROIs of all subjects.
Visual Areas V1, V2, V3, hV4, and V3A/B
Mapping of retinotopic visual areas consisted of a polar-angle mapping as has been described in detail elsewhere (Muckli et al. 2006). In brief, we presented a black-and-white checkerboard pattern that consisted of a wedge-shaped disk segment subtending 22.5° of polar angle. The aspect ratio of the checks was kept constant by scaling their height linearly with eccentricity. The wedge started at the right horizontal meridian and slowly rotated clockwise for a full circle of 360° within 96 s. Subjects were instructed tofixate on the center. The mapping included 10 full cycles of the rotating wedge. One functional run lasted 13 min 16 s.
Cross-correlation analyses were performed and the resulting phase-encoded maps were projected onto the cortical hemispheres of the individual subjects. We manually drew borders between visual areas along vertical and horizontal meridians. Areas were shaded in light gray. The border definition of V1, V2, and V3 is currently not under debate. In the more disputed case of hV4 and V3A/B, we fol-lowed the criteria ofWandell et al. (2007). We were unsure about the border separating V3A from V3B, and sinceSmith and Wall (2008)
showed that direction-selective fMRI adaptation in areas V3A and V3B did not differ, we pooled both areas to one area complex V3A/B. We
Table 1
Talairach coordinates, number of voxels, and statistical thresholds for hMT+
Subject Left hemisphere Right hemisphere t-value, left (t-value, right) P-value, left (P-value, right)
x y z No. of voxels x y z No. of voxels
1 −43 −64 2 404 42 −61 1 406 5.70 (5.70) <0.001 (<0.001) 2 −44 −65 14 400 51 −62 3 406 5.77 (4.17) <0.001 (<0.001) 3 −40 −66 7 403 40 −55 1 398 2.46 (2.46) 0.015 (0.15) 4 −47 −65 5 406 36 −62 −2 403 5.90 (4.90) <0.001 (<0.001) 5 −43 −74 7 392 44 −66 1 395 5.40 (5.40) <0.001 (<0.001) 6 −46 −67 4 406 43 −68 2 300 2.00 (2.00) 0.046 (0.046) 7 −43 −68 14 400 39 −59 2 400 3.80 (3.80) <0.001 (<0.001) 8 −43 −72 6 404 43 −67 8 406 6.90 (6.90) <0.001 (<0.001) 9 −45 −65 6 400 39 −64 1 399 4.80 (3.40) <0.001 (<0.001) 10 −45 −67 0 404 47 −59 3 397 4.40 (4.15) <0.001 (<0.001) 11 −48 −70 2 407 48 −62 5 414 3.65 (3.65) <0.001 (<0.001) 12 −40 −62 5 395 39 −52 1 391 7.57 (7.57) <0.001 (<0.001) 13 −45 −72 8 388 50 −60 5 409 3.10 (3.10) 0.002 (0.002) 14 −48 −65 3 395 42 −60 6 404 3.70 (3.70) <0.001 (<0.001) 15 −46 −72 4 397 49 −63 0 398 7.42 (7.42) <0.001 (<0.001) Mean −44 −68 6 400 43 −61 2 395 SD 2 4 4 6 5 4 3 27
identified V1, V2, V3 (dorsal and ventral subparts), and V3A/B in 15 out of 15 subjects. hV4 was identified reliably in 11 out of 15 subjects. To render ROIs in visual areas V1, V2, V3, hV4, and V3A/B more precisely, we used an activation map based on the adaptation exper-iment in conjunction with the retinotopic map in each subject and hemisphere. We computed for each subject a GLM for the adaptation experiment across all experimental runs (and thus across behavioral tasks) and contrasted (at peak points 4 and 5 s after adaptor onset) all experimental conditions against the baseline to display a map of general activation in relation to the visual stimulation. We thresholded the activation map at P < 0.05 (Bonferroni corrected). We projected the activation map onto the reconstructed cortical surfaces, superim-posing the predefined retinotopic map (Fig.4A). ROIs were defined at the overlay of the activation map and the retinotopic map. We chose to place the ROIs in middle eccentricity, as this was the
eccentricity stimulated most reliably in all our participants. We did not have any a priori hypothesis regarding differences in fMRI adaptation effects depending on eccentricity and thus did not test other eccentri-cities. Furthermore, as can be seen from the whole-brain analysis (Supplementary Fig. 1), position-selective fMRI adaptation was indeed distributed across all eccentricities covered by our annulus stimulus. For each subregion (dorsal and ventral) of V1, V2, and V3 ROIs encompassed 200 voxels per hemisphere, and for areas hV4 and V3A/B 400 voxels to reach a size of 400 voxels on average per hemi-sphere of each and every ROI defined in this study (including hMT+, see above).
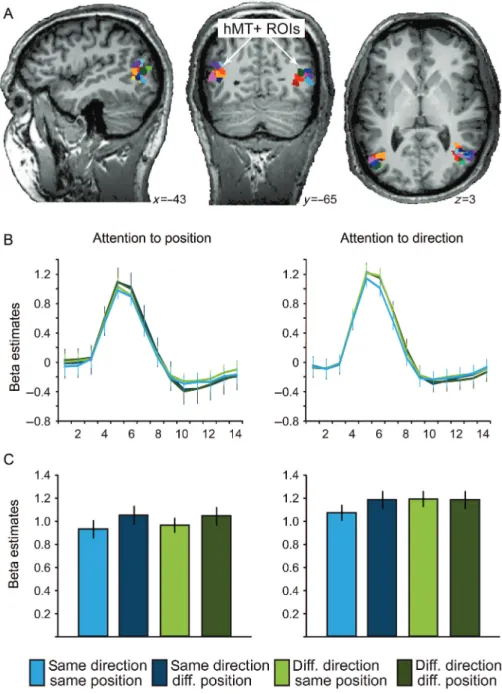
We compared the number of voxels for all ROIs (V1, V2, V3, hV4, and hMT+) and found that they did not differ between visual areas (repeated-measures ANOVA with single factor“visual area” at 6 levels [V1, V2, V3, hV4, V3A/B, and hMT+], F5,10= 1.812, P = 0.198). Figure 3. hMT+ results. (A) Individual hMT+ ROIs of 15 subjects (every color indicates a different subject) displayed on 3 anatomical slices of 1 representative subject. Coordinates indicate Talairach coordinates. (B) Beta estimates (event-related deconvolved BOLD-signal time course) from hMT+ ROIs averaged across trials and subjects for each of the 2 tasks. Time point 1 corresponds to stimulation onset. (C) Beta estimates (average of peak points 4 and 5 of the event-related deconvolved BOLD response) from hMT+ ROIs averaged across trials and subjects for each of the 2 tasks. Error bars indicate ± SEM across subjects; df = 14; diff., different.
Statistical Analysis
For the ROI analyses, we extracted the deconvolved time course aver-aged across runs, separately for the 2 tasks, of each subject from their individual ROIs. Per subject, we thus obtained for each ROI an esti-mate of the BOLD signal for each experimental condition at 20 time points (in steps of 1 s) following stimulation onset. The fully decon-volved time course of hMT+ averaged across subjects can be seen in Figure3B. Via visual inspection, we identified time points 4 and 5 as the peak points. For the statistical analyses, we focused only on the peak points. We averaged the 2 peak points per experimental con-dition and ROI and subject. We did notfind any differences between subregions (dorsal and ventral) nor hemispheres for any of the ROIs and thus averaged across subregions and hemispheres. We ended up with one beta weight per experimental condition and ROI and subject and used these data as input to our second-level statistics. Statistics were performed with SPSS (version 12.0.1, SPSS Inc., Chicago, IL, United States of America). We computed 2-way multivariate ANOVAs for the 2 tasks separately with factors “direction” (same, different) and“position” (same, different) for all ROIs (V1, V2, V3, hV4, V3A/B, and hMT+).
Results
We manipulated feature-based attention by instructing subjects
to perform 2 different behavioral tasks on the same stimulus
material. Brie
fly, our stimulus contained 8 random-dot
aper-tures with white dots on a black background (Fig.
1
A). Two
short movie sequences (
first the adaptor movie then the test
movie) of the dots within their apertures where shown,
separ-ated by a very short interval (Fig.
1
B). Different experimental
conditions were created by varying the test stimulus (Fig.
1
C):
The test could be a repetition of the adaptor in terms of the
motion direction of the dots and the position of the
random-dot apertures (same direction
–same position), or varied from
the adaptor either with respect to the position of the apertures
(same direction
–different position) or with respect to the
motion direction of the dots (different direction
–same position)
or with respect to both position of the apertures and motion
direction of the dots (different direction
–different position).
To manipulate feature-based attention, we had subjects
perform 2 different behavioral tasks: In half of the
experimen-tal runs, subjects were instructed to report whether the test
stimulus moved in the same direction as the adaptor stimulus
(attention-to-direction task), while in the other half of the
experimental runs, subjects had to report whether the
aper-tures of the test stimulus were at the same position as the
apertures of the adaptor stimulus (attention-to-position task).
fMRI Results
For the analyses of fMRI data, we only included correct trials.
The main focus of our study was the analysis of ROIs, hMT+
as well as early visual areas V1, V2, V3, hV4, and V3A/B.
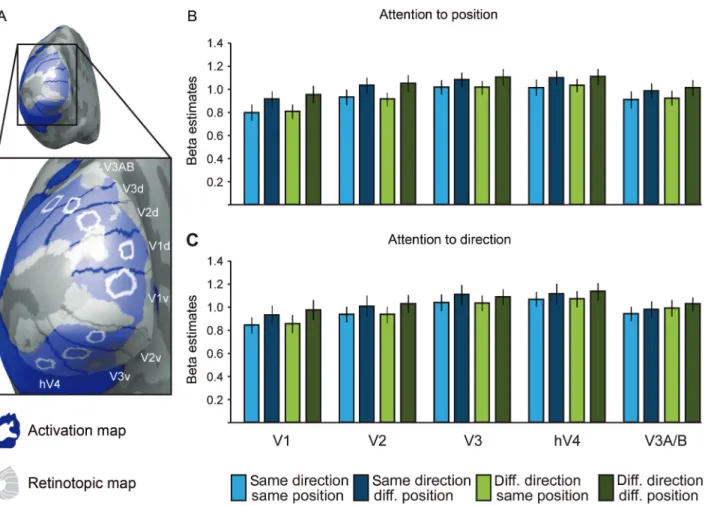
Figure 4. Results for visual areas V1, V2, V3, hV4, and V3A/B. (A) Full picture and close-up of a reconstructed and inflated left cortical hemisphere of one representative subject, viewed from the back (with a focus on the occipital pole). The individual retinotopic map derived from standard polar angle mapping procedures (shown in gray) and an individual activation map (shown in blue) are superimposed. White circles mark the defined ROIs. (B and C) Beta estimates (average of peak points 4 and 5 of the event-related deconvolved BOLD fMRI response) for the different ROIs in the visual cortex (V1, V2, V3, hV4, and V3A/B), separately for the attention-to-position task (B) and for the attention-to-direction task (C). Peak averages are averaged across trials and subjects. Error bars indicate ± SEM across subjects; df = 14; d, dorsal; diff., different; v, ventral.
hMT+
We de
fined hMT+ in each subject individually in both
hemi-spheres based on a separate localizer experiment (Fig.
3
A).
Table
1
provides the numbers of voxels for each ROI, as well
as Talairach coordinates and statistical thresholds at which
ROIs were de
fined (see the Materials and Methods section for
a more detailed description of the procedure). For the main
experiment, we then extracted fMRI signals from each
sub-ject
’s hMT+ and used them for second-level statistics. Because
we did not observe differences in response patterns between
left and right hMT+, we pooled data from the 2 hemispheres
and performed 2-factorial ANOVAs (
“position” [same,
differ-ent] ×
“direction” [same, different]) for the 2 tasks. In the
attention-to-position task, hMT+ displayed a signi
ficant
position-selective fMRI adaptation (Fig.
3
B and C; main effect
“position,” F
1,14= 10.45, P = 0.006,
η² = 0.43) and no other
effects (P > 0.37). In the attention-to-direction task, the main
effect for
“position” was preserved (F
1,14= 4.97, P = 0.04,
η² =
0.26), but most interestingly now there was also a main effect
for direction (F
1,14= 6.06, P = 0.03,
η² = 0.30) and the
inter-action
“position” × “direction” reached significance (F
1,14=
4.97, P < 0.05,
η² = 0.25). As can be seen in Figures
3
B and C,
these differences between tasks arise through a task-speci
fic
rebound from adaptation for the condition
“same position–
different direction
” compared with “same position–same
direction
” (attention-to-position task: t(14) = −1.02, P = 0.33;
attention-to-direction task: t(14) =
−3.33, P = 0.005).
Visual Areas V1, V2, V3, hV4, and V3A/B
We de
fined ROIs for visual areas V1, V2, V3, hV4, and V3A/B
for each subject based on individual retinotopic mapping and
activation maps (Fig.
4
A; see the Materials and Methods
section). Again, fMRI signals were extracted from these
regions from each subject and used for second-level testing.
In the attention-to-position task, all visual areas showed
position-selective fMRI adaptation (Fig.
4
B; main effect
“pos-ition
”, V1: F
1,14= 32.24, P < 0.001,
η² = 0.70; V2: F
1,14= 41.56,
P < 0.001,
η² = 0.75; V3: F
1,14= 29.37, P < 0.001,
η² = 0.68; hV4:
F
1,14= 17.69, P = 0.001,
η² = 0.56; V3A/B: F
1,14= 21.92, P <
0.001,
η² = 0.61) and no main effect for “direction” and no
interaction effect (P > 0.28). In the attention-to-direction task,
the main effect
“position” was weakened in all areas and
remained signi
ficant only for V1 and V2 (Fig.
4
C; main effect
“position”, V1: F
1,14= 13.68, P = 0.002,
η² = 0.49; V2: F
1,14=
5.18, P = 0.04,
η² = 0.27; other areas: P > 0.08). Again, no other
effects were signi
ficant (P > 0.18).
Overall Attention Effect
To assess the overall in
fluence of the task on the BOLD signal
level, we computed paired comparisons between tasks for the
condition
“same position–same direction”. This was to avoid
the in
fluence of differential adaptation effects in the other
conditions that might confound pure attentional effects on the
BOLD signal. Only for hMT+, we found a signi
ficant increase
in the peak response estimate of 14.9% in the
attention-to-direction task compared with the attention-to-position task
(t(14) = 2.27, P = 0.04). The responses in all other areas were
unaffected by task set (difference <5.5%, P > 0.28).
Whole-Brain Analyses
To assess the speci
ficity of our hypothesis-driven ROI-based
analyses, we performed complementary whole-brain analyses
(Supplementary Fig. 1). Supporting our ROI-based analyses,
task-speci
fic activations as reported in the section “Overall
at-tention effect
” were found mainly in hMT+. Furthermore,
position-speci
fic adaptation effects were widely distributed in
the visual cortex as expected since position-speci
fic adaptation
effects in a whole-brain analysis is another way of identifying
retinotopic areas. Analogous to our ROI analysis, position
speci
ficity was reduced in the attention-to-direction task in
comparison to the attention-to-position task. Direction-selective
adaptation effects were revealed in one region in the parietal
cortex anterior and ventral to V3A/B. Importantly, no
promi-nent regions were revealed showing a similar pro
file as the one
of hMT+ in our ROI-based analyses, suggesting that the
adap-tation pro
file of hMT+ in our task set is not likely driven by
top-down effects as, for example, shown in the ventral visual
pathway (
Ewbank et al. 2011
). This might be because of the
nature of our fast event-related adaptation paradigm with
inter-mixed experimental conditions.
Notes on Eye Movements
It is conceivable that the 2 tasks evoked different eye
move-ments, which would have in
fluenced our fMRI results. We
think this is unlikely for 3 reasons: 1) Even if the number of
eye movements or their duration would be different between
the 2 tasks, we would not expect such distinct response
pro-files for hMT+ in comparison to V1 or between the 2 tasks for
hMT+; 2) unstable
fixation would have resulted in a loss of
position-selective adaptation; and 3) the position of the
random-dot apertures was randomly set at the beginning of
each experimental trial as was the motion direction and
pos-ition change. Thus, it was impossible for the subjects to make
a predictive saccade. Other aspects of our stimulus further
aided
fixation: The presence of a fixation cross throughout
the complete run and the fact that in trials, in which the
pos-ition changed, these changes were set for each random-dot
aperture randomly to be either toward or away from the
fix-ation, thereby not creating a coherent motion percept.
Discussion
The present study investigated the modulation of fMRI
adap-tion effects in hMT+ by 2 attenadap-tion tasks focusing on different
aspects of the stimulus, direction, and position. Although in
both tasks attention was directed toward the stimulus, the
adaptation pro
file in hMT+ changed. Whereas position effects
were largely unaffected by the task, signal rebounds for
direc-tion changes were only detectable in the attendirec-tion-to-direcdirec-tion
task. This pattern was speci
fic to hMT+ when compared with
early visual areas. In addition, only in hMT+, the overall
signal level (magnitude of beta weights) was higher for the
attention-to-direction task relative to the attention-to-position
task, indicating a regionally selective gain increase.
The Impact of Feature-Based Attention on fMRI
Adaptation
A characteristic feature of our study is that we investigated the
in
fluence of feature-based attention not on fMRI responses
per se, but on fMRI adaptation effects, thereby revealing
modulations of population selectivity not described before. In
early visual areas, fMRI adaptation does not seem to be
strongly affected by feature-based attention:
Murray et al.
(2006)
investigated position-selective adaptation in V1, V2,
and V3, while subjects were either performing a same/different
task on the position of the stimulus or a change-in-luminance
detection task on the
fixation center. Position-selective
adap-tation effects did not differ between these 2 tasks. Furthermore,
adaptation effects in early visual areas are also not strongly
in
fluenced by attentional mechanisms in general: They can be
enhanced if the attentional focus is on the adapting feature (
Liu
et al. 2007
), but they can also be detected when attention is
drawn away from the adapting feature to the center of the
screen (
Larsson et al. 2006
;
Murray et al. 2006
).
fMRI adaptation in higher-level visual areas, however, is
strongly in
fluenced by attention. Spatial attention (
Eger et al.
2004
;
Murray and Wojciulik 2004
;
Henson and Mouchlianitis
2007
) and object-based attention (
Vuilleumier et al. 2005
;
Yi
and Chun 2005
;
Yi et al. 2006
) signi
ficantly enhance
adap-tation effects, and sometimes only attended objects seem to
elicit adaptation effects at all in higher-level areas (
Weigelt
et al. 2007
). Interestingly, however, as long as subjects
’
atten-tion is focused on the stimuli, the type of behavioral task
being performed on the objects (and thus the feature being
attended) does not seem to have a strong effect on adaptation
in higher-level visual areas.
Murray and Wojciulik (2004)
con-trasted a task in which subjects had to judge if the second
object was rotated to the left or the right in comparison to the
first object with a task in which they had to judge whether it
was the same or a different object. Both tasks evoked similar
rotation-selective adaptation effects in the lateral occipital
complex. Similarly, fMRI adaptation in the parahippocampal
place area occurred for very similar images in comparison to
different images, no matter if subjects judged if 2 images were
taken from the same overall scene or if the 2 images were
identical pixel-by-pixel (
Xu et al. 2007
).
In contrast to these previous studies, we did
find clear
changes in the adaptation pro
file of hMT+, although for both
tasks, the attention was directed toward the stimulus.
Focus-ing on the motion direction in contrast to the position reveals
a direction-selective rebound in the BOLD response in
addition to the position-selective adaptation effect. In other
words, direction-selective adaptation effects in hMT+ are
con-tingent on attention being focused on the motion direction
—a
novel
finding. It is unlikely that differences in spatial attention
between tasks alone provide an explanation for this pattern.
Although the BOLD signal was enhanced in hMT+ for the
attention-to-direction compared with the attention-to-position
task, a hallmark of spatial attention is a strong modulation of
all visual areas, especially with comparable effects in other
intermediate-level visual areas, like hV4 and V3A (
Tootell
et al. 1998
;
Kastner et al. 1998
;
Gandhi et al. 1999
;
Kastner
et al. 1999
;
Somers et al. 1999
), which was not the case in our
study.
The stronger activation in hMT+ for the attention-to-direction
task in comparison to the attention-to-position task is in line
with previous research, which has shown that the overall
activity level in hMT+ is higher when attention is directed
toward a feature that is more relevant to processing in hMT+,
such as speed, in contrast to a feature that is less relevant, such
as color (
Corbetta et al. 1990
,
1991
;
Beauchamp et al. 1997
;
Chawla et al. 1999
). However, such a scaling of responses is
not suf
ficient to explain the major change in adaptation profiles
between tasks. Whereas no signi
ficant response rebound could
be detected for direction changes in the attention-to-position
task, the direction-selective rebound reached ceiling in the
attention-to-direction task. A qualitatively similar effect has
been described in a study using multivoxel pattern analysis by
Peelen et al. (2009)
. They looked for category information
present in an object-selective region of the ventral visual
pathway. Subjects had to either report the presence of cars (
“car
task
”) or people (“body task”) in scenes. Multivariate pattern
information with regard to cars was present only during the car
task, and body information was present only during the body
task, independent of spatial attention. Our results suggest that
a similar effect occurs for fMRI adaption in hMT+. Only when
attention is focused on the motion direction, segregation of
neural populations representing orthogonal motion directions
leads to a direction-selective signal rebound. Our
findings thus
argue for a strong effect of attention on direction selectivity in
hMT+, at least as measured by fMRI adaptation.
However, our results also show that position-selective fMRI
adaptation effects are an exception to the rule that fMRI
adap-tation effects in higher-level visual areas are strongly affected
by attention. Position information was coded in most if not all
visual areas even if attention was diverted to another feature
of the stimulus lending further support to the notion that the
encoding of position information is one of the core
organiz-ational principles of most of the visual cortex, particularly
early visual areas and regions in the dorsal pathway.
Direction Selectivity in hMT+
By demonstrating direction-selective adaptation in hMT+, we
replicate several previous
findings (
Huk et al. 2001
;
Nishida
et al. 2003
;
Ashida et al. 2007
;
Smith and Wall 2008
). One
difference to these previous studies is that we used a classic
event-related adaptation paradigm that did not contain any
long adaptation periods, but only brief (300 ms) presentations
of stimuli and has been shown to primarily target adaptation
responses in extrastriate areas (
Weigelt et al. 2008
). It is
important to note that in our data, the direction-selective fMRI
adaptation in hMT+ cannot be easily explained by a mere
inheritance from V1. Neither V1 nor any other area receiving
direct input from V1 showed direction-selective fMRI
adap-tation in our study.
Position Selectivity in hMT+
As expected, we found strong adaptation to the retinotopic
position in areas V1, V2, V3, hV4, and V3A/B.
Murray et al.
(2006)
found similar position-selective adaptation in V1, V2,
and V3
—even for position shifts of only 0.5° visual angle.
These
findings are in line with the receptive-field sizes of
neurons in areas V1, V2, and V3, which are estimated to be
between 0.5 and 2° visual angle (
Yoshor et al. 2007
;
Dumou-lin and Wandell 2008
). Less position-selective adaptation in
hV4 and V3A/B can be explained based on their bigger
receptive-
field sizes (5° visual angle,
Yoshor et al. 2007
).
Interestingly, we also found strong position-selective
adap-tation in hMT+, despite its relatively large receptive-
field sizes
(
Dumoulin and Wandell 2008
;
Kolster et al. 2010
). Studying
motion-selective neuronal adaptation in monkey area MT,
Kohn and Movshon (2003)
found that adaptation to motion
did not transfer between 2 portions of the receptive
field of a
neuron in MT, thus making it likely that the position-selective
signal in MT re
flects only input from V1.
Priebe and Lisberger
(2002
) and
Priebe et al. (2002
), however, did investigate the
same question, but found the opposite result: Adaptation did
transfer between 2 portions of the receptive
field of a neuron
in MT. The discrepant results are likely caused by the use of
different adaptation approaches (
Kohn and Movshon 2003
:
Long-term adaptation;
Priebe and Lisberger 2002
and
Priebe
et al. 2002
: Short-term adaptation) that might target different
adaptation mechanisms (
Weigelt et al. 2008
). In our case, we
used a short-term design that is more similar to the one of
Priebe et al. Nevertheless, our effects are more in line with
the spatially very speci
fic effects of Kohn and Movshon.
In contrast to being merely inherited from an input region,
position information might also be computed in hMT+. Using
multivariate pattern analysis,
Fischer et al. (2010)
found
precise location information in hMT+. Compared with early
visual areas, the response pattern in hMT+ re
flected more the
perceived position and less the retinotopic coordinates,
suggesting an active process of location representation.
Fur-thermore, in behavioral experiments,
Wenderoth and Wiese
(2008)
found very high position selectivity for the direction
aftereffect, which is thought to stem from activity in hMT+.
The strong in
fluence of position information on processing
in hMT+ might suggest that hMT+ activity re
flects local rather
than global motion processing. Speci
fically, the adaptation
effects for the direction and position do not add up in the
direction task, saturating at the same level for the separate
position and direction effects as well as their combination.
In conclusion, while adaptation effects in early visual areas
are either only weakly or not at all modulated by the
behav-ioral task or attention in general, adaptation effects in
higher-level visual areas are sensitive to the current attentional focus.
With the present study, we demonstrate that this applies not
only to spatial, but also to feature-based attention.
Interest-ingly, this effect obtains only for motion direction, a feature
for which hMT+ is highly selective, and is not inherited from
areas earlier in the processing hierarchy.
Supplementary Material
Supplementary material can be found at: http://www.cercor. oxfordjournals.org/.
Funding
This work was supported by the Max Planck Society and the
Federal Ministry of Education and Research in Germany
(BMBF 01 GO 0508).
Notes
The authors would like to thank Britni Crocker and Tram Nguyen for help with data acquisition and analyses. We thank Christian Altmann, Christoph Bledowski, Oliver Doehrmann, and Benjamin Rahm for fruitful discussions on this project. Conflict of Interest: None declared.
References
Amano K, Wandell BA, Dumoulin SO. 2009. Visualfield maps, popu-lation receptivefield sizes, and visual field coverage in the human MT+ complex. J Neurophysiol. 102:2704–2718.
Ashida H, Lingnau A, Wall MB, Smith AT. 2007. FMRI adaptation reveals separate mechanisms for first-order and second-order motion. J Neurophysiol. 97:1319–1325.
Beauchamp MS, Cox RW, DeYoe EA. 1997. Graded effects of spatial and featural attention on human area MT and associated motion processing areas. J Neurophysiol. 78:516–520.
Boynton GM, Engel SA, Glover GH, Heeger DJ. 1996. Linear systems analysis of functional magnetic resonance imaging in human V1. J Neurosci. 16:4207–4221.
Brouwer GJ, van Ee R, Schwarzbach J. 2005. Activation in visual cortex correlates with the awareness of stereoscopic depth. J Neurosci. 25:10403–10413.
Chawla D, Rees G, Friston KJ. 1999. The physiological basis of atten-tional modulation in extrastriate visual areas. Nat Neurosci. 2:671–676.
Cohen MS. 1997. Parametric analysis of fMRI data using linear systems methods. Neuroimage. 6:93–103.
Corbetta M, Miezin FM, Dobmeyer S, Shulman GL, Petersen SE. 1990. Attentional modulation of neural processing of shape, color, and velocity in humans. Science. 248:1556–1559.
Corbetta M, Miezin FM, Dobmeyer S, Shulman GL, Petersen SE. 1991. Selective and divided attention during visual discriminations of shape, color, and speed: functional anatomy by positron emission tomography. J Neurosci. 11:2383–2402.
Culham JC, Dukelow SP, Vilis T, Hassard FA, Gati JS, Menon RS, Goodale MA. 1999. Recovery of fMRI activation in motion area MT following storage of the motion aftereffect. J Neurophysiol. 81:388–393.
Dale AM, Buckner RL. 1997. Selective averaging of rapidly presented individual trials using fMRI. Hum Brain Mapp. 5:329–340. Dumoulin SO, Wandell BA. 2008. Population receptivefield estimates
in human visual cortex. Neuroimage. 39:647–660.
Eger E, Henson RN, Driver J, Dolan RJ. 2004. BOLD repetition decreases in object-responsive ventral visual areas depend on spatial attention. J Neurophysiol. 92:1241–1247.
Ewbank MP, Lawson RP, Henson RN, Rowe JB, Passamonti L, Calder AJ. 2011. Changes in“top-down” connectivity underlie repetition suppression in the ventral visual pathway. J Neurosci. 31:5635–5642. Fischer J, Spotswood N, Whitney D. 2010. The emergence of per-ceived position in the visual system. J Cogn Neurosci. 23:119–136. Gandhi SP, Heeger DJ, Boynton GM. 1999. Spatial attention affects
brain activity in human primary visual cortex. Proc Natl Acad Sci USA. 96:3314–3319.
Gardner JL, Merriam EP, Movshon JA, Heeger DJ. 2008. Maps of visual space in human occipital cortex are retinotopic, not spatio-topic. J Neurosci. 28:3988–3999.
He S, Cohen ER, Hu X. 1998. Close correlation between activity in brain area MT/V5 and the perception of a visual motion aftereffect. Curr Biol. 8:1215–1218.
Henson RN, Mouchlianitis E. 2007. Effect of spatial attention on stimulus-specific haemodynamic repetition effects. Neuroimage. 35:1317–1329.
Huk AC, Dougherty RF, Heeger DJ. 2002. Retinotopy and functional subdivision of human areas MT and MST. J Neurosci. 22:7195–7205. Huk AC, Heeger DJ. 2000. Task-related modulation of visual cortex.
J Neurophysiol. 83:3525–36.
Huk AC, Ress D, Heeger DJ. 2001. Neuronal basis of the motion after-effect reconsidered. Neuron. 32:161–172.
Kamitani Y, Tong F. 2006. Decoding seen and attended motion direc-tions from activity in the human visual cortex. Curr Biol. 16:1096–1102.
Kastner S, De Weerd P, Desimone R, Ungerleider LG. 1998. Mechan-isms of directed attention in the human extrastriate cortex as revealed by functional MRI. Science. 282:108–111.
Kastner S, Pinsk MA, De Weerd P, Desimone R, Ungerleider LG. 1999. Increased activity in human visual cortex during directed attention in the absence of visual stimulation. Neuron. 22:751–761. Kohn A, Movshon JA. 2003. Neuronal adaptation to visual motion in
area MT of the macaque. Neuron. 39:681–691.
Kolster H, Peeters R, Orban GA. 2010. The retinotopic organization of the human middle temporal area MT/V5 and its cortical neighbors. J Neurosci. 30:9801–9820.
Larsson J, Landy MS, Heeger DJ. 2006. Orientation-selective adap-tation tofirst- and second-order patterns in human visual cortex. J Neurophysiol. 95:862–881.
Lee AH, Lee SH. 2012. Hierarchy of direction-tuned motion adaptation in human visual cortex. J Neurophysiol. 107:2163–2184.
Likova LT, Tyler CW. 2007. Stereomotion processing in the human occipital cortex. Neuroimage. 38:293–305.
Liu T, Fuller S, Carrasco M. 2007. Feature-based attention modulates orientation-selective responses in human visual cortex. Neuron. 55:313–323.
Maunsell JH, Treue S. 2006. Feature-based attention in visual cortex. Trends Neurosci. 29:317–322.
Muckli L, Kiess S, Tonhausen N, Singer W, Goebel R, Sireteanu R. 2006. Cerebral correlates of impaired grating perception in indi-vidual, psychophysically assessed human amblyopes. Vision Res. 46:506–526.
Murray SO, Olman CA, Kersten D. 2006. Spatially specific FMRI rep-etition effects in human visual cortex. J Neurophysiol. 95:2439–2445. Murray SO, Wojciulik E. 2004. Attention increases neural selectivity in
the human lateral occipital complex. Nat Neurosci. 7:70–74. Neri P, Bridge H, Heeger DJ. 2004. Stereoscopic processing of
absol-ute and relative disparity in human visual cortex. J Neurophysiol. 92:1880–1891.
Nishida S, Sasaki Y, Murakami I, Watanabe T, Tootell RB. 2003. Neu-roimaging of direction-selective mechanisms for second-order motion. J Neurophysiol. 90:3242–3254.
Peelen MV, Fei-Fei L, Kastner S. 2009. Neural mechanisms of rapid natural scene categorization in human visual cortex. Nature. 460:94–97.
Priebe NJ, Churchland MM, Lisberger SG. 2002. Constraints on the source of short-term motion adaptation in macaque area MT. I. the role of input and intrinsic mechanisms. J Neurophysiol. 88:354–369.
Priebe NJ, Lisberger SG. 2002. Constraints on the source of short-term motion adaptation in macaque area MT. II. Tuning of neural circuit mechanisms. J Neurophysiol. 88:370–382.
Rokers B, Cormack LK, Huk AC. 2009. Disparity- and velocity-based signals for three-dimensional motion perception in human MT+. Nat Neurosci. 12:1050–1055.
Saenz M, Buracas GT, Boynton GM. 2003. Global feature-based atten-tion for moatten-tion and color. Vision Res. 43:629–637.
Serences JT, Boynton GM. 2007. The representation of behavioral choice for motion in human visual cortex. J Neurosci. 27:12893–12899.
Smith AT, Wall MB. 2008. Sensitivity of human visual cortical areas to the stereoscopic depth of a moving stimulus. J Vis. 8:1.
Somers DC, Dale AM, Seiffert AE, Tootell RB. 1999. Functional MRI reveals spatially specific attentional modulation in human primary visual cortex. Proc Natl Acad Sci USA. 96:1663–1668.
Talairach J, Tournoux P. 1988. Co-planar stereotaxic atlas of the human brain, 3-dimensional proportional systems: an approach to cerebral imaging. New York: Thieme Medical Publishers.
Tootell RB, Hadjikhani N, Hall EK, Marret S, Vanduffel W, Vaughan JT, Dale AM. 1998. The retinotopy of visual spatial attention. Neuron. 21:1409–1422.
Tootell RB, Reppas JB, Dale AM, Look RB, Sereno MI, Malach R, Brady TJ, Rosen BR. 1995. Visual motion aftereffect in human cor-tical area MT revealed by functional magnetic resonance imaging. Nature. 375:139–141.
Tootell RB, Reppas JB, Kwong KK, Malach R, Born RT, Brady TJ, Rosen BR, Belliveau JW. 1995. Functional analysis of human MT and related visual cortical areas using magnetic resonance imaging. J Neurosci. 15:3215–3230.
Treue S, Martinez-Trujillo JC. 1999. Feature-based attention influences motion processing gain in macaque visual cortex. Nature. 399: 575–579.
Vuilleumier P, Schwartz S, Duhoux S, Dolan RJ, Driver J. 2005. Selec-tive attention modulates neural substrates of repetition priming and “implicit” visual memory: Suppression and enhancements revealed by FMRI. J Cogn Neurosci. 17:1245–1260.
Wandell BA, Dumoulin SO, Brewer AA. 2007. Visual field maps in human cortex. Neuron. 56:366–383.
Watson JD, Myers R, Frackowiak RS, Hajnal JV, Woods RP, Mazziotta JC, Shipp S, Zeki S. 1993. Area V5 of the human brain: Evidence from a combined study using positron emis-sion tomography and magnetic resonance imaging. Cereb Cortex. 3:79–94.
Weigelt S, Kourtzi Z, Kohler A, Singer W, Muckli L. 2007. The cortical representation of objects rotating in depth. J Neurosci. 27:3864– 3874.
Weigelt S, Muckli L, Kohler A. 2008. Functional magnetic resonance adaptation in visual neuroscience. Rev Neurosci. 19:363–380. Wenderoth P, Wiese M. 2008. Retinotopic encoding of the direction
aftereffect. Vision Res. 48:1949–1954.
Xu Y, Turk-Brown NB, Chun MM. 2007. Dissociating task perform-ance from fMRI repetition attenuation in ventral visual cortex. J Neurosci. 27:5981–5985.
Yi DJ, Chun MM. 2005. Attentional modulation of learning-related repetition attenuation effects in human parahippocampal cortex. J Neurosci. 25:3593–3600.
Yi DJ, Kelley TA, Marois R, Chun MM. 2006. Attentional modulation of repetition attenuation is anatomically dissociable for scenes and faces. Brain Res. 1080:53–62.
Yoshor D, Bosking WH, Ghose GM, Maunsell JH. 2007. Receptive fields in human visual cortex mapped with surface electrodes. Cereb Cortex. 17:2293–2302.
Zeki S, Watson JD, Lueck CJ, Friston KJ, Kennard C, Frackowiak RS. 1991. A direct demonstration of functional specialization in human visual cortex. J Neurosci. 11:641–649.