CASE STUDY
A spatially explicit life cycle inventory of the global
textile chain
Julia K. Steinberger&Damien Friot&Olivier Jolliet& Suren Erkman
Received: 19 June 2008 / Accepted: 29 March 2009 / Published online: 13 May 2009 # Springer-Verlag 2009
Abstract
Background, aim, and scope Life cycle analyses (LCA) approaches require adaptation to reflect the increasing delocalization of production to emerging countries. This work addresses this challenge by establishing a country-level, spatially explicit life cycle inventory (LCI). This study comprises three separate dimensions. The first dimension is spatial: processes and emissions are allocated to the country in which they take place and modeled to take into account local factors. Emerging economies China and India are the location of produc-tion, the consumption occurs in Germany, an Organisation for
Economic Cooperation and Development country. The second dimension is the product level: we consider two distinct textile garments, a cotton T-shirt and a polyester jacket, in order to highlight potential differences in the production and use phases. The third dimension is the inventory composition: we track CO2, SO2, NOx, and
particulates, four major atmospheric pollutants, as well as energy use. This third dimension enriches the analysis of the spatial differentiation (first dimension) and distinct products (second dimension).
Materials and methods We describe the textile production and use processes and define a functional unit for a garment. We then model important processes using a hierarchy of preferential data sources. We place special emphasis on the modeling of the principal local energy processes: electricity and transport in emerging countries. Results The spatially explicit inventory is disaggregated by country of location of the emissions and analyzed according to the dimensions of the study: location, product, and pollutant. The inventory shows striking differences between the two products considered as well as between the different pollutants considered. For the T-shirt, over 70% of the energy use and CO2emissions
occur in the consuming country, whereas for the jacket, more than 70% occur in the producing country. This reversal of proportions is due to differences in the use phase of the garments. For SO2, in contrast, over two
thirds of the emissions occur in the country of production for both T-shirt and jacket. The difference in emission patterns between CO2 and SO2 is due to local electricity
processes, justifying our emphasis on local energy infrastructure.
Discussion The complexity of considering differences in location, product, and pollutant is rewarded by a much richer understanding of a global production–consumption
Electronic supplementary material The online version of this article (doi:10.1007/s11367-009-0078-4) contains supplementary material, which is available to authorized users.
J. K. Steinberger
:
S. ErkmanIPTEH, Faculty of Geosciences and Environment, University of Lausanne,
Amphipôle, UNIL-Sorge, CH-1015 Lausanne, Switzerland D. Friot
Laboratory of Applied Economics, University of Geneva, Uni-Mail, 40 Boulevard du Pont d’Arve,
1211 Geneva 4, Switzerland O. Jolliet
Environmental Health Sciences, School of Public Health, University of Michigan,
109 South Observatory, Ann Arbor, MI 48109, USA J. K. Steinberger (*)
Institute of Social Ecology, Faculty for Interdisciplinary Studies, University of Klagenfurt,
Schottenfeldgasse 29, 1070 Vienna, Austria e-mail: [email protected]
chain. The inclusion of two different products in the LCI highlights the importance of the definition of a product's functional unit in the analysis and implications of results. Several use-phase scenarios demonstrate the importance of consumer behavior over equipment efficiency. The spatial emission patterns of the different pollutants allow us to understand the role of various energy infrastructure ele-ments. The emission patterns furthermore inform the debate on the Environmental Kuznets Curve, which applies only to pollutants which can be easily filtered and does not take into account the effects of production displacement. We also discuss the appropriateness and limitations of applying the LCA methodology in a global context, especially in developing countries.
Conclusions Our spatial LCI method yields important insights in the quantity and pattern of emissions due to different product life cycle stages, dependent on the local technology, emphasizing the importance of consumer behavior. From a life cycle perspective, consumer education promoting air-drying and cool washing is more important than efficient appliances.
Recommendations and perspectives Spatial LCI with country-specific data is a promising method, necessary for the challenges of globalized production–consumption chains. We recommend inventory reporting of final energy forms, such as electricity, and modular LCA databases, which would allow the easy modification of underlying energy infrastructure.
Keywords Atmospheric emissions . Carbon dioxide . China . Electricity . Energy . Environmental Kuznets Curve . India . Infrastructure . Nitrogen oxides . Particulates . Spatial LCI . Sulfur dioxide . Textile . Transport
1 Introduction
Life Cycle Analysis (LCA) of a product can serve as a guide to decision-making, identifying key processes and environmentally preferable alternatives. A full-product life cycle allows the answer to the question: should the environmental focus be on the production phase (cleaner production) or at the consumption phase (cleaner consump-tion)? In this work, we create a life cycle inventory (LCI) of the globalized textile chain, disaggregated along three separate dimensions: (1) spatially explicit at the country level, (2) applied to two distinct products, and (3) encompassing four major atmospheric pollutants and energy use. The three dimensions inform and enrich the analysis, enabling us to address the issues of cleaner production and consumption from different perspectives, with different answers depending on the product and the pollutant considered.
1.1 The textile sector in global trade
LCA approaches require adaptation to reflect the increasing delocalization of manufacturing in emerging countries. This work addresses this need by establishing a spatially explicit LCI. Our goal is to analyze the spatial pattern of pollutant emissions and illustrate the potential displacement of pollution in a globalized economy. For our case study, we choose the production and use of two representative products of the globalized textile industry: a cotton T-shirt from India and a polyester jacket from China, both consumed in Germany. The producing countries are representative of the global textile production chains, which have been expanding and changing in composition, moving to developing and emerging countries on the textile production and processing side, as well as shifting from natural to synthetic fibers (Baffes2004). Although previous life cycle analyses of textile products have been performed (Jödicke 2001; Pulli 1997), they often do not take into account the global nature of the production–consumption chain or the entirety of the production–consumption processes (Dahllöf2004)
1.2 The Tracking Environmental Impacts of Consumption project
This work is part of the“Tracking Environmental Impacts of Consumption” (TREI-C) research project (www.trei-c.org). The goal of TREI-C is the development of tools to assess the environmental impacts of globalized production and con-sumption through one detailed product life cycle assessment and more encompassing Multi-Region Input-Output model-ing. A third component maps the location of emissions and impacts depending on global transfers of atmospheric pollutants and appropriate local impact factors.
Within the TREI-C project, the textile case study serves to highlight the complexity of following a production consump-tion chain in detail, compared to the more aggregate and comprehensive Input–Output approach. It also serves as the basis for calculations of spatially explicit country-level impact factors along a production–consumption chain. Indeed, human health impact factors are higher in China and India, due to higher population densities than in Europe or the USA, so the same quantity of emissions will have more important health consequences. This is to be added to the health vulnerability resulting from lack of public health infrastructure.
In accordance with the ultimate goals of the TREI-C project—the quantification of trade exchanges of embodied pollutants and their parallel atmospheric transport—the LCI focuses on atmospheric emissions of four common pollu-tants (CO2, SO2, NOx, particulates). These pollutants are of
is the primary contributor to anthropogenic global warming, NOxand SO2are acidifying and have already been targeted
through environmental policies in Europe and the USA, and particulates cause or aggravate respiratory diseases. They are also chosen because of their data availability and because they are emitted in conjunction with fossil energy use, which arises in most industrial processes, as opposed to other pollutants, whose emission inventories are lacking or related to very specific industrial processes. Despite the inventory focus on specific atmospheric emissions, sources of aquatic pollution are also surveyed.
In the frame of this project, the present paper specifically aims to:
– Develop a hierarchical strategy for establishing the life cycle inventory of products from developing countries – Model processes and allocate emissions in a spatially
explicit manner, at the country level
– Determine the respective share of emissions and energy needs for two types of garments produced in develop-ing countries and consumed in developed countries – Discuss the appropriateness and limitations of applying
the LCA methodology in a global context, especially in developing countries
The structure of this article relates to the spatial, product, and pollutant dimensions of the study. First, the system boundaries and functional unit for two products are
described (Section3). The data gathering strategy and the inventory data sources are outlined in Section4. The spatial inventory results are then analyzed, and their implications are discussed in Section 5, including the particularities of different types of pollutants, use-phase scenarios, and the challenge of linking inventory and impacts in this LCI. Section 5summarizes our conclusions, along with sugges-tions for building modular LCIs to accommodate global production–consumption processes.
2 System boundaries and functional unit description This LCI is composed of two distinct product chains: a cotton T-shirt produced in India and a polyester jacket manufactured in China, both consumed in Germany. The treatment of the two is not strictly parallel, since the cotton chain in India is much better characterized than the polyester in China.
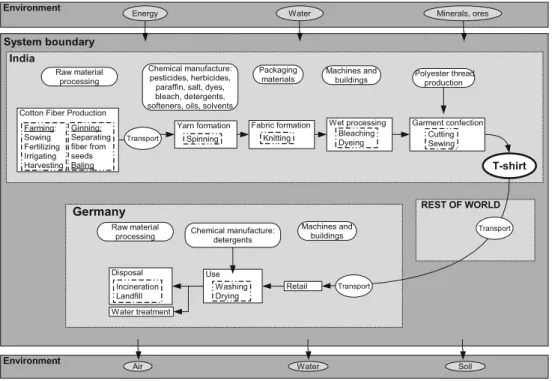
The processes considered in the cotton chain are the following (Fig. 1): (1) agriculture, including direct and indirect energy inputs, irrigation, commercial fertilizers, and pesticides, ginning (separation of seed and fiber); (2) textile processes, including spinning, knitting, bleaching, dyeing, apparel confection, with packaging, direct and indirect energy use, chemicals, and water use; (3) transport stages in India, Germany, and intercontinental; (4) retail in
Fig. 1 System boundary and processes considered for the cotton T-shirt production–consumption chain. The system is divided into three boxes: India (producing country), Germany (consuming country), and
Rest of World. The differences with the polyester jacket chain are explained in the text
Germany; (5) use phase, washing, and drying, taking into account electricity, detergent manufacturing, and water treatment; (6) disposal through landfill and incineration.
The processes considered in the polyester chain are the following: (1) resin production, including the production of base ingredients; (2) textile processes, spinning, knitting, apparel confection, considering only direct and indirect energy use, without chemicals, packaging, or water use; (3) transport in China, Germany, and intercontinental. The retail, use, and disposal processes are the same as those for the cotton chain although adapted to the polyester product. The functional unit is “100 days of a garment being worn,” with 100 days, or once a week for 2 years, or every 2 days for two seasons, estimated to be a reasonable life-time for a garment. Although the functional unit is the same for both jacket and T-shirt, the secondary functions are very different, and no comparative assertion can be issued between these two products. However, contrasting the life cycle emissions of these products is highly interesting since there are significant differences in the use phase: the T-shirt is estimated to be washed once every two wearings, 50 times total during its lifetime, and the jacket washed three times a season or six times during its lifetime.
If a garment has a lifetime longer than 100 days, the relative contribution of the use phase to the total environmen-tal impacts increases; however, the environmenenvironmen-tal burden per day of a garment being worn decreases, since the production and disposal contributions are distributed over a larger number of days. Conversely, a garment which is worn a few times, then almost immediately discarded, will have a much lower environmental impact from its use phase, although its impact per day of being worn will be much larger.
3 Data basis of the spatially explicit life cycle inventory 3.1 Method
This in-depth life cycle inventory including processes in both developed and developing countries is based on publicly available data sources, with a specific emphasis on gathering and adapting representative data for emerging countries. In industrialized countries, significant efforts have been made to compile and update inventories for product and process life cycle analysis: in Switzerland EcoInvent (Frischknecht and Rebitzer 2005); in Germany, Gemis (Fritsche and Schmidt2007) or GaBi (GaBi 2008); Environmental Input–Output for the USA (Suh 2003), Denmark (Weidema et al.2005), and others (Curran et al.
2006). This work, however, remains to be performed for emerging/developing countries where data availability is a basic problem for establishing LCIs. As a consequence, the United Nations Environment Programme-Society of
Envi-ronmental Toxicology and Chemistry Life Cycle Initiative has highlighted capacity building for LCA in developing countries as a work area for its second phase in 2007–2010. The ongoing EU 6th framework project Exiopol (2008) will contribute international Input-Output data for many pollu-tants and economic sectors.
In some cases, the use of the existing life cycle databases for industrialized countries may be applied to emerging/ developing countries with little risk of error. However, the potential of large differences even in fairly standard industrial processes should not be underestimated (Berrah et al.2007). In our study, we systematically prioritize local data. We find large differences between industrialized country processes and emerging country ones and thus demonstrate the need for detailed local data, especially for, but not limited to, energy infrastructure.
In this research, we use a combination of approaches to create life cycle inventories for agricultural and industrial processes in India and China. We use data following a preference hierarchy of three broad categories. The first category consists of detailed local data, from our industry partner Switcher, publicly available sources, either LCA or other approaches. This is fortunately the case for most of the Indian and European data, as well as most energy processes. The second category is detailed process data, adapted to regional infrastructure. This is the case for the Chinese polyester part of the study, where we use Indian data if no Chinese data is available, and European or USA studies otherwise. The last category is an existing LCA database: EcoInvent (Frischknecht and Rebitzer 2005), when no detailed process data exists. This is the case for specialty and basic chemical manufacturing, as well as infrastructure (buildings and machines). For these, we adapt standard LCA processes to account for the local electricity production.
We also choose our data sources to be as close to the year 2000 as possible, although some exceptions are inevitable. 3.2 Summary of the inventory data
The inventory focuses on four common atmospheric pollutants: carbon dioxide (CO2), nitrogen oxides (NOx),
particulates (PMs), and sulfur dioxide (SO2) as well as
primary nonrenewable energy. The particulate diameter is not specified in many of our sources, so no size information is available, and all PM emissions are reported as total PM. Since the full details of the inventory are lengthy, the following is a bullet-point summary of the full inventory data basis, which is completed in the Electronic supple-mentary material. The only stage described in full here is the electricity modeling for China and India. Some of our most important references appear only in the Electronic
supplementary material but can be found in the full
1. Cotton Agriculture in India: is surprisingly energy-intensive, due to decentralized and poorly regulated groundwater irrigation. Primary energy per cotton yield is even higher than in the USA. This argues against using a standard “developing country” cotton process as done in Wiegmann (2002).
2. Textile manufacture in India: we use a combination of regional material flow analysis (Erkman and Ramaswamy
2003) and an industry energy study (Lehmann Poll-heimer 2006). The most energy-intensive process is dyeing, which uses wood-based heat. The CO2emissions
and energy from the wood do not appear in our inventory, since they are considered to be from renewable biomass; however, the NOx emissions are included.
Power from diesel generators is included, necessary because of frequent power outages in India.
3. Textile manufacture in China: due to lack of local data, we rely principally on a USA polyester study (Franklin
1993), resulting in high uncertainty for this phase, since the Chinese energy use may be much higher (Berrah et al.2007).
4. Electricity emissions in China and India: both Chinese and Indian electricity comes predominantly from coal-fired thermal power plants: 78% and 69%, respectively (IEA 2004). They are also over 99% self-sufficient in electricity production. The emissions from the coal-based electricity of India and China are thus the focus of our inventory efforts, and the results are summarized in Table1.
The CO2emissions for India are determined from the
Central Electricity Authority (CEA) database for the Kyoto Clean Development Mechanism (CEA 2007). The Chinese CO2 emissions are estimated from a
combination of the China Energy Databook (Sinton et al.2004), International Energy Agency (IEA) data (IEA
2007) and the Carbon Dioxide Information Analysis Center (Marland et al.2007).
The China Energy Databook (Sinton et al. 2004) provides Chinese SO2and particulate emissions for the
entire electric sector but no information on NOx
emissions. For Chinese NOx, we use the Indian value.
Indian NOx, particulate, and SO2emissions are found in
Mittal and Sharma (2004) and Mittal (2006). These are overall consistent with the EcoInvent process emissions for Polish coal electric production, which we adapt to account for the differences in CO2emissions.
Data on transmission and distribution losses are available from China (Sinton et al. 2004) but include losses due to theft for India (TERI 2006). From an LCA perspective, stolen electricity is not lost. The Chinese 8% transmission and distribution loss to light industry is thus used for both India and China. 5. Transport stages: the transport stages include national
and international freight, as well as international person-nel transport. Consumer transport to and from the retail location is excluded, as it may be on the same order of magnitude as the entire production–consumption chain (Browne et al.2005).
6. Freight in India: the long distances of truck freight transport in India warrant a dedicated process model. This is based on the Euro 0 emissions standard (a conservative estimate). The loading factor for India is almost the double (Reddy et al. 2000) of what is typically used in European LCAs. The results are shown in Table1.
7. Retail in Germany: this process is taken from Environ-mentally Extended Input–Output analysis, with the difficulty of the determination of the appropriate monetary amount to apply to the emission factors. In fact, we keep this component separate from the total of all other emissions, due to its large estimated error margin.
8. Use phase in Germany: the use phase is explored in some detail, including detergent composition, water treatment, number of washings and dryings, loading factor, temperature of washing, and efficiency rating of equipment. Due to its importance, various use-phase scenarios are analyzed in the discussion.
9. Disposal in landfill and incineration: a disposal phase combining standard landfill and incineration processes is given; no recycling is considered. The CO2emissions
from the cotton are considered to be renewable and are not included in the total, in contrast to the fossil polyester emissions.
Emissions from energy China India Germany Heat India transport
1kWh 1kWh 1kWh 1MJ 1 ton-km Coal fraction (%) 78 69 51 Fossil fraction (%) 84 82 63 Carbon dioxide (kg) 0.87 0.88 0.62 0.090 0.31 NOx(kg) 0.0055 0.0036 0.0006 0.00014 0.0048 PM (kg) 0.0027 0.0020 0.0007 0.00006 0.0004 SO2(kg) 0.0060 0.0057 0.0005 0.00047 0.0003 Table 1 Emissions of CO2,
NOx, particulates, and SO2for
key energy processes in China, India, and Germany
4 Results, implications and scenarios 4.1 Spatial LCI results
Our results confirm the need for using spatially explicit data at the national level, for any process which requires energy. For example, the surprisingly energy-intensive Indian cotton cultivation cannot be modeled assuming either US or Chinese cultivation processes. Local data are especially important for the electricity-related emissions shown in Table1. In this case, the inclusion of a variety of pollutants in the LCI is enlightening. Indeed, simply substituting European electricity processes into the Chinese and Indian mixes would not change the CO2 emissions much but
would result in massive underestimates of NOx(a factor 4
to 6), particulates (a factor of 2 to 3), and SO2(a factor of
8 to 9).
The overall results for the four atmospheric pollutants, as well as nonrenewable primary energy, are summarized in Table2for a cotton T-shirt weighing 0.25 kg and in Table3
a polyester jacket weighing 0.5 kg, weights purposefully chosen for easy scaling. The country of location of the emissions is indicated in each case. The emissions due to international transport occur in the Rest of World compart-ment. The percentage of emissions in the producing and consuming countries, as well as internationally, is also given. The origin of electricity is the most crucial factor
driving the atmospheric emissions in this study. Despite the global nature of the chain, transportation is much less significant, accounting for 4% of CO2emissions and 14%
for NOx(due to local transport in India for the T-shirt).
Nonrenewable primary energy consists of fossil fuels and nuclear energy. The only process stage where renew-able primary energy plays a significant role is the cotton dyeing, where 72% of the total primary energy is from wood.
The uncertainties given with the data stage in the
Electronic supplementary material correspond to primary energy and CO2and are assumed to be larger for the other
pollutants. The aggregate uncertainties are calculated assuming the error is normally distributed (except for production in China, where it is more likely to be systematic).
4.2 Production or consumption? Insights from studying two garments
A cotton T-shirt and a polyester jacket cannot be compared as substitutable products but are both representative of the general apparel product category. Contrasting their lifecycle emissions showcases the variable importance of the use phase. The T-shirt requires 50% more nonrenewable primary energy than the jacket, despite being half its weight; however, the T-shirt only emits 30% more CO2
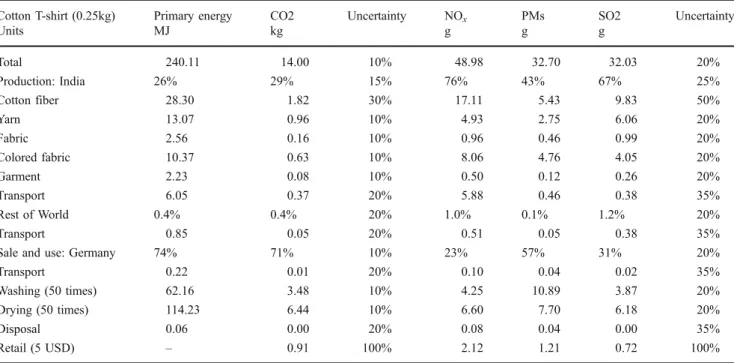
Table 2 Spatial, non-renewable primary energy and emissions of CO2, NOx, total particulates, and SO2for 100 days of garment use for T-shirt
Cotton T-shirt (0.25kg) Primary energy CO2 Uncertainty NOx PMs SO2 Uncertainty
Units MJ kg g g g Total 240.11 14.00 10% 48.98 32.70 32.03 20% Production: India 26% 29% 15% 76% 43% 67% 25% Cotton fiber 28.30 1.82 30% 17.11 5.43 9.83 50% Yarn 13.07 0.96 10% 4.93 2.75 6.06 20% Fabric 2.56 0.16 10% 0.96 0.46 0.99 20% Colored fabric 10.37 0.63 10% 8.06 4.76 4.05 20% Garment 2.23 0.08 10% 0.50 0.12 0.26 20% Transport 6.05 0.37 20% 5.88 0.46 0.38 35% Rest of World 0.4% 0.4% 20% 1.0% 0.1% 1.2% 20% Transport 0.85 0.05 20% 0.51 0.05 0.38 35%
Sale and use: Germany 74% 71% 10% 23% 57% 31% 20%
Transport 0.22 0.01 20% 0.10 0.04 0.02 35%
Washing (50 times) 62.16 3.48 10% 4.25 10.89 3.87 20%
Drying (50 times) 114.23 6.44 10% 6.60 7.70 6.18 20%
Disposal 0.06 0.00 20% 0.08 0.04 0.00 35%
Retail (5 USD) – 0.91 100% 2.12 1.21 0.72 100%
Data are shown separately for each process stage and summed up for each location, showing distinction between the behavior of energy and CO2,
on the one hand, and NOx, particulates, and SO2on the other. The retail stage is kept separate from the total, as explained in the text. The
uncertainties for the location totals and total emissions are estimated assuming normal distributions, except for the Chinese polyester production, where we expect the error to be systematic
than the jacket. On the whole, the total lifecycle emissions for the T-shirt and the jacket are on the same order of magnitude, with the cotton T-shirt emissions 30% higher than for the polyester jacket, except for SO2, where the
proportion is reversed.
This similarity in emission quantities ends as soon as the contributions of each location of emission and product stages are examined. For the T-shirt, roughly two thirds of the CO2and particulate emissions occur in the consuming
country, with that proportion reversed for NOxand SO2. In
the case of the jacket, all the pollutants have the vast majority (70–90%) of their emissions in the producing country. In the case of the T-shirt, reducing the lifecycle energy use and CO2emissions is best addressed by a focus
on the consumption phase, but for the jacket, the production phase is the most crucial.
The striking difference in the location of energy use and CO2emissions—over two thirds in the consuming country
for the T-shirt, less than one third for the jacket—are due to differences in their use phase: the T-shirt is washed and dried 50 times, compared to six times for the jacket. This can be clearly seen in Fig. 2. The importance of the use phase in apparel for CO2 emissions is widely known;
however, as our results make clear, it should not be taken as universal for all apparel types. Indeed, because of the usual underestimate of the emissions of cotton agriculture and processing stages, the proportion is often assumed to be much higher than two thirds. Moreover, this proportion is not true of all pollutant types, as reversed proportions for NOxand SO2demonstrate, shown for SO2in Fig.3.
For both the T-shirt and the jacket, NOx and SO2
emissions are larger in the production country than the share of energy use would warrant, by a factor of more than 4. Fossil fuel combustion accounts for the majority of the
NOxemissions for cotton, the totality for polyester, and all
the SO2emissions. The higher proportion in the production
country is thus due to the lack of emission standards and filtration implementation. The nonfossil NOx emissions of
cotton have several origins. NOx is emitted in the
agricultural process, through the production and use of N fertilizers, at the level of 10% of the total. It is also emitted in the cotton dyeing process because of the large quantity of wood burned to produce heat. Since the wood is considered to be renewable biomass, the biogenic CO2emissions from
the wood combustion are not included in our inventory; however, the corresponding NOx emissions contribute to
almost 10% of the total. To address life cycle NOxand SO2
emissions, the production phase is the most important for both products.
The particulate emissions are also predominantly due to electricity use but also have contributions from material production phases: steel and concrete (used for machinery and buildings) and laundry detergent. These non-energy contributions cause the higher-than-expected emissions in the consumption phase. Moreover, the difference in emission factors between Germany, China, and India is smaller for particulates (factor of 3–4) than for NOxor SO2
(factors of 6–12) as can be seen in Table1. 4.3 Use-phase scenarios
Because of the importance of the use phase for energy and CO2for the T-shirt product and the availability of use-phase
alternatives, we present four scenarios showing the relative impact of (1) machine and air drying, (2) washing temperature choice, and (3) machine efficiency rating. The results are shown in Fig. 2 and Table 4. These scenarios allow us to define hierarchies of consumer behavior
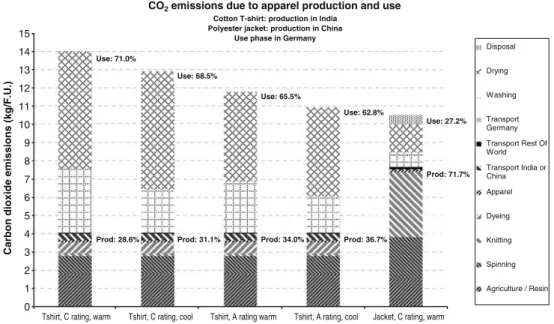
CO2 emissions due to apparel production and use
Cotton T-shirt: production in India Polyester jacket: production in China
Use phase in Germany
0 1 2 3 4 5 6 7 8 9 10 11 12 13 14 15
Tshirt, C rating, warm Tshirt, C rating, cool Tshirt, A rating warm Tshirt, A rating, cool Jacket, C rating, warm
Carbon dioxide emissions (kg/F.U.)
Disposal Drying Washing Transport Germany Transport Rest Of World Transport India or China Apparel Dyeing Knitting Spinning Agriculture / Resin Use: 71.0% Use: 68.5% Use: 65.5% Use: 62.8% Use: 27.2%
Prod: 28.6% Prod: 31.1% Prod: 34.0% Prod: 36.7%
Prod: 71.7%
Fig. 2 Carbon dioxide emissions per 100 days of garment use for the cotton T-shirt (considering different use scenarios) and for the polyester jacket. The relative impacts of use phase are clear: air vs. machine drying is the most important, followed by the tem-perature of washing, with the machine efficiency rating coming last. A similar plot for energy is in the article'sElectronic
choices, an approach encouraged in sustainable consump-tion (Kaenzig and Jolliet2006; Bilharz et al.2008).
The most important choice a consumer can make is that of machine or air drying (reductions of more than 60% in the use-phase emissions with air drying), followed by temperature of washing (30% reduction of the washing phase emissions at 40°C compared to 60°C), with appliance
efficiency rating being the least important (20% reduction with A rating appliances compared to C rating, other parameters held constant). In this case, the use-phase behavior of the consumer is much more important than the appliance chosen for the use phase: by switching to air drying and cooler washing, the total lifecycle product emissions are halved.
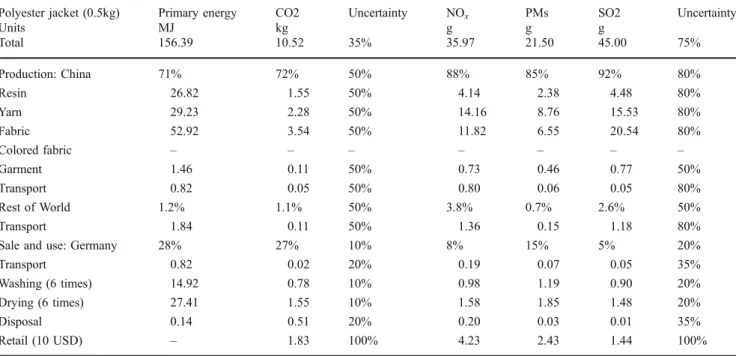
Table 3 Spatial, non-renewable primary energy and emissions of CO2, NOx, total particulates and SO2for 100 days of garment use for
polyester jacket
Polyester jacket (0.5kg) Primary energy CO2 Uncertainty NOx PMs SO2 Uncertainty
Units MJ kg g g g Total 156.39 10.52 35% 35.97 21.50 45.00 75% Production: China 71% 72% 50% 88% 85% 92% 80% Resin 26.82 1.55 50% 4.14 2.38 4.48 80% Yarn 29.23 2.28 50% 14.16 8.76 15.53 80% Fabric 52.92 3.54 50% 11.82 6.55 20.54 80% Colored fabric – – – – – – – Garment 1.46 0.11 50% 0.73 0.46 0.77 50% Transport 0.82 0.05 50% 0.80 0.06 0.05 80% Rest of World 1.2% 1.1% 50% 3.8% 0.7% 2.6% 50% Transport 1.84 0.11 50% 1.36 0.15 1.18 80%
Sale and use: Germany 28% 27% 10% 8% 15% 5% 20%
Transport 0.82 0.02 20% 0.19 0.07 0.05 35%
Washing (6 times) 14.92 0.78 10% 0.98 1.19 0.90 20%
Drying (6 times) 27.41 1.55 10% 1.58 1.85 1.48 20%
Disposal 0.14 0.51 20% 0.20 0.03 0.01 35%
Retail (10 USD) – 1.83 100% 4.23 2.43 1.44 100%
Data are shown separately for each process stage and summed up for each location, showing distinction between the behavior of energy and CO2,
on the one hand, and NOx, particulates, and SO2on the other. The retail stage is kept separate from the total, as explained in the text. The
uncertainties for the location totals and total emissions are estimated assuming normal distributions, except for the Chinese polyester production, where we expect the error to be systematic
SO2 emissions due to apparel production and use
Cotton T-shirt: production in India Polyester jacket: production in China
Use phase in Germany
0 5 10 15 20 25 30 35 40 45 50
Tshirt, C rating, warm Tshirt, C rating, cool Tshirt, A rating warm Tshirt, A rating, cool Jacket, C rating, warm
Sulfur dioxide emissions (g/F.U.)
Disposal Drying Washing Transport Germany Transport Rest Of World Transport India or China Apparel Dyeing Knitting Spinning Agriculture / Resin Use: 31.5% Use: 29.2% Use: 26.8% Use: 24.8% Use: 5.4%
Prod: 67.3% Prod: 69.5 rod: 71.9% Prod: 73.9%
Prod: 92.0%
Fig. 3 Sulfur dioxide emissions per 100 days of garment use for the cotton T-shirt (considering different use scenarios) and for the polyester jacket. Note the difference in the production-use distribution of the T-shirt and jacket
This result also highlights the importance of developing detergents which are effective at lower temperatures. Another consideration is the necessity of frequent wash-ings. If a garment requires fewer washings (for example, through resistance to stains or sweat), the use-phase impacts will be correspondingly lowered.
In contrast, the SO2emissions are much less affected by
changes in the use phase, as can be seen in Fig. 3, since 67% and 92% are emitted in the production phase for the T-shirt and jacket, respectively.
4.4 Evidences for Kuznets and non-Kuznets emissions The CO2 emissions in Tables 2 and3 are proportional to
energy use, mostly electricity. Since fossils represent 80% of technical primary energy worldwide, the CO2–energy
proportionality is the rule rather than the exception. CO2
thus indicates the location of the largest energy use. In the absence of carbon capture technology, CO2 is found and
emitted in comparable quantities per megajoule, in all fossil-fuel energy-intensive processes, no matter where they are located.
In contrast, the emission of NOx, particulates, and SO2,
although also mostly due to fossil fuel combustion, is not proportional to the energy use, since it can be mitigated by filtration technology. The energy and emissions required by the filtration are included in the inventory. In the following discussion, we focus on CO2, NOx, and SO2, leaving aside
particulates, since their larger contribution from material production complicates their behavior.
The reduction in NOx and SO2emissions in Germany
is due to the existence of effective filtration technologies and the implementation of environmental policies limiting acidifying emissions. Indeed, a similar study done in the early 1980s, before these policies were implemented, would show the NOx and SO2 fractions to be closely
aligned with CO2. The reduction of NOx and SO2
emissions in many developed countries is put forward as an example of the Environmental Kuznets Curve (EKC) conjecture: where environmental impacts first rise with economic growth but eventually decrease as increased
prosperity allows the environment to become a higher priority and generates the revenue necessary for impact mitigation (Dinda2004; Stern2004).
The EKC is widely acknowledged to be a limited phenomenon, applying to a small subset of impacts: those with (1) local, immediate effects and/or (2) convenient technological means of abatement or substitution (De Bruyn et al. 1998). Acidifying emissions NOx and SO2
fulfill both these conditions; ozone depleting emissions fulfill the second. CO2 emissions fulfill neither condition:
they have global and deferred impacts, and no convenient carbon-capture technology exists to date.
In our spatial LCI, we find evidence for both EKC (NOx
and SO2) and non-EKC (CO2) emission behavior in the
context of a global production–consumption chain. The EKC emissions are relatively smaller in the higher-income consuming country; the non-EKC emissions are high in both the high-income consuming country and the lower-income producing country (see Figures SM-2 and SM-3 in the Electronic supplementary material for CO2 and SO2,
respectively). The difference between EKC and non-EKC emissions is clear in our data, despite the evidence that developing and emerging countries may be adopting some abatement technologies faster than expected, given their income level (Dasgupta et al.2002).
Our results provide support for an interpretation of the EKC as a displacement of local environmental impacts, rather than global reduction. The reduction in NOxand SO2
emissions in Germany happened as large sectors of European industry (including textile) moved overseas. The lifecycle profile of these products benefits from the environmental abatement policies only during the use phase—the production phase may have worse impacts than before its displacement, depending on the conditions in the new country of production. The total product lifecycle emissions may not be absolutely reduced.
4.5 Linking impacts and inventories in the textile industry Major caveats apply to our LCI for both water-borne pollution and specialty chemicals. Severe water pollution is
Table 4 Details of the cotton T-shirt use-phase scenarios shown in Fig.2, along with the use-phase CO2emissions of each
Scenario Function Weight
(kg) Appliance rating Washing temperature (°C) Number of washings and dryings CO2emissions: washing and drying (kg) CO2emissions: washing only (kg) A T-shirt 0.25 C 60 50 9.9 3.5 B T-shirt 0.25 C 40 50 8.8 2.4 C T-shirt 0.25 A 60 50 7.7 2.8 D T-shirt 0.25 A 40 50 6.9 2.0
A five-fold difference exists between the most energy-intensive scenario (machine drying, warm washing, inefficient machines) and the most energy sparing (air drying, cool washing, efficient machine)
a consequence of the production and use of textile products: at the production stage, dye-laden effluents require treatment (lacking in India and in China); at the consumption stage, eutrophication results from discharge of laundry detergent.
The textile industry uses many specialty chemicals. Pesticides are massively used in cotton cultivation, and reactive dyes are used for dyeing. The exact quantities and formulations are not publicly available, but the resulting severe health damage is documented (Mancini et al.2005; CSA and MARI2005; Bhalli et al.2006; Prithiviraj2002; Govindarajalu2003; Michaels 1988). Previous LCA work has attempted to understand the production phase of such specialty chemicals (Geisler et al.2004; Dahllöf and Steen
2005) and their fate in a river system (Beck et al.2000) but unfortunately does not address the topic of fate and impact when these chemicals are massively discharged into the environment with no or little dilution. So far, the most comprehensive effort at modeling pesticide impacts through a product LCA was done on bananas in Costa Rica (Humbert et al. 2007). This work relies on detailed data, in the absence of which a life cycle approach cannot be expected to produce reliable health and ecosystem results.
In India and China, workplace safety is much lower than in Europe or the USA. Worker exposure to dangerous chemicals and emissions is thus much more prevalent. The dyes used in the cotton industry are often azo dyes, which are currently regulated and tested for in the EU, as they emit harmful and even cancer-causing chemicals during the use phase (European Parliament and EC2002; Robins and Humphrey2000). Indeed, many dyes banned in Europe are now manufactured in India and are present in imported textiles. The health impact of these chemicals on the textile and chemical workers must be even more severe than on the European consumer. Another health effect within the cotton workplace is byssinosis (Mishra et al.2003; Laraqui et al.2002), a respiratory disease due to exposure to cotton fibers. An LCA assessing damage beyond the factory walls or outside the crop field will thus miss significant human health impacts. In these cases, health studies of affected populations are necessary to complement the LCA findings. Salt is used in the reactive dyeing of cotton textile. Despite some efforts at salt recovery, large quantities are discharged in the wastewater: 20,000 tons per year (Erkman and Ramaswamy 2003). This has led to the salinization of local drinking and agricultural water (Kurian 2005) with health and ecosystem impacts. However, salinization is not a traditional impact category of LCA, despite being a severe problem in many emerging/developing countries. The volume of water used for textile is an environmental concern of its own. One of the largest scale environmental disasters, the drying up of Aral Sea, is a direct result of cotton irrigation in Central Asia. However, for such an impact to be brought to light
by an LCA, the water usage of a process must be related to the local hydrological cycle (including factors such as downstream water uses).
5 Conclusion and recommendations
In this article, we presented a spatial LCI, based on local process data whenever available, for the global production– consumption chains of two textile products. Our conclu-sions are presented along the three dimenconclu-sions of our LCI: spatial, product, and pollutant. Finally, the lessons from this study regarding cleaner production or consumption are summarized.
5.1 Recommendations for local, modular process-based LCI databases
For energy-intensive processes, this work demonstrates that the use of local and detailed data is necessary to assess the environmental impact of the production and consumption phases of a product. However, existing LCI databases are not designed to allow the easy modification of underlying energy infrastructures, since they focus on primary energy carriers. To remedy this design flaw, we recommend that inventories report intermediate energy flows (electricity, heat and transportation) as well as primary energy flows. Then the underlying energy infrastructure can be modeled separately and adapted for different countries and condi-tions. This is necessary for the applicability of LCA approaches to globally produced goods. Even when the result wanted is a global average product, the range of local production technologies is necessary to understand how meaningful this global average is.
Another challenge for a spatial LCI is the disaggregation of emissions by their location. For a given product, some components may be produced in country A, have a processing step in country B, with final consumption in country C, and disposal in country D. In order for the analysis to follow this complexity, the end result should be expressed not only as total emissions but as emissions in each location (as we have done in Tables2and3). This is a significant book-keeping challenge for LCI databases and their modeling software, but this is a necessary step for the subsequent pollutant transport and impact analysis stages. This is especially true since human health impact factors are strongly dependent on population density, which is much higher in China and India than in Europe or the USA. 5.2 Conclusions from studying different products
Our results showcase the importance of the choice of product, T-shirt or jacket, even for the same functional unit
defined as “100 days of wearing a garment.” The production/consumption insights gained for one product and one pollutant (say CO2and a T-shirt) cannot be applied
more generally (to a jacket or SO2, for instance). The
biggest difference between the two products demonstrates the relative importance of the use phase, since the jacket requires fewer washings and dryings than the T-shirt. Moreover, the use phase itself is highly variable, depending on user behavior and equipment choices. From our use-phase scenarios, we find the hierarchy of user choice impacts to be the following: (1) air vs. machine drying, (2) temperature of washing, (3) equipment efficiency.
5.3 Conclusions from accounting for different pollutants In our inventory of four pollutants, CO2is approximately
proportional to fossil fuel combustion (with differences between coal, oil, and natural gas), particulates have mixed fossil fuel and material contributions, and NOx
and SO2are caused by, but not proportional to, total fossil
fuel combustion. NOx and SO2follow the Environmental
Kuznets Curve (EKC): their emissions tend to decrease with higher income in a country. We can thus classify these pollutants non-EKC (CO2) and EKC (NOxand SO2).
The displacement of manufacturing to developing countries may result in higher emissions of the EKC pollutants than if the manufacturing had remained in the industrialized country.
This analysis demonstrates the power of spatial LCA for global environmental analysis. If the LCI could be extended over time (at decadal intervals for example, taking into account technological change and trade flow modifica-tions), it could serve as a tool to assess the environmental impact of globalization from a product or functional unit perspective.
For many of the pollutants involved in the textile product chain, a full LCA is extremely challenging, due to the lack of impact information for many specialty chemicals: pesticides, dyes, detergent ingredients. Even the impact of salt used in the cotton dyeing process is not included in traditional LCA impact categories. This is a major research need for the increasing number of goods involving a globalized life cycle.
5.4 Cleaner production or cleaner consumption?
What are the most important conclusions from this work regarding cleaner production and cleaner consumption?
For the T-shirt, the predominance of the use phase for energy and CO2 emphasizes cleaner consumption, with
equipment efficiency coming last in the hierarchy of consumer choices and air vs. machine drying and washing temperature coming first. In this case, consumer behavior
is more important than equipment rating in terms of energy use, a result with interesting implications for energy policy and the rebound effect. The rebound effect occurs when energy savings following efficiency measures are not as large as expected or even negative (Hertwich
2005; Herring and Roy 2007). Our use-phase scenarios show that an emphasis on equipment efficiency may lead to a rebound effect in cases where the consumer behavior is more important than the efficiency rating. Once in possession of an A-rated appliance, the consumer may switch to more frequent or wasteful use (for example using warmer washing temperatures) in the mistaken belief that the equipment is so efficient that the energy use will in any case be lower than with a B- or C-rated appliance. Environmentally conscious appliance and ap-parel companies should therefore include consumer edu-cation as part of their efforts, emphasizing air-drying and cool washing.
Textile firms, of course, exert more control on the production phase of their garments. In a cleaner production perspective, the two priorities are a clean (or cleaner) electricity supply and water treatment. The electricity issue can be addressed by financing renewable technologies (Switcher, for example, funds wind electricity in India) but also by supporting regulatory improvements of the existing electricity production. Regarding water, textile firms can influence the scale of water use, the use of pesticides and harmful dyes and salt, and especially implement water treatment.
However, the question of cleaner consumption or cleaner production of one functional unit corresponding to a product evades the more important question of scale of consumption. As Schor (2005) points out, dropping textile prices have led to larger quantities consumed and consequently higher environmental burdens. Tackling the emission of non-EKC pollutants like CO2 requires the
scale of global consumption to be reduced, at least as long as electricity is produced using fossil fuels.
Acknowledgments This work is part of the TREI-C project, partly funded by a grant from the Geneva International Academic Network (GIAN). The Swiss apparel company Switcher was a participant; we thank them for their collaboration. It benefited from student projects by César Lador and Priti Nigam and the masters thesis of Ana Rita Carvalho of the EPFL (Switzerland). We also thank Dr. Isabelle Blanc (Armines), Dr. Manuele Margni (École Polytechnique de Montréal), Shanna Shaked (University of Michigan), and Vincent Rossi (Ecointesys - Life Cycle Systems) for helpful discussions. The manuscript was significantly improved by the comments of anonymous reviewers. Any remaining errors are the responsibility of the authors. Ramesh Ramaswamy (Resource Optimization Initiative), who recently passed away, was always ready with cheerful advice and criticism. He is sorely missed.
References
Aizenshtein EM (2006) World production and consumption of polyester fibres and thread. Fibre Chem 38:3
Baffes J (2004) Cotton: market setting, trade policies, and issues. World Bank Policy Research Working Paper 3218
Beck A, Scheringer M, Hungerbühler K (2000) Fate modelling within LCA: the case of textile chemicals. Int J LCA 5(6):335–344 Berrah N, Feng F, Priddle R (2007) Sustainable energy in China: the
closing window of opportunity. The International Bank for Reconstruction and Development/The World Bank
Bhalli JA, Khan QM, Nasim A (2006) DNA damage in Pakistani pesticide-manufacturing workers assayed using the Comet assay. Environ Mol Mutagen 47(8):587–593
Bilharz M, Lorek S, Schmitt K (2008) “Key points” of sustainable consumption. Geer Ken, Theo, Tukker, Arnold, Vezzoli, Carlo, and Ceschin, Fabrizio. Proceedings of Sessions I-II of the 2nd Conference of the Sustainable Consumption Research Exchange (SCORE!) Network, March 10-11, Brussels, Belgium, pp 287–306 Boustead I (1997) Ecoprofiles of selected manmade fibers. CIRFS Browne M, Rizet C, Anderson S, Allen J, Basile K (2005) Life cycle
assessment in the supply chain: a review and case study. Transp Rev 25(6):761–782
CEA (2007) CO2 baseline database for the Indian power sector, user guide, version 3.0. New Dehli, Government of India, Ministry of Power, Central Electricity Authority
Chapagain AK, Hoekstra AY, Savenije HHG,Gautam R (2005) The water footprint of cotton consumption. Value of Water Research Report Series No.18. Delft, The Netherlands, UNESCO-IHE Institute for Water Education
CSA, MARI (2005) Killing and poisoning pests or human beings? Acute poisoning of pesticide users through pesticide exposure/ inhalation. Centre for Sustainable Agriculture & MARI, Secunderabad, India
Curran MA, Notten P, Chayer JA,Cicas G (2006) Summary of global life cycle inventory data resources. SETAC/UNEP Life Cycle Initiative, pp 1–34
Dahllöf L (2004) LCA methodology issues for textile products. Göteborg, Sweden, Chalmers University of Technology, Licentiate of engineering thesis, Environmental Systems Analysis
Dahllöf L, Steen B (2005) A statistical approach for estimation of process flow data from production of chemicals of fossil origin. International Journal of LCA online-first, 1-6
Dasgupta S, Laplante B, Wang H, Wheeler D (2002) Confronting the Environmental Kuznets Curve. J Econ Perspect 16(1):147–168 De Bruyn SM, van den Bergh JCJM, Opschoor JB (1998) Economic
growth and emissions: reconsidering the empirical basis of Environmental Kuznets Curves. Ecol Econ 25(2):161–176 Dinda S (2004) Environmental Kuznets Curve hypothesis: a survey.
Ecol Econ 49:431–455
Doka G (2007) Email: post waste-water treatment emissions EPA (1997) Profile of the textile industry (EPA/310-R-97–009).
Environmental Protection Agency, Washington, DC
Erkman S, Ramaswamy R (2003) Case study of the textile industry in tirupur (chapter 5) applied industrial ecology - a new platform for planning sustainable societies (focus on developing countries with case studies from India). Aicra Publishers, Bengalore, India, pp 44–70 European Parliament, EC (2002) DIRECTIVE 2002/61/EC OF THE EUROPEAN PARLIAMENT AND OF THE COUNCIL of 19 July 2002 amending for the nineteenth time Council Directive 76/769/EEC relating to restrictions on the marketing and use of certain dangerous substances and preparations (azocolourants) Exiopol (2008) Exiopol: a new environmental accounting framework
using externality data and input-output tools for policy analysis.
http://www.feem-project.net/exiopol/
FAO (2007) AQUASTAT: India country profile http://www.fao.org/
AG/AGL/aglw/aquastat/main/index.stm. Food and Agriculture
Organization of the United Nations
Franklin (1993) Resource and environmental profile analysis of a manufactured apparel product life cycle analysis (LCA): Wom-an's Knit Polyester Blouse. Franklin Associates
Friot D, Antille Gaillard G (2007) Tracking environmental impacts of consumption: an economic-ecological model linking OECD and developing countries. 16th International Input-Output Confer-ence, 2–7 July 2007, Istanbul, Turkey
Frischknecht R, Rebitzer G (2005) The ecoinvent database system: a comprehensive web-based LCA database. J Clean Prod 13:1337– 1343
Fritsche UR, Schmidt K (2007) Global emission model for integrated systems (GEMIS) version 4.4 Manual. 1-166, Oeko-Institut GaBi (2008) GaBi - life cycle assessment software system
www.gabi-software.com.http://www.gabi-software.com/
Geisler G, Hofstetter TB, Hungerbühler K (2004) LCA methodology with case study production of fine and speciality chemicals: procedure for the estimation of LCIs. Int J LCA 9(2):101–113 Govindarajalu K (2003) Industrial effluent and health status - a case
study of Noyyal river basin. In: Bunch MJ, Suresh VM, Kumaran TV (eds) Proceedings of the Third International Conference on Environment and Health, Chennai, India, 15-17 December, 2003, 150-157 Department of Geography, University of Madras and Faculty of Environmental Studies, York University
Herring H, Roy R (2007) Technological innovation, energy efficient design and the rebound effect. Technovation 27:194–203 Hertwich EG (2005) Consumption and the rebound effect: an
industrial ecology perspective. J Ind Ecol 9:1–2 Special Issue on Consumption and Industrial Ecology, 85–98
Humbert S, Margni M, Charles R, Torres Salazar OM, Quiros AL, Jolliet O (2007) Toxicity assessment of the main pesticides used in Costa Rica. Agric Ecosyst Environ 118:183–190
IEA (2004) International Energy Agency online country statistics
http://www.iea.org/textbase/stats/index.asp
IEA (2007) Energy balances of non-OECD Countries, 2004-2005– 2007 Edition. CD-ROM, International Energy Agency (IEA), Organisa-tion of Economic Co-OperaOrganisa-tion and Development (OECD) IFA, IFDC, IPI, PPI, FAO (2002) Fertilizer use by crop, 5th edn. IFA
-International Fertilizer Industry Association
Jödicke A (2001) Moeglickeiten und Grenzen der Oekobilanz bei Chemikalienintensiven Prozessen: Veredlung und Grebrauch eines Baumwoll-T-Shirts. Eidgenoessischen Technischen Hoch-schule Zuerich (ETHZ), Zuerich, Switzerland
Kaenzig J, Jolliet O (2006) Consommation respectueuse de l'environ-nement. Federal Office of the Environment, Bern, Switzerland, pp 1–113
Kurian J (2005) A cleaner production approach for minimisation of total dissolved solids in reactive dyeing effluents. UNIDO UNEP. UNIDO UNEP Guidance and Training Manuals on CPCs -Sectors– Textiles, pp 1–10
Laraqui CH, Rahhali A, Laraqui O, Tripodi D, Curtes JP, Verger C, Caubet A (2002) Byssinosis and occupational asthma among cotton dust-exposed workers. Rev Fr Allergol Immunol Clin 42 (2):133–141
Laursen ES, Hansen J, Bagh J, Jensen OK,Werther I (1997) Environmental assessment of textiles: life cycle screening of textiles containing cotton, wool, viscose, polyester or acrylic fibres. Project no. 369. Copenhagen, Denmark, Danish Environ-mental Protection Agency
Lehmann Pollheimer D (2006) Switcher climate project: CO2-neutral T-shirt (Report preliminary study, draft version). Basel, ecos Mancini F, Van Bruggen AHC, Jiggins JLS, Ambatipudi AC, Murphy H
(2005) Acute pesticide poisoning among female and male cotton growers in India. Int J Occup Environ Health 11(3):221–232
Marland G, Boden TA, Andres RJ (2007) Global, regional, and national CO2 emissions trends: a compendium of data on global change. Carbon Dioxide Information Analysis Center (CDIAC), Oak Ridge National Laboratory, U.S. Department of Energy, Oak Ridge, Tenn., USA
Michaels D (1988) Waiting for the body count: corporate decision making and bladder cancer in the U.S. Dye Industry. Medical Anthropology Quarterly, New Series, 2, 3 (Health and Industry), 215–232 Mishra AK, Rotti SB, Sahai A, Madanmohan NKA (2003) Byssinosis
among male textile workers in Pondicherry: a case-control study. Natl Med J India 16(2):70–73
Mittal ML (2006) Anthropogenic emissions from energy activities in India: generation and source characterizationhttp://www.osc.edu/
research/pcrm/emissions/index.shtml. Ohio Supercomputer Center
(OSC), Program for Computational Reactive Mechanics (PCRM) Mittal ML, Sharma C (2004) Anthropogenic emissions from energy
activities in India: generation and source characterization—part I emissions from thermal power generation in India. Ohio Supercomputer Center (OSC), Columbus, Ohio, USA
Morand C (2005) Inde: bilan catastrophique pour les OGM. Le Temps Mueller O (2006) Cotton production in US life-cycle inventory
database athttp://www.nrel.gov/lci/database/
NEF (2007) Calculating the benefit of energy efficient washing machines. National Energy Foundation, UK
Nemecek T, Heil A, Huguenin O, Meier S, Erzinger S, Blaser S, Dux D, Zimmermann A (2004) Life cycle inventories of agricultural production systems. Final report ecoinvent 2000 No. 15. Duebendorf, Switzerland, Swiss Centre for Life Cycle Inventories Parashar DC, Kulshrestha UC, Sharma C (1998) Anthropogenic emissions of NOX, NH3 and N2O in India. Nutr Cycl Agro-ecosyst 52(2–3):255–259
PMFAI (2006) Statistics - spraying schedulehttp://www.pmfai.org/
spraying_schedule.htm. Pesticides Manufacturers & Formulators
Association of India
Prithiviraj R M (2002): Dirty Shirts a study of health, safety and environmental concerns in the context of the garment industry in Tirupur region, India. The Netherlands, Goede Waar & Co. Pulli R (1997) Ökobilanz eines Baumwoll-T-Shirts mit Schwerpunkt
auf den verwendeten Chemikalien. Diplomarbeit an der ETH Zürich, Abteilung für Umweltnaturwissenschaften
Ramanathan R (2000) A holistic approach to compare energy effiencies of different transport modes. Energy Policy 28:743–747
Ramaswamy R, Naik G, Gouda P, Patil J, Gowda L (2006) Industrial ecology & agro-industrial policy: study of agro-industrial systems, Karnataka, India. Resource Optimization Initiative (ROI), Bengalore, India, pp 1–107
Reddy AKN, Anand YP, D'Sa A (2000) Energy for a sustainable road/ rail transport system in India. Energy Sustain Dev IV(1):29 Robins N, Humphrey L (2000) Sustaining the rag trade. International
Institute for Environment and Development (iied)
Saouter E, van Hoof G (2002) A database for the life-cycle assessment of procter & gamble laundry detergents. Int J LCA 7(2):103–114
Schor JB (2005) Prices and quantities: unsustainable consumption and the global economy. Ecol Econ 55(3):309–320
SFOE (2006) L'étiquetteEnergie pour les sèche-linge (tumbler). Swiss Federal Office of Energy, Switzerland
Shah T, Giordano M, Wang J (2004) Irrigation institutions in a dynamic economy—what is China doing differently from India? Econ Polit Wkly 39:3452–3461
Sidler O, Waide P,Lebot B (2000) An experimental investigation of cooking, refrigeration and drying end-uses in 100 households. Presented at the summer study on energy efficiency in buildings for the American Council for an Energy-Efficient Economy (ACEEE) meeting
Singh S, Singh S, Pannu CJS, Singh J (2000) Optimization of energy input for raising cotton crop in Punjab. Energy Convers Manag 41:1851–1861
Singh H, Mishra D, Nahar NM, Ranjan M (2003) Energy use pattern in production agriculture of a typical village in arid zone, India: part II. Energy Convers Manag 44:1053–1067
Sinton J, Fridley D, Jieming L, Lewis J, Nan Z,Yanxia C (2004) China energy databook version 6.0, http://china.lbl.gov. LBNL-55349 Berkeley, USA, Lawrence Berkeley National Laboratory
Spielmann M, Kägi T, Tietje O (2004) Life cycle inventories of agricultural production systems. Final report ecoinvent 2000 No. 14. Duebendorf, Switzerland, Swiss Centre for Life Cycle Inventories
Statistisches Bundesamt (2003) Umweltökonomische Gesamtrechnun-gen: Material- und EnergieflußrechnunGesamtrechnun-gen: Teil 3 Kohlendioxid; Teil 5 Schwefeldioxid, Stickoxide, Versauerungsgase. D-Statis: Fachserie 19, Reihe 5
Statistisches Bundesamt (2004) Volkswirtschafliche Gesamtrechnun-gen: Input-Output-Rechnung nach 71 Gütergruppen/Produktions-bereichen 2000. D-Statis
Stern DI (2004) The rise and fall of the Environmental Kuznets Curve. World Dev 32(8):1419–1439
Suh S (2003) SimaPro 7 Database Manual The USA Input Output 98 library. Pré Consultants
TERI (2006) TEDDY 2004/05: TERI energy data directory & yearbook. The Energy and Resources Institute (TERI), India Tobler MI, Schaerer S (2002) Environmental impacts of different cotton
growing regimes. International Cotton Conference. Bremen van Hoof G, Schowanek D, Feijtel TCJ (2003) Comparative life
cycle assessment of laundry detergent formulations in the UK - part I: environmental fingerprint of five detergent formulations in 2001. Tenside Surfactants Deterg 40(5):266– 275
Weidema B, Nielsen AM, Christiansen K, Norris G, Notten P, Suh S, Madsen J (2005) SimaPro 7 Database Manual Danish Input Output 99 library. Pré Consultants
Wiegmann K (2002) Anbau und Verarbeitung von Baumwolle -Dokumentation der GEMIS-Daten. Oeko-Institut, Freiburg, Germany, pp 1–25