Cerebral Cortex January 2009;19:55--65 doi:10.1093/cercor/bhn056
Advance Access publication April 18, 2008
Right Parietal Brain Activity Precedes
Perceptual Alternation of Bistable Stimuli
Juliane Britz1,2, Theodor Landis3and Christoph M. Michel1,2,3
1
Department of Fundamental Neuroscience,2Biomedical Imaging Center, University of Geneva and3Department of Neurology, University Hospital of Geneva, 1211 Geneva, Switzerland
Momentary fluctuations of baseline activity have been shown to influence responses to sensory stimulation both behaviorally and neurophysiologically. This suggests that perceptual awareness does not solely arise from physical stimulus properties. Here we studied whether the momentary state of the brain immediately before stimulus presentation indicates how a physically unique but perceptually ambiguous stimulus will be perceived. A complex Necker cube was intermittently presented and subjects indicated whether their perception changed with respect to the preceding presentation. EEG was recorded from 256 channels. The prestimu-lus brain-state was defined as the spatial configuration of the scalp potential map within the 50 ms before stimulus arrival, representing the sum of all momentary ongoing brain processes. Two maps were found that doubly dissociated perceptual reversals from perceptual stability. For EEG sweeps classified as either map, distributed inverse solutions were computed and statistically compared. This yielded activity confined to a region in right inferior parietal cortex that was significantly more active before a perceptual reversal. In contrast, no significant topographic differences of the evoked potentials elicited by stable vs. reversed Necker cubes were found. This indicates that prestimulus activity in right inferior parietal cortex is associated with the perceptual change.
Keywords: bistable perception, functional microstate, high-density EEG, prestimulus activity, weighted minimum-norm inverse solution
Introduction
According to the notion that perceptual awareness is de-termined by physical stimulus properties, sensory brain functions are usually investigated by examining the neural responses evoked by the stimulus. However, because the brain is by default never completely inactive, any evoked response is embedded in the momentarily occurring activity, the amplitude of which is orders of magnitude larger than that of any evoked response. Because of the large variability and apparent stochasticity of the momentary activity, it is dismissed as noise and eliminated by averaging in order to extract the evoked signal. This pertains to the scales from single cell recordings in animals to scalp-evoked potentials in humans. However, there is ample and constantly growing evidence that the ongoing brain activity is neither meaningless nor random but that it carries functional significance which largely determines the way incoming stimuli are processed.
Arieli et al. (1996) demonstrated that the large variability in the evoked responses of a single neuron in primary visual cortex is not stochastic but that it varies as a direct function of the fluctuations in membrane potentials in the larger network it is embedded in. In other words, the variability of the evoked
response is determined by the momentary state of the populations it is part of. Other electrophysiological studies in animals showed that both variability and amplitude of evoked responses are determined by prestimulus fluctuations in membrane potentials. This has been interpreted as spontane-ously emerging internal representation of sensory attributes and hence, sensory processing is determined by internally repre-sented states (Azouz and Gray 1999; Kisley and Gerstein 1999). Electrophysiological and neuroimaging studies in humans also support the notion of functionally significant dynamic fluctuations of the resting state and state-dependent informa-tion processing.
A 1st line of evidence comes from studies that showed that the brain activity before stimulus arrival can account for the variability in behavioral responses to identical stimuli. The prestimulus ongoing activity was thereby characterized by oscillations in specific electroencephalography (EEG) fre-quency bands (mainly alpha and gamma) (Ergenoglu et al. 2004; Gonzalez Andino et al. 2005; Hanslmayr et al. 2005; Schubert et al. 2006; Thut et al. 2006; van der Togt et al. 2006; Womelsdorf et al. 2006), by EEG activity evoked by a preceding cue (Otten et al. 2006), or by the spatial configuration of the momentary scalp electric field (Mohr et al. 2005). In all cases the neural activity before the stimulus predicted accuracy or speed of processing of the subsequent stimulus. Other electrophysiological studies demonstrated that the morphology and topography of the event-related brain potentials (ERPs) to physically identical stimuli depend on the neuronal state of the brain just before stimulus arrival (Lehmann et al. 1994; Kondakor et al. 1995, 1997). This strongly suggests that identical stimuli can activate different neuronal circuits depending on the momentary functional state of the brain.
A 2nd line of evidence is provided by studies of the resting state of the brain. Spontaneously emerging activity has been reported independent of stimuli or tasks (Kenet et al. 2003; Laufs et al. 2003; Beckmann et al. 2005; Fox et al. 2005; Damoiseaux et al. 2006; Fox et al. 2006a, 2006b; Laufs et al. 2006). The functional significance of these spontaneous fluctuations have been suggested by the fact that they occur coherently in areas forming well-defined large-scale neuro-cognitive networks, such as for example the fronto-parietal attention systems.
These studies support 2 important notions: 1st, that apparently random fluctuations of spontaneous brain activity can influence the processing of subsequently presented stimuli and 2nd, that such spontaneous fluctuations can vary in a coherent fashion and that they carry functional significance even in the absence of stimuli or a task. In other words, prestimulus activity can influence poststimulus processing.
The present study explored the possibility whether the momentary functional states of the brain cannot only influence speed and accuracy of sensory processing but also a quali-tative aspect thereof, namely the perceptual interpretation of bistable ambiguous stimuli (Necker cube). These types of stimuli are physically unique but induce involuntary and inevitable alternations between mutually exclusive perceptual interpretations. This property renders them an excellent vehicle to dissociate perceptual awareness from physical stimulus properties.
Bistable ambiguous stimuli have undergone extensive in-vestigation because the 1st half of the 19th century, and based on a large body of behavioral literature as recently reviewed (Long and Toppino 2004), 2 prominent alternative explan-ations have been put forward in the literature: 1 focuses on passive bottom-up processes of neural satiation or fatigue in early visual areas, whereas the other stresses active top-down cognitive influences such as attention or expectation. Various
electrophysiological and functional neuroimaging studies
aimed at disentangling these 2 processes and have provided evidence for either view. Isoglu-Alkac and collaborators report a positive wave in the EEG that appeared approximately 250 ms before the subjects signaled the change (Isoglu-Alkac et al. 1998). In subsequent studies, they showed that this time period is characterized by increased delta and decreased alpha power (Basar-Eroglu et al. 1996; Alkac et al. 2000; Isoglu-Alkac and Struber 2006), and they concluded that both automatic processing in a bottom-up manner and attentional processes based on top-down control were implicated in inducing the effects. However, this does not sufficiently explain why perception alternates between mutually exclusive views of a rotated orientation rather than between a more or less blurred views of the same orientation. Similar conclusions were drawn by Kornmeier and Bach who used an intermittent rather than continuous presentation of a Necker lattice, allowing the computation of stimulus evoked potentials (Kornmeier and Bach 2004, 2005, 2006). They found amplitude differences between reversal and stable trials for both early visual components and for the P300. This was interpreted as a resolution of perceptual ambiguity during early visual processing (bottom-up) and a later conscious appraisal of the perceptual reversal (top-down).
Functional neuroimaging studies on bistable perception have used a multitude of both stationary and nonstationary ambiguous stimuli (Kleinschmidt et al. 1998; Inui et al. 2000; Sterzer et al. 2002; Slotnick and Yantis 2005). Independent of the physical stimulus, these studies report increased activity in extrastriate visual and right parietal as well as frontal cortical areas during perceptual reversal which has been interpreted as the conscious apprehension of the altered percept, supporting the view that top-down processes induce perceptual switches. Despite fundamental differences in the assumption on the underlying processes (bottom-up vs. top-down), both accounts share the notion that the perceptual reversals are stimulus-induced. However, the studies on baseline state fluctuations and state-dependent information processing described above allow to formulate an alternative hypothesis for the perceptual change, namely that the momentary fluctuations of brain activity before stimulus presentation determine how an ambiguous stimulus will be perceived. This possibility is further supported by the fact that reversal intervals for ambiguous stimuli do no follow a regular periodicity with high temporal
intercorrelations. Along with the inability to control the alternations in perceptual interpretations, this is indicative of the idea that they might be caused by an internally generated rather than an exogenously evoked process and that the internal generation is due to spontaneously emerging activity.
This hypothesis is supported by an EEG study on illusory multistable motion perception (Mu¨ller et al. 2005). By using EEG microstate and global complexity analysis they found a specific microstate class that was significantly more present before the presentation of the stimulus that was marked as change in motion direction. In addition, the complexity increased during this prestimulus period, indicating an increased number of uncorrelated processes in the brain. Together with previous results on spectral changes of the EEG before perceptual changes (Mu¨ller et al. 1999) the authors interpret their findings as indication for microfluctuations in vigilance and attention that influence perception.
In order to explore whether such microfluctuations in EEG activity also predict perceptual change of stationary bistable stimuli that are physically identical, we used the paradigm introduced by Kornmeier and Bach (2004) where Necker cubes were presented intermittently and subjects were asked to indicate perceptual reversals by means of a button press after the stimulus. We sought to identify functional microstates of the brain and the concomitant differential activity that might dissociate perceptual reversals from perceptual stability. The EEG was recorded from 256 electrodes, and we identified the functional microstate immediately preceding the onset of each stimulus by means of the momentary scalp electric field (EEG map) relying on the assumption that different electric fields indicate different generators and hence different functional states (Vaughan 1982; McCarthy and Wood 1985). By statistical parametric mapping of the estimated concomitant EEG sources, the regions of the brain that were differentially activated before perceptual reversals were determined.
Methods
Subjects
Twelve subjects (3 female) participated in exchange for monetary compensation. All were right-handed according to the Edinburgh Handedness Inventory (Oldfield 1971) and had normal or corrected-to-normal visual acuity and none had any prior or current neurological or psychiatric impairments. Mean age of participants was 28.6 years (range 21--35 years). Prior to participation, subjects provided written informed consent that had been approved by the Medical Ethics Committee of the University Hospital of Geneva in compliance with the Declaration of Helsinki.
Stimuli and Procedure
The Stimulus used was a complex version of a Necker Cube that was presented centrally on a computer screen for 800 ms followed by a blank screen for 600 ms (see Fig. 1 for an example of the stimulus and the experimental procedure). We chose a Necker cube to avoid confounding alternative percepts with semantic contents (as e.g., for the Rubin’s face-vase stimulus) or spatial frequencies (as e.g., different interpretation of an image based on global or local features). The reason for showing a complex version of the Necker cube was to enhance the steric appearance of the stimulus (see Kornmeier and Bach 2004 for a similar argumentation). Both a right- and a left-facing version of the stimulus was used, each of which was presented 250 times. Subjects were asked to indicate a perceptual reversal by means of a button press with their right index finger during the blank period; that is, they were instructed to indicate whether their perception of the stimulus at the
onset of trial n was different from that in trial n–1. The experiment was conducted in an electromagnetically shielded and sound-attenu-ated booth, and subjects were sesound-attenu-ated 100 cm away from a CRT screen with the stimulus subtending 2.5° of visual angle.
Analysis of the Statistical Properties of the Reversal Intervals and Behavior
We assessed the statistical properties of the reversal intervals by means of their distribution and autocorrelation function. This was done in order to assess their stochasticity and hence the irregularity of the assumed momentary fluctuations. It has been reported that reversal intervals of binocular rivalry (Lehky 1995) and bistable perception (Zhou et al. 2004) lack short-term intercorrelations (Mamassian and Goutcher 2005) and that the duration of reversal intervals can be approximated by either Gamma (Leopold and Logothetis 1999) or lognormal (Lehky 1995; Zhou et al. 2004) distributions. In order to evaluate the autocorrelation function of the duration of the reversal intervals, we computed for each subject the correlation of the reversal duration in each trial n with the 1 in trial n+mfor m=1--10. In order to test the distribution of these durations, we computed Maximum Likelihood Estimates from the cumulative probability distribution both of the a and b parameters of the gamma distribution and of the l and r parameters of the lognormal distribution. A Kolmogorov--Smirnov test was used to test for these distributions.
In order to exclude that differential preparatory motor activity might account for differences between the 2 conditions, we assessed whether different amounts of trials were preceded by a motor response in the 2 conditions. We 1st evaluated the absolute number of trials per condition per subject; we then evaluated how many of those trials were preceded by a motor response in each condition in each subject, and finally, we evaluated what percentage of trials in the 2 conditions was preceded by a motor response in each subject. The latter was done because the current paradigm would lead one to expect more trials in the Stable than the Reversal condition, which is why the relative number is more informative about a potential motor contamination. Moreover, we also assessed the reaction times (RTs) and assessed how many responses were actually performed in the prestimulus period of the subsequent trial.
EEG Acquisition and Raw Data Processing
The EEG was recorded from 256 AgCl carbon-fiber coated electrodes using a Hydrocel Geodesic Sensor Net (HCGSN). The vertex was used as the recording reference, and EEG was continuously digitized at 1 kHz and band-pass filtered between 0.1 and 100 Hz; impedances were kept below 30 kX. Off-line, the EEG was re-referenced to the average of both ears (electrodes 68 and 210 of the HCGSN, which are the closest to the preauricular points) in order to obtain waveforms that are maximally comparable to those obtained in previous studies (Kornme-ier and Bach 2004, 2005, 2006). For each stimulus, it was determined whether it represented an alternation of perception or not (‘‘Reversal’’ or ‘‘Stable’’ trial) based on the response of the subject.
For each trial, epochs were selected ranging from 300 ms before to 800 ms after the stimulus. These epochs were band-pass filtered
between 1 and 30 Hz and visually inspected for occulomotor and other artifacts in addition to an automated amplitude threshold. Epochs with artifacts were rejected. Electrodes located on the cheeks were excluded and the data from 204 electrodes were submitted to further analysis. Channels exhibiting substantial noise were interpolated using a 3D spherical spline interpolation procedure (Perrin et al. 1989); on average, 2.27 channels were interpolated per subject.
Analysis of prestimulus EEG microstates
The definition of EEG microstates (Lehmann and Skrandies 1980, 1984; Wackermann et al. 1993; Koenig et al. 2002; Katayama et al. 2007) is derived from the notion of quasi-stable topographic configurations of the scalp electric field in the spontaneous EEG over short periods of time. During periods of stable scalp topography (lasting around 80 ms), only the strength, but not the configuration of the field varies; a measure of field strength is the global field power (GFP) which is equivalent to the spatial standard deviation of the potential field (Lehmann and Skrandies 1980). Accordingly, the maximum of the GFP in a given time window is the best representative of a microstate in terms of signal-to-noise ratio (Skrandies 2007). Following this logic, we determined the GFP peak in the time window 50 ms before the onset of the stimulus and selected the map at that time point as representing the sum of all momentary ongoing brain processes during this functional microstate. This approach has been used in several previous studies (Lehmann et al. 1994; Kondakor et al. 1995; Kondakor et al. 1997; Mohr et al. 2005).
In a 1st step, we identified those maps that best differentiated the Reversal and Stable conditions for each individual subject. For each trial, that is, each individual EEG epoch, the map representing the maximum GFP in the 50 ms time window preceding the stimulus was extracted. Subsequently, for each subject separately, the selected maps of both conditions were concurrently subjected to a spatial k-means cluster analysis (Pascual-Marqui et al. 1995), in order to identify the most dominant scalp topographies. Polarity of the maps was ignored in this cluster analysis (Lehmann et al. 1987). The optimal number of clusters or ‘‘template maps’’ that best describe the data was determined on the basis of a modified Krzanowski--Lai criterion (Krzanowski and Lai 1988). Next, the template maps identified by this procedure were fitted into the original data of the corresponding subject by calculating the spatial correlation between each original map and all template maps. Each prestimulus map was then allocated to the template map with which it correlated best (Pegna et al. 1997). Based on statistical measures on the frequency of appearance and the global explained variance of each map in each of the conditions, those template maps that most clearly differentiate the Reversal and Stable conditions were identified. In other words, this procedure determined the best template maps representing the 2 conditions within each subject.
In a 2nd step, we determined the maps that best differentiate the Reversal and Stable conditions across the subjects. The differential maps of each subject extracted in the previous step were grouped for each condition across subjects and submitted to an additional k-means cluster analysis. In accordance with previous studies, only the 4 most dominant cluster maps were selected for each condition (Wackermann et al. 1993; Koenig et al. 1999, 2002; Mu¨ller et al. 2005). These 8 maps were fitted back into the original data, using the same fitting procedure described above. By statistically comparing the frequency of occur-rence and the global explained variance, we tested whether there are maps that significantly dissociate the 2 conditions and thus indicate systematically different brain states.
Source Localization
We extracted those microstates from the raw EEG of each subject that were labeled by the maps which dissociate the Reversal and Stable conditions. We then estimated their intracranial current distributions using a radially weighted minimum-norm inverse solution (Ha¨ma¨la¨inen and Ilmoniemi 1994). The solution space was computed on a spherical head model with anatomical constraints (SMAC model, Spinelli et al. 2000) and comprised 3005 solution points equidistantly distributed within the gray matter of the cerebral cortex and limbic structures of Figure 1. Experimental procedure. Stimuli were presented for 800 ms followed by
a blank screen for 600 ms. Subjects indicated perceptual reversals during the blank interval following the stimulus. Trials were classified as either Reversal or Stable trials based on the behavioral response.
the Montreal Neurological Institute (MNI) 152 average brain. The source localization comprised 2 steps: 1st, we computed the average intracranial source distribution for each condition for all subjects. Second, similar to the statistical parametric mapping used in functional magnetic resonance imaging (fMRI) analysis, a voxel-by-voxel unpaired t-test was applied (Esslen et al. 2004; Murray et al. 2006) to compare the sources between the 2 conditions. This yielded the statistical para-metric maps of the differential activation. Statistical comparisons were conducted by performing paired t-tests at each solution point; P values were adjusted using a Bonferroni-correction for multiple testing (n=
number of electrodes: 204; see Michel et al. 2004a for a discussion).
Analysis of Poststimulus Evoked Potentials
Evoked potentials were computed for both the Stable and the Reversal conditions over a period of 900 ms encompassing a prestimulus window of 100 ms; no baseline correction was applied to the data in order to relate the poststimulus differences to the prestimulus state, however, a DC drift correction was applied to the entire period. The data-driven spatiotemporal analysis encompassed multiple steps as described previously (Michel et al. 2004b; Murray et al. 2006; De Santis et al. 2007). The 1st step tested differences in amplitude on single electrode level. For that, multiple t-tests for each electrode and time point were computed on the re-referenced data between the 2 conditions; the significance level was set to be P=0.01 without further correction for multiple comparisons, and no constraints were applied for the duration of significant differences. The 2nd and 3rd step assessed differences on the global level of the scalp electric field: they encompassed tests for differences in field strength and topography at each time point. Field strength was assessed by means of the GFP (cf. above); a point-wise paired t-test compared the GFP between the Stable and Reversal conditions. Differences in topography were assessed by calculating the spatial correlation between the strength-normalized maps at each moment in time (the so-called Map Dissimilarity; Lehmann and Skrandies 1980) and statistically testing the significance of the difference by bootstrapping procedures (De Santis et al. 2007). By physical laws, potential configuration differences must be due to changes in the localization of the distribution of the active generators in the brain during this period (Vaughan 1982; McCarthy and Wood 1985). Potential generator differences were additionally directly tested by statistical parametric mapping of the intracranial source distribu-tions estimated by the radially weighted minimum-norm inverse solution for each time point (cf. above).
Results
Statistical Properties of Reversal Intervals and Behavioral Results
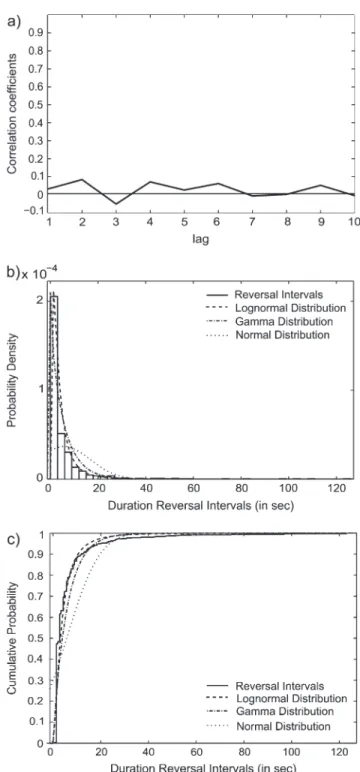
A total of 623 trials were retained in the Reversal condition and 2257 in the Stable condition after artifact rejection. The mean and median duration of the reversal intervals were 5751.18 and 2825 ms, respectively, with a standard deviation of 10 885 ms. Figure 2 illustrates the results of the analysis of the reversal intervals by means of their distribution and autocorrelation function. Figure 2a shows the correlations of the reversal interval in each trial n with the 1 in trial n+m. For m=1--10, no correlations were observed between the duration of reversal intervals in trial n and trial n+m. Figure 2b,c display the Probability Density and the Cumulative Probability Func-tions, respectively. A Kolmogorov--Smirnov test confirmed that
the reversal intervals followed both a gamma (a = 0.94;
b = 6.1036; P < 0.001) and a lognormal distribution (l =
8.0402; r=0.9491; P <0.001).
Supplementary Table 1 gives details on the percentage of trials preceded by a response for each subject and condition. Because of the large interindividual variations, we 1st performed a homoskedasticity test (Levene’s test) in order to
choose the appropriate statistical methods (parametric or nonparametric tests) to compare the groups. Levene’s test revealed that the variances did not differ between the conditions for the absolute numbers of trials (F <1) and the absolute numbers of trials preceded by a response (F1,22=3.12,
Figure 2. Statistical properties of the reversal intervals. (a) Autocorrelation function of the reversal rates for the lags 1--10. The y-axis displays the correlation coefficients for the respective lags. (b) Histogram of the probability density function of the reversal intervals. The dashed line displays the fitted lognormal probability distribution, the dashed-dotted lined displays the fitted gamma distribution, and the dotted line displays the fitted normal distribution. (c) The cumulative probability distribution for the Reversal intervals (solid line). The dashed line displays the fitted lognormal probability distribution, the dashed-dotted lined displays the fitted gamma distribution, and the dotted line displays the fitted normal distribution.
P=0.09), and percentage of trials (F1,22=3.03, P=0.09). Thus,
we used a t-test for all statistical comparisons.
The average absolute number of trials in the Stable condition was 188 per subject (standard deviation [SD] = 68.72, range 45--339) per subject and the average absolute number of trials in the Reversal condition was 52 per subject (SD=67.43, range 0--249) per subject. This difference was significant (t=4.675, P <0.001). The average number of trials per subject that were preceded by a motor response in the Stable condition was 28.73 per subject (SD=16.09, range 2--51), and in the Reversal condition it was 28.63 per subject (SD=70.02, range 0--223). This difference was not significant (t=0.004, P=0.996). The average percentage of trials per subject that were preceded by a motor response in the Stable condition was 16.92% per subject (SD=11.26, range 0.96--34.93%), and in the Reversal condition it was 18.88% per subject (SD = 29.79, range 0--93.54%). This difference was not significant (t=0.239, P=0.81).
In summary, the absolute numbers of trials differ between the conditions, so when considering the number and percent-age of trials preceded by a motor response across all subjects, they do differ. The reason for the apparent differences is the large interindividual variation. There were a few subjects who had frequent consecutive reversals and consequently a high number and percentage of motor responses in the reversal condition. On the other hand, there were a few subjects who had infrequent reversals and therefore had virtually no responses in the reversal condition. This interindividual variabil-ity leads to differences in the absolute number, but does not become statistically significant across subjects.
The mean and median RTs were 252.75 and 235 ms with a standard deviation of 111.21 ms. Out of all 623 responses, 9 had a RT of >550 ms, that is, they were executed during the prestimulus period of the subsequent trial. This corresponds to a proportion of 1.44% of all trials.
Prestimulus EEG Microstates
The 1st step of the analysis of the EEG consisted in the determination of the most dominant potential maps at the GFP peak in the 50-ms prestimulus period, both for the Reversal and for the Stable conditions in each subject. The k-means cluster analysis applied concurrently to all maps of both conditions identified on average 7.9 (
±
1.37) maps for each subject as optimally explaining the data in terms of the Krzanowski--Lai criterion. These selected template maps explained on average 74% (±
4.49%) of the global variance. All original maps were then compared with these template maps and labeled with the 1 it correlated best. The frequency of occurrence as well as the global explained variance was then compared between the 2 conditions for each template map. The 2 maps that differentiated the conditions best in both parameters were retained (i.e., 1 map for the Reversal condition and 1 for the Stable condition). In the rare case that several maps equally differentiated the conditions, all of those maps were retained. On average, 1.63 (±
0.67) maps were selected in the Reversal and 1.72 (±
0.64) in the Stable condition; they explained on average 26.34% (±
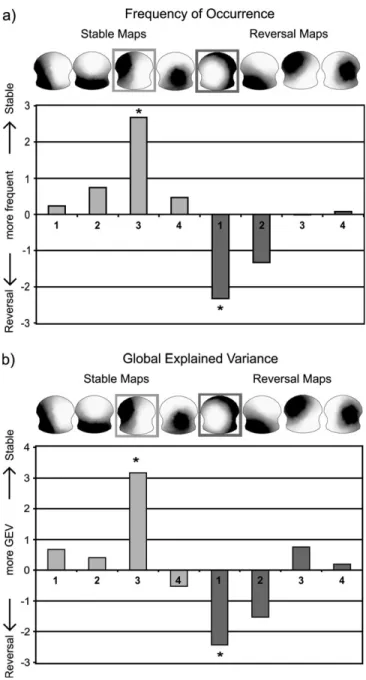
7.78%) of the global variance. These maps were then grouped for each condition across subjects and submitted to a 2nd cluster analysis. The 4 most dominant cluster maps were kept for each condition. The resulting 8 maps were compared with the original data in terms of spatial correlation and again, each original map was labeled with the 1 it correlated best. Paired t-tests compared both thefrequency of occurrence and the global explained variance of these maps of each template map between the 2 conditions. For each condition, 1 map was found which occurred significantly more often in 1 than the other condition (Reversal: t11 = –2.67; P = 0.0232; Stable: t11 = 2.32; P =
0.0423; Fig. 3a). Likewise, these 2 maps also differentiated the 2 conditions with respect to Global Explained Variance (Reversal: t11=–3.16; P =0.01; Stable: t11= 2.42; P =0.0355;
Fig. 3b). In order to assure that these 2 maps were not determined by a subset of the subjects, the global presence in each subject and condition was determined by means of the variance that these maps explained in each subject. The result of this analysis is presented in Figure 4. It shows that both maps were homogenously distributed over subjects. Analyses of the frequency of occurrence revealed that 15.73% of all trials were represented by the 2 dissociating template maps that together explained 26% of the variance.
Source Localization
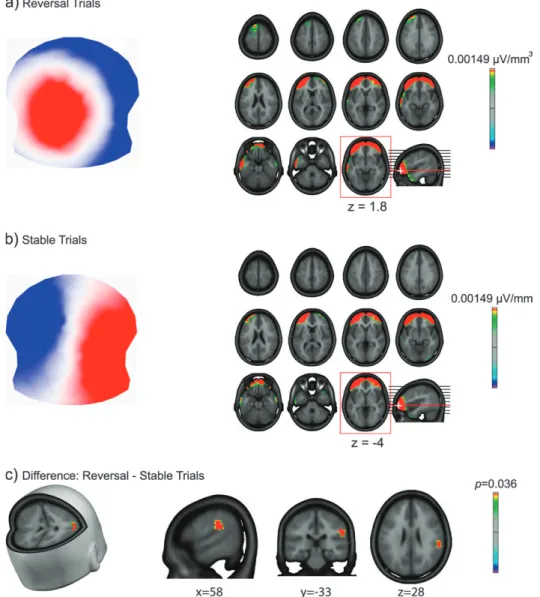
For the EEG microstates that were labeled as being best correlated with the significant template map of this condition, distributed inverse solutions were computed for the prestimu-lus GFP peak map. Figure 5a displays the dominant map for the Reversal trials along with the mean of the current source distribution, and Figure 5b does so for the Stable trials. For both Reversal and Stable conditions, strong bilateral activations of lateral prefrontal cortex comprising medial and inferior frontal gyri were obtained. However, the statistical analysis revealed that these frontal sources did not significantly differ between the 2 conditions. Rather, significant differences were found in the right inferior parietal lobe (Talairach coordinates: 58–33 28.2; BA 40, t11 = 5.7; P < 0.05) that was more active in
the Reversal than the Stable condition. Figure 5c displays the Statistical Parametric Map of the differential activation in the Reversal condition; no area was differentially more active preceding a Stable than a Reversal trial.
Poststimulus Evoked Potentials
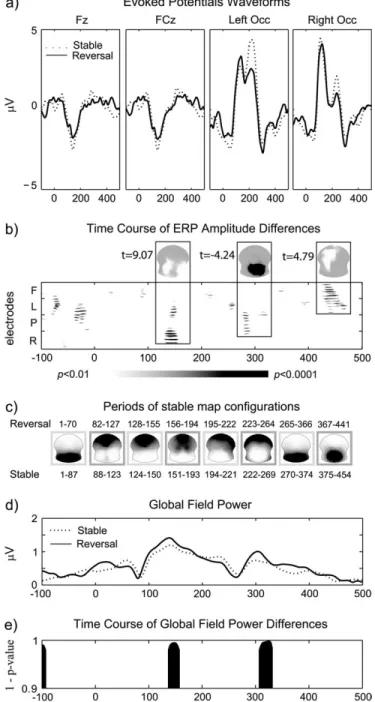
The analysis encompassed multiple steps as laid out in the Methods section. Figure 6a shows the visual evoked potential waveforms for the Stable and Reversal conditions at 4 exemplar electrode sites (Fz, FCz, left occipital, right occipital); the time course of significant amplitude modulations (P <0.01 without any further constraints on duration or multiple comparisons) is shown in Figure 6b.
Modulations of early visual components were dominant over lateral occipito-parietal electrode sites followed by a broad negative deflection over frontal sites; time point by time point t-tests between the 2 conditions were performed at each of the 204 electrodes; only results significant at the level of P=0.01 are reported without any further temporal constraints. Amplitudes 1st differed significantly between the Reversal and Stable conditions in the time windows 128--154 ms with ERPs being more positive in the Reversal than the Stable condition over occipital electrode sites (the so-called reversal positivity; Kornmeier and Bach 2004, 2005, 2006), which was maximal at 150 ms (46 out of 204 electrodes). It was followed by another window of significant differences between 274 and 292 ms during which ERPs were more negative in the Reversal than the Stable condition over occipito-parietal sites (the so-called reversal negativity; Kornmeier and Bach 2004, 2005, 2006), which was maximal at 283 ms (30 out of 204
electrodes). Finally, significant ERP differences were found between the 2 conditions between 423 and 471 ms in a widespread area over frontal, central, and parietal electrode sites, which had an initial frontal and then a left-lateralized distribution (the so-called frontal and parietal positivities; Kornmeier and Bach 2004, 2005, 2006) (45 out of 204 electro-des). The analysis of field strength (GFP) revealed significant differences in field strength between the 2 conditions in 2 time windows: 137--157 ms and 307--331 ms (depicted in Fig. 6d,e). The global analysis of the electric field in terms of field topography and estimated source distribution for each time point revealed neither differences in field topography nor source localization at any time point. A topographic pattern analysis
identified 8 maps which were identical for both conditions and were found within the same time windows in the 2 conditions. These maps are shown in Figure 6c.
Discussion
The main result of the present study is that the alternating perceptual interpretations of bistable ambiguous stimuli arise from the momentary brain activity independent of a physical stimulus. We used 256-channel Electrical Neuroimaging to determine whether momentary fluctuations of brain activity might be predictive of perceptual reversals of bistable ambigu-ous stimuli. In order to capture such fluctuations, we de-termined the microstates of the spontaneous ongoing EEG and their concomitant sources in the brain immediately preceding the onset of an intermittently presented complex Necker cube. We identified 2 EEG microstates which doubly dissociated reversal from stable trials in the 50 ms before stimulus arrival. This finding is in line with a previous 21-channel EEG study by Mu¨ller et al. 2005, who showed a functional microstate that appeared more frequently in the 300 ms preceding direction changes of multistable illusory motion. We here report 2 microstates that provide a double dissociation between stable and reversal trials not only within but also between subjects. By using high resolution EEG and statistical parametric mapping in the inverse space, we were able to determine the sources in the brain that were significantly more active during the period preceding the change.
The only significant difference was obtained in a confined region in the right inferior parietal lobe which was significantly more active preceding a stimulus that constituted a perceptual reversal than one that did not. This area has been consistently identified in fMRI studies on bistable ambiguity (Kleinschmidt et al. 1998; Inui et al. 2000; Slotnick and Yantis 2005), and has been interpreted as the appraisal of the altered perceptual interpretation. However, due to the temporal resolution of fMRI which is on the scale of seconds, temporal allocation of blood oxygenation level--dependent activation remains a challenge. In the present study, we used Electrical Neuroimaging, which has a temporal resolution on the scale of milliseconds, and found this area to be differentially more activated immediately precedingbut never as a consequence of a perceptual reversal. This area of the brain has been found to be involved in successful change detection and change blindness (Beck et al.
Figure 3. Results of the analysis of the prestimulus EEG microstates. The 4 maps extracted for the Stable and Reversal conditions are displayed in the top panel, and the 2 maps that significantly dissociated the 2 conditions are labeled. (a) The t-values for the statistical comparison of the frequency of occurrence in the 2 conditions are given; the asterisk marks the significant difference. (b) The t-values for the statistical comparison of the global explained variance in the 2 conditions are given; the asterisk marks the significant difference.
Figure 4. Global presence of template maps. The amount of global variance explained by the 2 template maps is given for each individual subject.
2001; Pessoa and Ungerleider 2004; Kim and Blake 2005; Beck et al. 2006). Moreover, it is involved in higher order salience-based as opposed to luminance-salience-based aspects of motion (Battelli et al. 2001; Ducommun et al. 2002; Sterzer et al. 2002; Claeys et al. 2003; Federspiel et al. 2006; Martinez-Trujillo et al. 2006). The momentary activity in this brain area appears to predict the perception of a rotated perspective of a unique stimulus despite the absence of any changes in the physical stimulus. This finding challenges the models of bottom-up neural fatigue or top-down intention induced by the stimuli.
The comparison of the poststimulus ERPs between the Stable and the Reversal conditions revealed amplitude differ-ences in comparable time windows as described earlier (Kornmeier and Bach 2004, 2005, 2006; Kornmeier et al. 2007). Moreover, the same ERP components that have been previously described (reversal positivity, reversal negativity and later frontal and parietal positivities) were obtained in the present study. Unlike Kornmeier and Bach who describe the
ERP components as significant differences between the peak of the difference wave and a peristimulus baseline, we describe them in terms of significant amplitude differences between the 2 conditions, thus replicating their results. However, these differences were restricted to a subset of electrodes only and did not withstand global tests of the electric field. Particularly, tests of topographic differences between the ERPs of the 2 conditions were not significant at any moment in time, neither on the scalp level, nor in the inverse space. Thus there was no indication for changes in terms of location of neuronal generators that were activated by these physically identical stimuli when the perceptual interpretation changed. Only some subtle changes of the global strength of activation of the same source distribution were found in 2 intervals (136--158 ms and 306--331 ms). Because the comparison of the inverse solution did not reveal significant differences these strength differences cannot be attributed to any specific area of the activated network.
Figure 5. Electrical source imaging results for the Reversal and Stable conditions. (a, b) Dominant EEG scalp topography map (left) and current source distribution (right) for the weighted minimum-norm inverse solution in the Reversal (a) and Stable (b) conditions. Source estimations are rendered on the MNI template brain; the red square indicates the axial slice (Talairach z-coordinate given; left hemisphere on the left side) of maximal activation. (c) Statistical parametric map (P values) for the comparison of the source estimations shown in (a) and (b).
Irrespective of whether the perception of a stimulus changed upon its presentation, it was preceded by bilateral activity in lateral prefrontal regions encompassing both dorso-and ventrolateral prefrontal cortex. Left dorso- dorso-and ventrolat-eral prefrontal cortex have been reliably identified as being involved in the maintenance and manipulation of items in working memory, respectively (D’Esposito et al. 2000; Stern et al. 2000; Petrides 2005; Crone et al. 2006). The right middle and inferior frontal gyri have been implicated in both vigilance and sustained attention as well as maintenance and updating of task-set configurations (Wilkins et al. 1987; Rueckert and Grafman 1996; Miller and Cohen 2001; Husain and Rorden 2003; Fox et al. 2006a). This indicates that subjects remained vigilant during the retention interval and that they successfully kept the representation of the stimulus in working memory during that time. Statistical comparisons of the inverse solutions did not reveal differences in lateral prefrontal activation between reversal and stable trials; hence, there is no evidence for differential working memory maintenance and manipulation or vigilance during the retention interval.
One could argue that the intermittent presentation might not constitute ‘‘natural’’ switch conditions (Leopold et al. 2002); these authors have shown that the temporary removal of an ambiguous stimulus can lead to a slowing and even a standstill of perceptual alternations which increase as a function of the duration of the removal. Dramatically increased durations of perceptual stability have been observed when various ambiguous stimuli were removed from view for several seconds. Kornmeier et al. (2007) have shown that short inter-stimulus intervals (ISIs) (<500 ms) lead to an increase in reversals relative to passive viewing conditions, whereas longer ISIs lead to a decrease. For the presentation rate used in the present study, the analysis of the statistical properties of the reversal intervals confirms that perceptual reversals occur at normal intervals despite the intermittent presentation. The lack of temporal intercorrelation of the reversal intervals and their distribution confirms previous results and further supports the stochasticity of the occurrence of the perceptual reversals.
An important aspect of the analysis concerned the possibility that preceding motor activity could account for our results. Even if only a marginal number of trials included a motor response (1.44%), it cannot be refuted that response related activity that appeared some 300 ms before the analysis period can influence the ongoing brain process. Our detailed analysis of this possible confound renders this explanation very unlikely. We are therefore concluding that the observed differences in the prestimulus microstates are due to intrinsic brain-state differences and not due to motor response related processes.
An fMRI study on binocular rivalry also showed right parietal activation (Lumer et al. 1998), suggesting that prestimulus activation of this area might also contribute to the phenome-non of binocular rivalry. Additionally, stronger activation in right inferior frontal lobe and in bilateral extrastriate visual areas have been reported which we did not find for our bistable ambiguous stimulus. However, despite sharing common phe-nomenological features, namely the alternation of perceptual awareness despite a constant physical stimulation, binocular rivalry and bistable perception constitute 2 independent phenomena which arise from completely different processes, for example, they are differentially susceptible to voluntary control. (Meng and Tong 2004), which makes them only conditionally comparable.
Figure 6. Poststimulus evoked potentials. (a) Visual evoked potential waveforms for the Stable (dotted line) and Reversal (solid line) conditions at 4 exemplar electrode sites (Fz, FCz, left occipital, right occipital). (b) Time course of the ERP amplitude differences at the 204 electrodes were assessed by point-wise paired t-tests at each electrode. Time is plotted on the x-axis, and approximate electrode locations are indicated on the y-axis (F 5 frontal, L 5 left, P 5 posterior/occipital, R 5 right). Significant differences (P values) are indicated by grayscale values. Insets depict the scalp location of the significant effects (t-values for which significant P values were obtained): white shades indicate positive t-values and black shades indicate negative t-values. (c) Periods of stable ERP map configurations as identified by the topographic pattern analysis in both conditions. Maps are displayed with left hemifield on the left and nose on top as a function of time. In both conditions, the same sequence of maps was identified which did not differ between the conditions. Respective duration of occurrence in the Stable and Reversal conditions are indicated below and above the maps, respectively. (d) Modulation of the field strength (GFP) over time for the Stable (dotted line) and Reversal (solid line) conditions. (e) Time course of significant differences (1 P values) in field strength over time between the 2 conditions.
We used the most stringent and thus most conservative test possible, namely a double dissociation both within each and between all subjects, which lead to the loss of a substantial amount of trials. However, we could identify that proportion of all data which did doubly dissociate the 2 conditions significantly both in terms of frequency of occurrence and in terms of global explained variance. We can of course not rule out that other processes such as activity in prefrontal areas also contribute to perceptual reversals; but they do at least not contribute to the observed effect with the same strength and consistency as the 1 identified here.
fMRI has provided evidence that larger-scale neuronal networks can become active even in the absence of any stimulation or task (Laufs et al. 2003; Fox et al. 2005), and there is ample evidence from animal physiology (Arieli et al. 1995, 1996; Azouz and Gray 1999; Tsodyks et al. 1999; Womelsdorf et al. 2006) and human scalp-recorded EEG (Ergenoglu et al. 2004; Gonzalez Andino et al. 2005; Hanslmayr et al. 2005; Schubert et al. 2006; Thut et al. 2006) that spontaneously emerging activity of larger neuronal populations determines the sensory response evoked by an external stimulus. Our spatial analysis did not focus on the contribution of different EEG frequency bands. However, because the data were filtered between 1 and 30 Hz, major contribution of very low frequencies as well as Gamma activity to the obtained effect is excluded. Even though it has been shown that increased power in the Gamma frequency range over frontal scalp sites precedes perceptual reversals (Basar-Eroglu et al. 1996), our results can rule out that this neither necessary nor sufficient for a perceptual reversal.
Supplementary Material
Supplementary material can be found at: http://www.cercor. oxfordjournals.org/
Funding
Swiss National Science Foundation (3100-065096) to T.L.; and Swiss National Science Foundation (3200-111783) to C.M.M. Notes
The Cartool software (http://brainmapping.unige.ch/Cartool.htm) has been programmed by Denis Brunet from the Functional Brain Mapping Laboratory, Geneva, Switzerland, and is supported by the Center for Biomedical Imaging of Geneva and Lausanne. Conflict of Interest : None declared.
Address correspondence to Juliane Britz, PhD, Department of Fundamental Neuroscience, Centre Medical Universitaire, 1, rue Michel Servet CH-1211 Geneva, Switzerland. Email: juliane.britz@medecine. unige.ch.
References
Arieli A, Shoham D, Hildesheim R, Grinvald A. 1995. Coherent spatiotemporal patterns of ongoing activity revealed by real-time optical imaging coupled with single-unit recording in the cat visual cortex. J Neurophysiol. 73:2072--2093.
Arieli A, Sterkin A, Grinvald A, Aertsen A. 1996. Dynamics of ongoing activity: explanation of the large variability in evoked cortical responses. Science. 273:1868--1871.
Azouz R, Gray CM. 1999. Cellular mechanisms contributing to response variability of cortical neurons in vivo. J Neurosci. 19:2209--2223. Basar-Eroglu C, Struber D, Kruse P, Basar E, Stadler M. 1996. Frontal
gamma-band enhancement during multistable visual perception. Int J Psychophysiol. 24:113--125.
Battelli L, Cavanagh P, Intriligator J, Tramo MJ, Henaff M-A, Michel F, Barton JJS. 2001. Unilateral right parietal damage leads to bilateral deficit for high-level motion. Neuron. 32:985--995.
Beck DM, Muggleton N, Walsh V, Lavie N. 2006. Right parietal cortex plays a critical role in change blindness. Cereb Cortex. 16:712--717. Beck DM, Rees G, Frith CD, Lavie N. 2001. Neural correlates of change
detection and change blindness. Nat Neurosci. 4:645--650. Beckmann CF, DeLuca M, Devlin JT, Smith SM. 2005. Investigations into
resting-state connectivity using independent component analysis. Philos Trans R Soc Lond B Biol Sci. 360:1001--1013.
Claeys KG, Lindsey DT, De Schutter E, Orban GA. 2003. A higher order motion region in human inferior parietal lobule: evidence from fMRI. Neuron. 40:631--642.
Crone EA, Wendelken C, Donohue S, van Leijenhorst L, Bunge SA. 2006. Neurocognitive development of the ability to manipulate informa-tion in working memory. Proc Natl Acad Sci USA. 103:9315--9320. D’Esposito M, Postle BR, Rypma B. 2000. Prefrontal cortical
contribu-tions to working memory: evidence from event-related fMRI studies. Exp Brain Res. V133:3--11.
Damoiseaux JS, Rombouts SARB, Barkhof F, Scheltens P, Stam CJ, Smith SM, Beckmann CF. 2006. Consistent resting-state networks across healthy subjects. Proc Natl Acad Sci USA. 103:13848--13853. De Santis L, Clarke S, Murray MM. 2007. Automatic and intrinsic auditory ‘‘what’’ and ‘‘where’’ processing in humans revealed by electrical neuroimaging. Cereb Cortex. 17:9--17.
Ducommun CY, Murray MM, Thut G, Bellmann A, Viaud-Delmon I, Clarke S, Michel CM. 2002. Segregated processing of auditory motion and auditory location: an ERP mapping study. Neuroimage. 16:76--88.
Ergenoglu T, Demiralp T, Bayraktaroglu Z, Ergen M, Beydagi H, Uresin Y. 2004. Alpha rhythm of the EEG modulates visual detection performance in humans. Cogn Brain Res. 20:376--383.
Esslen M, Pascual-Marqui RD, Hell D, Kochi K, Lehmann D. 2004. Brain areas and time course of emotional processing. Neuroimage. 21:1189--1203.
Federspiel A, Volpe U, Horn H, Dierks T, Franck A, Vannini P, Wahlund L-O, Galderisi S, Maj M. 2006. Motion standstill leads to activation of inferior parietal lobe. Hum Brain Mapp. 27:340--349. Fox MD, Corbetta M, Snyder AZ, Vincent JL, Raichle ME. 2006a.
Spontaneous neuronal activity distinguishes human dorsal and ventral attention systems. Proc Natl Acad Sci USA. 103:10046--10051. Fox MD, Snyder AZ, Vincent JL, Corbetta M, Van Essen DC, Raichle ME. 2005. The human brain is intrinsically organized into dynamic, anticorrelated functional networks. Proc Natl Acad Sci USA. 102:9673--9678.
Fox MD, Snyder AZ, Zacks JM, Raichle ME. 2006b. Coherent spontaneous activity accounts for trial-to-trial variability in human evoked brain responses. Nat Neurosci. 9:23--25.
Gonzalez Andino SL, Michel CM, Thut G, Landis T, Grave de Peralta R. 2005. Prediction of response speed by anticipatory high-frequency (gamma band) oscillations in the human brain. Hum Brain Mapp. 24:50--58.
Ha¨ma¨la¨inen MS, Ilmoniemi RJ. 1994. Interpreting magnetic fields of the brain—minimum norm estimates. Med Biol Eng Comput. 32:35--42.
Hanslmayr S, Klimesch W, Sauseng P, Gruber W, Doppelmayr M, Freunberger R, Pecherstorfer T. 2005. Visual discrimination performance is related to decreased alpha amplitude but increased phase locking. Neurosci Lett. 375:64--68.
Husain M, Rorden C. 2003. Non-spatially lateralized mechanisms in hemispatial neglect. Nat Rev Neurosci. 4:26--36.
Inui T, Tanaka S, Okada T, Nishizawa S, Katayama M, Konishi J. 2000. Neural substrates for depth perception of the Necker cube; a functional magnetic resonance imaging study in human subjects. Neurosci Lett. 282:145--148.
Isoglu-Alkac U, Basar-Eroglu C, Ademog˘lu A, Demiralp T, Miener M, Stadler M. 1998. Analysis of the electroencephalographic activity during the Necker cube reversals by means of the wavelet transform. Biol Cybern. 79:437--442.
Isoglu-Alkac U¨, Basar-Eroglu C, Ademoglu A, Demiralp T, Miener M, Stadler M. 2000. Alpha activity decreases during the perception of
Necker cube reversals: an application of wavelet transform. Biol Cybern. V82:313--320.
Isoglu-Alkac U, Struber D. 2006. Necker cube reversals during long-term EEG recordings: Sub-bands of alpha activity. Int J Psychophy-siol. 59:179--189.
Katayama H, Gianotti L, Isotani T, Faber P, Sasada K, Kinoshita T, Lehmann D. 2007. Classes of multichannel EEG microstates in light and deep hypnotic conditions. Brain Topogr. 20:7--14.
Kenet T, Bibitchkov D, Tsodyks M, Grinvald A, Arieli A. 2003. Spontaneously emerging cortical representations of visual attrib-utes. Nature. 425:954--956.
Kim C-Y, Blake R. 2005. Psychophysical magic: rendering the visible ‘invisible’. Trends Cogn Sci. 9:381--388.
Kisley MA, Gerstein GL. 1999. Trial-to-trial variability and state-dependent modulation of auditory-evoked responses in cortex. J Neurosci. 19:10451--10460.
Kleinschmidt A, Bu¨chel C, Zeki S, Frackowiak RS. 1998. Human brain activity during spontaneously reversing perception of ambiguous figures. Proc R Soc Lond B Biol Sci. 265:2427--2427.
Koenig T, Lehmann D, Merlo MCG, Kochi K, Hell D, Koukkou M. 1999. A deviant EEG brain microstate in acute, neuroleptic-naive schizophrenics at rest. Eur Arch Psychiatry Clin Neurosci. 249: 205--211.
Koenig T, Prichep L, Lehmann D, Sosa PV, Braeker E, Kleinlogel H, Isenhart R, John ER. 2002. Millisecond by millisecond, year by year: normative EEG microstates and developmental stages. Neuroimage. 16:41--48.
Kondakor I, Lehmann D, Michel CM, Brandeis D, Kochi K, Koenig T. 1997. Prestimulus EEG microstates influence visual event-related potential microstates in field maps with 47 channels. J Neural Transm. V104:161--173.
Kondakor I, Pascual-Marqui RD, Michel CM, Lehmann D. 1995. Event-related potential map differences depend on the prestimulus microstates. J Med Eng Technol. 19:66--69.
Kornmeier J, Bach M. 2004. Early neural activity in Necker-cube reversal: evidence for low-level processing of a gestalt phenomenon. Psychophysiology. 41:1--8.
Kornmeier J, Bach M. 2005. The Necker cube—an ambiguous figure disambiguated in early visual processing. Vision Res. 45:955--960. Kornmeier J, Bach M. 2006. Bistable perception—along the processing
chain from ambiguous visual input to a stable percept. Int J Psychophysiol. 62:345--349.
Kornmeier J, Ehm W, Bigalke H, Bach M. 2007. Discontinuous pre-sentation of ambiguous figures: how interstimulus-interval durations affect reversal dynamics and ERPs. Psychophysiology. 44:552--560. Krzanowski W, Lai YT. 1988. A criterion for determining the number of
groups in a data set using sum of squares clustering. Biometrics. 44:23--34.
Laufs H, Holt JL, Elfont R, Krams M, Paul JS, Krakow K, Kleinschmidt A. 2006. Where the BOLD signal goes when alpha EEG leaves. Neuroimage. 31:1408--1418.
Laufs H, Krakow K, Sterzer P, Eger E, Beyerle A, Salek-Haddadi A, Kleinschmidt A. 2003. Electroencephalographic signatures of attentional and cognitive default modes in spontaneous brain activity fluctuations at rest. Proc Natl Acad Sci USA. 100: 11053--11058.
Lehky S. 1995. Binocular rivalry is not chaotic. Proc R Soc Lond Ser B Biol Sci. 259:71--76.
Lehmann D, Michel CM, Pal I, Pascual-Marqui RD. 1994. Event-related potential maps depend on prestimulus brain electric microstate map. Int J Neurosci. 74:239--248.
Lehmann D, Ozaki H, Pal I. 1987. EEG alpha map series: brain micro-states by space-oriented adaptive segmentation. Electroencephalogr Clin Neurophysiol. 67:271--288.
Lehmann D, Skrandies W. 1980. Reference-free identification of components of checkerboard-evoked multichannel potential fields. Electroencephalogr Clin Neurophysiol. 48:609--621.
Lehmann D, Skrandies W. 1984. Spatial analysis of evoked potentials in man—a review. Prog Neurobiol. 23:227--250.
Leopold DA, Logothetis NK. 1999. Multistable phenomena: changing views in perception. Trends Cogn Sci. 3:254--264.
Leopold DA, Wilke M, Maier A, Logothetis NK. 2002. Stable perception of visually ambiguous patterns. Nat Neurosci. 5:605--609.
Long GM, Toppino TC. 2004. Enduring interest in perceptual ambiguity: alternating views of reversible figures. Psychol Bull. 130:748--765.
Lumer ED, Friston KJ, Rees G. 1998. Neural correlates of perceptual rivalry in the human brain. Science. 280:1930--1934.
Mamassian P, Goutcher R. 2005. Temporal dynamics in bistable perception. J Vis. 5:361--375.
Martinez-Trujillo JC, Cheyne D, Gaetz W, Simine E, Tsotsos JK. 2006. Activation of area MT/V5 and the right inferior parietal cortex during the discrimination of transient direction changes in trans-lational motion. Cereb Cortex. 17:1733--1739.
McCarthy G, Wood CC. 1985. Scalp distributions of event-related potentials: an ambiguity associated with analysis of variance models. Electroencephalogr Clin Neurophysiol. 62:203--208.
Meng M, Tong F. 2004. Can attention selectively bias bistable perception? Differences between binocular rivalry and ambiguous figures. J Vis. 4:539--551.
Michel CM, Murray MM, Lantz G, Gonzalez S, Spinelli L, Grave de Peralta R. 2004a. EEG source imaging. Clin Neurophysiol. 115: 2195--2222.
Michel CM, Seeck M, Murray MM. 2004b. The speed of visual cognition. Clin Neurophysiol. 57:617--627.
Miller EK, Cohen JD. 2001. An integrative theory of prefrontal cortex function. Annu Rev Neurosci. 24:167--202.
Mohr C, Michel CM, Lantz G, Ortigue S, Viaud-Delmon I, Landis T. 2005. Brain state-dependent functional hemispheric specialization in men but not in women. Cereb Cortex. 15:1451--1458.
Mu¨ller TJ, Federspiel A, Fallgatter A, Strik W. 1999. EEG signs of Vigilance fluctuations preceding perceptual flips in multistable illusionary motion. Neuroreport. 10:3423--3427.
Mu¨ller TJ, Koenig T, Wackermann J, Kalus P, Fallgatter A, Strik W, Lehmann D. 2005. Subsecond changes of global brain state in illusory multistable motion perception. J Neural Transm. V112:565--576. Murray MM, Imber ML, Javitt DC, Foxe JJ. 2006. Boundary completion is
automatic and dissociable from shape discrimination. J Neurosci. 26:12043--12054.
Oldfield RC. 1971. The assessment and analysis of handedness: the Edinburgh inventory. Neuropsychologia. 9:97--113.
Otten LJ, Quayle AH, Akram S, Ditewig TA, Rugg MD. 2006. Brain activity before an event predicts later recollection. Nat Neurosci. 9:489--491.
Pascual-Marqui RD, Michel CM, Lehmann D. 1995. Segmentation of brain electrical activity into microstates: model estimation and validation. IEEE Trans Biomed Eng. 42:658--665.
Pegna AJ, Khateb A, Spinelli L, Seeck M, Landis T, Michel CM. 1997. Unraveling the cerebral dynamics of mental imagery. Hum Brain Mapp. 5:410--421.
Perrin F, Pernier J, Bertrand O, Echallier JF. 1989. Spherical splines for scalp potential and current density mapping. Electroencephalogr Clin Neurophysiol. 72:184--187.
Pessoa L, Ungerleider LG. 2004. Neural correlates of change detection and change blindness in a working memory task. Cereb Cortex. 14:511--520.
Petrides M. 2005. Lateral prefrontal cortex: architectonic and functional organization. Philos Trans R Soc Lond B Biol Sci. 360:781--795. Rueckert L, Grafman J. 1996. Sustained attention deficits in patients
with right frontal lesions. Neuropsychologia. 34:953--963.
Schubert R, Blankenburg F, Lemm S, Villringer A, Curio G. 2006. Now you feel it—now you don’t: ERP correlates of somatosensory awareness. Psychophysiology. 43:31--40.
Skrandies W. 2007. The effect of stimulation frequency and retinal stimulus location on visual evoked potential topography. Brain Topogr. 20:15--20.
Slotnick SD, Yantis S. 2005. Common neural substrates for the control and effects of visual attention and perceptual bistability. Cogn Brain Res. 24:97--108.
Spinelli L, Gonzalez Andino S, Lantz G, Seeck M, Michel CM. 2000. Electromagnetic inverse solutions in anatomically constrained spherical head models. Brain Topogr. 13:115--125.
Stern CE, Owen AM, Tracey I, Look RB, Rosen BR, Petrides M. 2000. Activity in ventrolateral and mid-dorsolateral prefrontal cortex during nonspatial visual working memory processing: evidence from functional magnetic resonance imaging. Neuroimage. 11: 392--399.
Sterzer P, Russ MO, Preibisch C, Kleinschmidt A. 2002. Neural correlates of spontaneous direction reversals in ambiguous apparent visual motion. Neuroimage. 15:908--916.
Thut G, Nietzel A, Brandt SA, Pascual-Leone A. 2006. {alpha}-Band electroencephalographic activity over occipital cortex indexes visuospatial attention bias and predicts visual target detection. J Neurosci. 26:9494--9502.
Tsodyks M, Kenet T, Grinvald A, Arieli A. 1999. Linking spontaneous activity of single cortical neurons and the underlying functional architecture. Science. 286:1943--1946.
van der Togt C, Kalitzin S, Spekreijse H, Lamme VAF, Super H. 2006. Synchrony dynamics in monkey v1 predict success in visual detection. Cereb Cortex. 16:136--148.
Vaughan HGJ. 1982. The neural origins of human event-related potentials. Ann N Y Acad Sci. 388:125--138.
Wackermann J, Lehmann D, Michel CM, Strik W. 1993. Adaptive segmentation of spontaneous EEG map series into spatially defined microstates. Int J Psychophysiol. 14:269--283.
Wilkins AJ, Shallice T, Mccarthy R. 1987. Frontal lesions and sustained attention. Neuropsychologia. 25:359--365.
Womelsdorf T, Fries P, Mitra PP, Desimone R. 2006. Gamma-band synchronization in visual cortex predicts speed of change detection. Nature. 439:733--736.
Zhou YH, Gao JB, White KD, Merk I, Yao K. 2004. Perceptual dominance time distributions in multistable visual perception. Biol Cybern. V90:256--263.