Performance Prediction of Smart Permanent Virtual Circuits in ATM Networks with CACI
Comnet
Tibor Gyires
Applied Computer Science Department
Illinois State University, Normal, Illinois 61790-5150
I
ABSTRACT
As networks becomes larger and more complex the design and management of systems become more and more difficult. New technologies, such as Asynchronous Transfer Mode, new algorithms, and bandwidth demanding applications are implemented every day. How
can
network designers decide which combinations of connections, communication speeds, algorithms, and applications are the most appropriate for their business? A widely accepted answer is performance prediction through simulation. A model can be used toevaluate various design alternatives or various operational policies,
explore the behavior of proposed systems and connections before actually building them,
pre-test modifications.
We apply simulation techniques for ATM networks. In an ATM network the basic data units, called cells, are routed through switched or permanent virtual circuits. A Smart Permanent Virtual Circuit is a connection that looks like a Permanent Virtual Circuit at the local and remote endpoints with a Switched Virtual Circuit in the middle. In an earlier paper we presented a search algorithm [3] for managing Smart Permanent Virtual Circiiits. Our goal is to predict the performance of this search algorithm with the Distributed Software Module of the simulation modeling system CACI Comnet [4].
1. INrRODUCTION
In an ATM network the basic data units, called cells, are routed from a source to a destination through switched or permanent virtual circuits
(or
virtual channels) that can be bundled into virtual paths. A Switched Virtual Circuit is used to transport information between two locations and lasts only for the duration of the transfer. PtzrmanentVirtual Circuits (PVCs) are used for dedicated long-term information transport between locations. Establishment of virtual circuits and paths are based on a negotiation between the calling party and the ATM network. The cell routing is controlled by the ATM switches along the path between two ATM endpoints. A Smart PVC [l] is a connection that looks like a PVC at the local arid remote endpoints with a Switched Virtual Circuit in the middle. Smart PVCs are more robust than PVCs. If a link carrying a PVC goes down, then the circuit goes down. If a link carrying a Smart PVC goes down and there is an alternate mute, then the originating switch
automatically reroutes the Smart PVC around the link. As a result of the rerouting, the network may not be able to deliver the promised quality of service as it was negotiated in the contract. The network may have to change the quality of service parameters negotiated for other connections.
One of the current research directions solves the rerouting problem by using Distributed Artificial Intelligence approaches to select between altemative rerouting plans
[2].
We also presented a rerouting algorithm in [3] using a search algorithm. The objective of the search algorithm is to find a restoral path with the least cost. Although the performance of the algorithm was analyzed in [3] by estimating its space and time complexity, we are going to measure and predict its performance in an environment that is close to a real network. The paper presents a modeling environment by using the Comnet simulation modeling tool by CACI that is appropriate to validate the theoretical results in [ 3 ] and other distributed network algorithms. The goal of simulation modeling of Smart PVCs is torepresent the topology and functions performed by the
. switches,
obtain statistical results about the algorithm’s and network’s performance, and
build a tool set for modeling other problems related to the Fast Resource Management issues in ATM networks. The rest of this paper is organized as follows: Section 2
contains an overview of the search algorithm. Section 3 describes the simulation techniques. The results of the algorithm’s and network‘s performance are presented in Section 4 followed by the conclusion.
2. OVERVIEW OF THE SEARCH ALGORITHM
For illustration we use the topology of Figure 1.
C
F
Figure 1. Network topology and link failure between switches B a n d E
A, B, C, D, E, F, G, and H denote the switches. A and H are the two endpoints of a PVC {A, B, E, H}. We assume a link failure between B and E. The rerouting process is initiated by switch A that established the circuit before the failure. A sends a request to restore the PVC to adjacent switches along with an upper bound on the rerouting cost and the circuit characteristics, such as service categories, traffic parameters, and quality of service parameters. A switch is qualified if it has been able to restore similar circuits in previous cases. The switches compute the estimated cost of each of the activities associated with the rerouting process, such as the allocation or reallocation of network resources, rerouting existing but lower priority connections, and reestablishing interrupted connections. These cost estimates are sent back to A, which will select the route with the smallest cost estimate, e.g., via D.
The selection of a switch is based on a performance parameter P which is a measure of a switch's inefficiency (as calculated by its predecessor switch along the rerouting circuit) based on its previous reroutings. Small (close to zero) values of P
indicate high quality and efficiency, and high values indicate that the switch is unreliable and unstable
in
rerouting the circuit. A switch's P value is recalculated after each circuit rerouting by that adjacent switch which senta
rerouting request to it. The recalculation is based on the statistical evaluation of the switch's estimated and actual restoration costs [12]. The motivation for using P is to enable the search process to learn from past performances and use this knowledge to select the most efficient rerouting switches.The process continues recursively. At each recursive step a switch uses three arguments: the circuit number, the subsequent site, and the upper bound on the restoral cost. Each step expands the path by those children through which the estimated restoral costs do not exceed the upper bound. Each step returns the estimated cost along the path to a child, replacing parent values with the minimum of the estimated costs via the last children expanded, going back along the path, until a better cost estimate is reached. Then, the procedure continues along that path. After a recursive step this cost value will be equal to the minimum estimated cost path to the last child along the expanded subtree.
Once the destination H is reached the process stops. The rerouted circuit is along the return path of the recursive steps. Selection of the rerouted circuit by the participating switches is based on cost estimates and information about the switches' previous performance. Since at each step the estimated least-cost path is selected, the resulting restoral path
is the expected least-cost path or close to it. It can be proved that the above algorithm always finds the least-cost rerouting circuit if some conditions are met [7].
3. SIMULATION TECHNIQUES
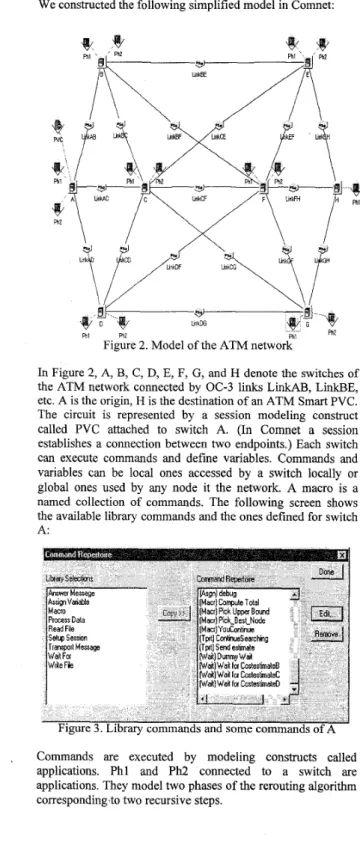
We constructed the following simplified model in Comnet:
hl ph2
Figure 2. Model of the ATM network
In Figure 2, A, B, C, D, E, F, G, and H denote the switches of the ATM network connected by OC-3 links LinkAB, LinkBE, etc. A is the origin, H is the destination of an ATM Smart PVC. The circuit is represented by a session modeling construct called PVC attached to switch A. (In Comnet a session establishes a connection between two endpoints.) Each switch can execute commands and define variables. Commands and variables can be local ones accessed by a switch locally
or
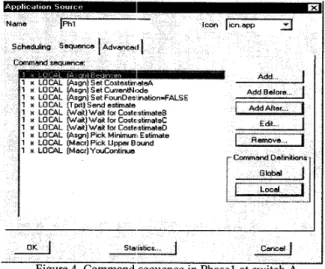
global ones used by any node it the network. A macro is a named collection of commands. The following screen shows the available library commands and the ones defined for switch A:, Commands are executed by modeling constructs called
applications. Phl and Ph2 connected to a switch are applications. They model two phases of the rerouting algorithm corresponding 'to two recursive steps.
The next screen for in:stance, depicts the order of Phl’s commands at switch A:
1 x LOCAL WaR1 Wait for CostcstimteC
1 x LOCAL (Wait] Walt for CostcstimateD
1 x LOCAL [Asgnl Ptck Mirumurr Esttmte
1 x LOCAL [Macr) Ptck Uppsr Bound
1 x LOCAL [Macr]YouConttrua
Phasel at switch A sequence in Phasel at switch A We give a brief explanation of some commands. For specific details please see [4]. The “Set CostestimateA“ command assigns the initial estimated value of A to the global variable “CostestimateA”. “Set CurrentNode” sets the global variable “CurrentNode” to “A” to find the backward path from the destination H. “Send Est mate” transport command multicast the “Send Estimate” message to A’s neighbors. “Wait for CostestimateB command waits for an “Answer with CostestimateB message from switch B. “Pick Minimum Estimate” computes the smallest estimated costs of the neighbors. The “Pick Upper Bound” macro computes the upper bound in the recursive step of the search algorithm. “YouContinue” will redirwt the search path to the switch with the minimum estimated cost. The next screen displays the commands executed in Dhiise two bv the Ph2 aDDlication: II
Ph2 is scheduled to run upon the receipt of the message “Answer with Total CostEstimate” sent by the neighbors after the first recursive step in the search algorithm. Ph2 either redirects the search path or terminates the algorithm. The “Dest Found AND MyEst<=MinEst” implements this decision. Phase 2 terminates if the destination has been found and A’s estimate (MyEst) is still the least estimated cost among others. Otherwise the search algorithm continues via the switch with the least-cost estimate. Intermediate switches act similarly. They execute commands corresponding to the rest of the search algorithm. There are few commands specific to intermediate switches as it is shown in Figure 6. For instance, the “BackwardiForward Chain” macro in Phl of switch D
maintains a list of neighboring switches to keep track of the search path. The “Answer with CostestimateD command in switch D answers to the message “Send Estimate” sent earlier by one of its neighbors.
Name ]Phl P
1 x LOCAL (?ptt)Send estimate 1 x LOCAL CJr’aii) WaltlorCostesbmateC 1 x LOCAL watt) WlutlorCoSteSbmateF
1 x LOCAL &Vat) WlutlorCostesbmateG
1 x LOCAL (Asgn) Plck Minimum Estimate
1 x LOCAL (Mau)YouCnntinua
1 x LOCAL (Asgn) Set Done
I
-CommandDefinmons -
Global
I
I
_]
&PMcfosoffWord-ad ] I ~ C O M N E T l I I - BnpFigure 6 . Commands of Phase 1 at intermediate switch D
The macro “Answer Total” in the next figure returns the total estimated cost of the current search path.
The links are constant rate ATM connections:
After a random period of time LinkBE fails:
The traffic policing parameters are defined as follows:
The failure triggers the execution of the recursive steps of the rerouting algorithm implemented by applications Phl and Ph2 at switch A. The numbers in the following screen indicate the estimated least-cost rerouting path. The PVC is switched to path ADFH with total estimated-cost
1
1.The simulation starts with establishing a Smart PVC between A
and H. The small animated rectangle on LinkBE shows the data flow along the ABEH path:
4. PERFORMANCE MEASUREMENT
In order to measure the performance of the rerouting algorithm we collect the following statistics for demonstration purposes:
Number of messages generated during the rerouting Application run time to find a new route. The rerouting time should be small relative to the message delay. Link utilization by the applications
process.
First, we compare the PVC setup time between the source and destination switches and the time needed to find a new route. The rerouting time should not be significantly greater than the setup delay. The figure below indicates that the setup time is around 0.003 second.
Setup De1.y Dom A (pVQ to H
1 .lmooooo
"""1
I
O.0OSO 0.0026 I 0.0010 -o.O-l
0.0000Figure 13. Setup delay between A and H
The execution of Phl and Ph2 took 0.007 seconds in simulation time.
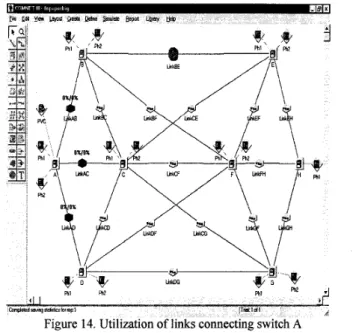
Another measurement that characterizes the algorithm's performance is link utilization. A low link utilization indicates that the rerouting algorithm doesn't generate excessive traffic on the network. On the next figure we printed only the utilization of the links connected to switch A. Close to 0% utilization indicates that the rerouting algorithm requires only insignificant portion of the bandwidth (The precise value is 0.01%):
Similarly, the number of messages created during the rerouting algorithm can be considered as a measure of performance. LOW number of messages is the indication of low algorithm's overhead.
The numbers above the switches in the following figure show the total number of messages created during the algorithm:
5. CONCLUSION
We presented a modeling technique to predict the performance
of Smart Permanent Virtual Circuits in ATM Networks. We applied the Distributed Software Module of the simulation modeling system CACI Comnet. The technique can be applied in other distributed systems where there is a need to measure the performance of network algorithms. The same technique can also be used to validate the theoretical results on performance parameters of distributed algorithms and systems.
6 .
REFERENCES
ForeRunner ATM Switch Configuration Manual, FORE Systems, Inc., MANU0066, March, 1996
Conry, S., Kuwabara, K., Lesser, V., “Multistage Negotiation for Distributed Constraint Satisfaction,”
IEEE Transactions on Systems, Man, and Cybemetics, Vol. 21, No. 6, NovemberDecember 1991, pp.1462-
1477.
Tibor Gyires, “Smart Permanent Virtual Circuits in Asynchronous Transfer Mode Networks,” Proceedings of the 1997 IEEE Intemational Conference on Systems, Man, and Cybernetics, October 12-15, Orlando, Florida, Comnet 111, Planning for Network Managers, Release 1.4, 1997 CACI Products Company, 3333 North Torrey Pines Ct., La Jolla, California 92037
Tibor Gyires, “Intelligent Routing Agents in Wide-Area Networks,” in “Intelligent Agents for Telecomm- unications Applications,” edited by: H. Velthuijsen (KPN Research, The Netherlands) and S. Albayrak (Technical University of Berlin, Germany), 10s Press, 1997. Leland, W., Taqqu, M., “On the Self-similar Nature of the Ethemet Traffic,” IEEE Transactions on Networking, Vol. 2, no. 1, February 1994, pp.1-15. Korf, R., E., “Iterative-Deepening-A* : An Optimal Admissible Tree Search,” Proceedings of the Ninth International Joint Conference on Artificial Intelligence, Dechter, R. and Pearl, J., “The optimality of A* revisited,” Proceedings of the National Conference on Artificial Intelligence, Washington, DC, August, 1983, Durfee, E., “Coordination of Distributed Problem Solvers,” Kluwer Academic Publishers, 1988.
Korf, R., E., “Depth-First Iterative-Deepening: An Optimal Admissible Tree Search,” Artificial Intelligence, Bond, A., and Gasser, L., “Readings in Distributed Artificial Intelligence,” Morgan Kaufmann Pub. Inc.,
1988.
Tibor Gyires and Krishnan Muthuswamy, “A Bidirectional Search Approach for Restoring Circuits in Communication Networks,” Winter 1997 issue of The Journal of Computer Information Systems, pp. 85-95. Sycara, K., Roth, S., Sadeh, N., and Fox, M., “Distributed Constrained Heuristic Search,” IEEE
pp. 4460-4464.
UCLA, August 18-23, 1985, pp. 1034-1036.
pp. 95-99.
Vol. 27, 19985, pp. 97-109.
Transactions on Systems, Man, and Cybemetics, Vol. 21, No. 6, Novembermecember 1991, pp. 1446-1461.