HAL Id: cea-01908268
https://hal-cea.archives-ouvertes.fr/cea-01908268
Submitted on 30 Oct 2018
HAL is a multi-disciplinary open access
archive for the deposit and dissemination of
sci-entific research documents, whether they are
pub-lished or not. The documents may come from
teaching and research institutions in France or
abroad, or from public or private research centers.
L’archive ouverte pluridisciplinaire HAL, est
destinée au dépôt et à la diffusion de documents
scientifiques de niveau recherche, publiés ou non,
émanant des établissements d’enseignement et de
recherche français ou étrangers, des laboratoires
publics ou privés.
Prospects in China for nuclear development up to 2050
Yanxin Chen, Guillaume Martin, Christine Chabert, Romain Eschbach, Hui
He, Guo-An Ye
To cite this version:
Yanxin Chen, Guillaume Martin, Christine Chabert, Romain Eschbach, Hui He, et al.. Prospects in
China for nuclear development up to 2050. Progress in Nuclear Energy, Elsevier, 2018, 103, pp.81
-90. �10.1016/j.pnucene.2017.11.011�. �cea-01908268�
Contents lists available atScienceDirect
Progress in Nuclear Energy
journal homepage:www.elsevier.com/locate/pnucene
Prospects in China for nuclear development up to 2050
Yanxin Chen
a,b, Guillaume Martin
b,∗, Christine Chabert
b, Romain Eschbach
b, Hui He
a, Guo-an Ye
aaDepartment of Radiochemistry, China Institute of Atomic Energy, PO. 275- 26, Beijing, 102413, China bCEA, DEN, DER, F-13108 Saint-Paul-lez-Durance, France
A R T I C L E I N F O
Keywords:Scenario China
Nuclear fuel cycle 2050
FBR Reprocessing
A B S T R A C T
An ambitious plan for nuclear development exists for long in China. The study of scenarios with prospect of 150 GWe to 400 GWe in 2050 is carried out using the COSI6 simulation software, and aims at analyzing the evolution of nuclear energy currently planned in China. Results rely on natural uranium supplies, fuel fabrication, spent fuel reprocessing, quantities of proliferating materials and the opportunity of a rapid deployment of fast reactors (FBR). It seems impossible for China to start two fast reactors before 2020 without any external source of plutonium. Anyway, FBR may represent at the most around 30% of the total nuclear capacity in the country by 2050. Indeed the deployment of FBR only can start from 2035 to 2040. Finally, the pace of FBR development should be controlled carefully by the proportion of FBR and PWR with respect to the reprocessing capacity. Natural uranium savings appear rather low by 2050, because the transition toward a fast reactorfleet in-dependent from uranium ore lasts decades. However, this independence may be reached by the end of the century, before uranium resources are dwindling, if thefirst corners to close the fuel cycle are turned in the next decade.
1. Introduction
With the rapid development of the Chinese economy, the energy demand has been increasing year by year from the beginning of the 21st century. The average electricity consumption in China is about 4000 kWh per person per year at present, but may reach 7000 kWh by the end of the year 2050, assuming an increase ratio of 1.6% annually (CNPC Economics and Technology Research Institute, 2015). Fossil fuels (especially coal) have been used as the main energy resource to meet the energy demand in China up to now. This has detrimental ef-fects on environment and people life conditions, such as global warming and air pollution. In order to decrease CO2emissions in the
future and alleviate the pressure on the environment caused by fossil fuel consumption, new energies have to be economically feasible, en-vironmental friendly, publicly acceptable, and implementable at a large scale. In this respect, nuclear energy constitutes a top-ranking option for China (Zhou, 2010; Yi-chong, 2008; Zhou and Zhang, 2010; Zhou et al., 2011), along with renewable sources of energy. Indeed, to solve air pollution issues, nuclear power can efficiently balance the inter-mittency of renewables without increasing GHG emissions.
In 1996, the China National Nuclear Company (CNNC) forecasted that China would reach 150 GWe by 2050 (Suttmeier and Evan, 1996; Rothwell, 2001). The Medium and Long-term Nuclear Power Develop-ment Plan (2005–2020) planned in 2006 that China's nuclear capacity
would rise to about 40 GWe by 2020 (NDRC). Three years later, the status of Chinese nuclear energy development shifted from“active” to “aggressive” (Guobao, 2009). In 2011, the Chinese Academy of En-gineering (CAE) predicted that nuclear power capacity would be 200 GWe in 2030 and 400 GWe in 2050 (CAE-Chinese Academy of Engineering, ). But, because of the Fukushima accident, the State Council of China suspended new civilian nuclear projects and ordered safety inspections of all nuclear power plants in operation and under construction.
Over one year later, China restarted nuclear plants and approved a new Medium and Long term Nuclear Power Development Plan (2011–2020) which outlined its goal of increasing the nuclear capacity to about 58 GWe by 2020, with 30 GWe of reactors under construction to this term (National Development and Reform Commission). There is currently no official target for nuclear energy after 2020, but a few growth prospects have been proposed in the literature (Yi-chong, 2008; Mi, 2008; Energy Research Institute, 2010; Zhou, 2011; Chen et al., 2012; Fiori and Zhou, 2015a, 2015b), in which the installed nuclear capacities are between 150 GWe and 500 GWe in 2050. By 2030 and by 2050, nuclear power is expected to contribute respectively to 15% and 22% of the Chinese electricity production (CNPC Economics and Technology Research Institute, 2015).
The issue for China is not whether the country will expand its nu-clear energy programme; rather it is about the speed at which this
https://doi.org/10.1016/j.pnucene.2017.11.011
Received 19 July 2017; Received in revised form 2 October 2017; Accepted 21 November 2017
∗Corresponding author.
E-mail address:guillaume.martin@cea.fr(G. Martin).
Progress in Nuclear Energy 103 (2018) 81–90
0149-1970/ © 2017 Elsevier Ltd. All rights reserved.
expansion should occur. If China would have decided to operate its nuclear fleet according to a “one-through” cycle in the future, how much natural uranium and interim storage capacity of unloaded spent fuel (SF) would be needed? If the nuclear fuel cycle is being closed, how make a reasonable use of Pu and limit the proliferation risks? What may be the short-term alternative strategies if FBR are further delayed? In order to solve the above challenges so as to ensure a sustainable de-velopment of nuclear energy in China, it is necessary to have a complete overview of the nuclear energy development in this country. To this aim, this study has been carried out with the COSI6 simulation software (Coquelet-pascal et al., 2015), to compare several scenarios built with great care as regards the level of details.
2. Nuclear industry in China
2.1. Current situation
China has aimed at closing its nuclear fuel cycle (seeFig. 1) as soon as it has decided to develop its nuclear power, in the early 1980s (Zhou, 2011). Pressurized water reactors (PWR) have beenfirst deployed, and China is facing a considerable spent fuel accumulation. Qingshan Phase I and Dayabay sites have recently accumulated SF in excess to their storage capacity. Dense-pack racks are now used, but at least 104 ir-radiated assemblies were sent from Dayabay to an interim storage pool at the pilot-scale reprocessing plant (Zhou, 2011), which capacity is limited to 550 tHM (Guoqing, 2010). Therefore, the SF interim storage is becoming a critical issue for China.
A commercial reprocessing plant should be built soon to recycle spent UOX: extracted U & Pu would be used to fabricate MOX fuel for fast reactors (FBR) and/or PWR (Fiori and Zhou, 2015b). With enough SF and reprocessing capacity, the nuclear power plants (NPP) may gradually switch to FBR only, and accelerator-driven systems might be used to burn nuclear wastes (Fiori and Zhou, 2015a).
By the end of 2014, China operated different types of PWR and sets about developing FBR. 23 NPPs with total installed capacity of 19 GWe were in operation, including an experimental FBR of 25 MWe named CEFBR. Other 28 PWRs with total installed electrical capacity of 30 GWe were under construction. More information about Chinese NPPs can be found in the IAEA website (IAEA). The construction period of PWR is 5–6 years in China. 10 PWRs built in 2010 demonstrated that the capability of NPP construction, equipment manufacturing and technician training notably meets the challenge of a rapid nuclear en-ergy development. Imported reactors are M310 3-loop PWR and EPR from France (Martin and Girieud, 2016), VVER AES 91 from Russia, CANDU 6 from Canada and AP1000 from USA. At present, China has developed its own types of PWR: CNP-300, CNP-600, CNP-1000, CPR-1000, CAP1400 and Hualong I, now mature for export (China's nuclear
export drive, 2017). A prototype of high temperature gas-cooled reactor (HTGR) of 210 MWe designed in-house by INET (Tsinghua University) should reach criticality before 2020.
For the front-end of nuclear fuel cycle, according to IAEA (IAEA, 2014), uranium resources in China totalize 265,500 tHM. Besides that, China National Nuclear Overseas Uranium Resources Development company (NNOURD) was set up to seek out and invest in overseas re-sources in 2006. It has secured over 200,000 tHM reserves in total in Africa, Australia, Canada, and Central Asia (Zhou, 2011). China General Nuclear Power Corporation (CGNPC) also invested in a uranium mining project in Kazakhstan in 2009. In addition, AREVA and CAMECO signed nuclear fuel agreements with CGNPC to supply low-enriched uranium fuel for the next decades (IAEA, 2014; WNN, 2010). Identified natural
uranium resources recoverable at costs lower than 130 USD/kgU (50 USD/lb of U3O8) are 5,902,900 tU in 2013 according to IAEA (IAEA,
2014).
Three uranium conversion plants each with annual capacity of 500–800 tU have been in operation from 2002 (Energy Research Institute, 2010; WNN, 2010). Another conversion plant with annual capacity of 3000 tU is in operation from 2008 (CAEA, 2008). According to (Zhou, 2011), there are two enrichment plants with more than 1.5 million separative work units (SWU) per year in China. Two nuclear fuel manufacturers (in Yibin and Baotou) currently provide nuclear fuel assemblies (over 1,200tHM/year). A pilot-scale MOX fabrication plant with an annual capacity of 0.5 ton has just been completed.
For the back-end of nuclear fuel cycle, the State Council approved in 1986 the construction of a pilot-scale test reprocessing plant with an-nual capacity of 50 tHM in Gansu province (Zhou, 2011). A hot test has been successfully performed in December 2010 (CNNC, 2010), but the plant is currently under improvement for 3 years (Zhongmao, 2014). The advanced two-cycle PUREX process is employed to recover U and Pu, and trans-uranics in the PUREX raffinate are partitioned by means of TRPO process (Zhu et al., 1992). The partitioned mixture of Am, Cm and lanthanides (Ln) may be further separated by the Cyanex 301-based process if the separated plutonium elements are stored for trans-mutation (Chen et al., 1996). The raffinate, HLLW (high level liquid
wastes) andfission product lanthanides will be immobilized in glass packages using a process similar to the one used in France (Tiphine et al., 2015).
2.2. Prospects for nuclear development after 2020
Reprocessing plants and FBR are the key facilities for China to close the nuclear fuel cycle. In this objective, the design of the demonstration FBR CFR-600 (Yang et al., 2015), which should be built in XiaPu, Fujian province, has recently been completed. Two Russian BN-800 reactors (FBR of 800 MWe) are planned for construction at Sanmin and should U Purification & Conversion U Mine U Mill 235U Enrichment Depleted U Reactor Fuel (target) Fabrication Nuclear Weapons Blend Down U U Pu U
Reactor Chemical Reprocessing
Interim Spent Fuel Storage(Wet) Interim Spent Fuel Storage (dry)
Closed
Fuel
Cycle
Fresh Fuel Or Target SF or Irradiated target SF or Irradiated target U and/or Pu SF SF U Pu Interim HLW Storage (Tank) HLW HLW Processing HLW Immobilization HLW HLW Geologic Disposalhave initially been commissioned in 2018-19, but now a delay of few years is expected (Fiori and Zhou, 2015a). After that, the CDFBR of 1000 MWe is expected to reach criticality in 2025. Then the CDFBR of 1200 MWe, with a breeding ratio of 1.2, is projected for 2028, followed in 2030 by thefirst commercial fast reactor of 1000 MWe called CCFBR, which might be supplied with metal fuel (National Development and Reform Commission; Chen et al., 2012; Fiori and Zhou, 2015a).
According to Chen et al. (2012), the first large commercial re-processing plant based on the current PUREX process will be put into operation around 2025. At the same time, a demonstration plant based on advanced reprocessing technologies will be commissioned, with a capacity of 400 tHM/yr at the most. The second large commercial re-processing plant and a pilot rere-processing plant for FBR SF should start around 2035. The planned schedule is summarized inFig. 2.
3. Simulation
3.1. CEA nuclear fuel cycle simulation platform
COSI is a scenario code developed by CEA, Cadarache, France, since 1985 (Coquelet-pascal et al., 2015). It simulates afleet of NPPs and the associated fuel cycle facilities. COSI was designed to study short, medium and long-term options for the introduction of various types of nuclear reactors. In the frame of the French Act for waste management, scenario studies are carried out with COSI.
The flow scheme of COSI is illustrated in Fig. 3. COSI physical models are detailed in (Coquelet and Kieffer, 2011): the evolution calculation is performed by a coupling with CESAR (Simplified Evolu-tion Code Applied to Reprocessing) (Vidal et al., 2012), which is the reference code used at the AREVA La Hague reprocessing plant. CESAR calculates notably the isotopic composition of irradiated fuels from their initial isotopic composition, fuel burn up and irradiation time. The neutronic data libraries (cross sections) employed by COSI to fulfill the above calculation are calculated by the CEA reference codes for neutron physics: APOLLO2 (Santamarina et al., 2009) for thermal spectrum systems and ERANOS (Rimpault et al., 2002) for fast spectrum systems.
3.2. Reactor data
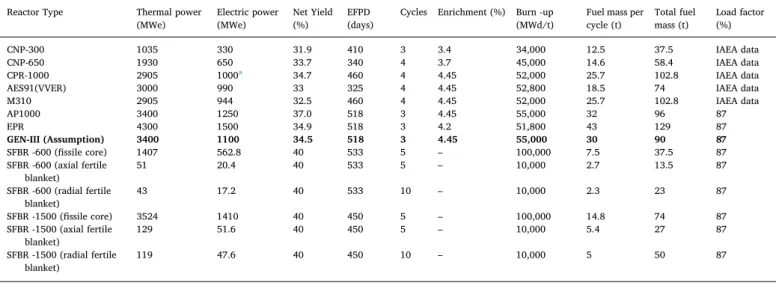
The neutronic data libraries employed by COSI are here derived from French PWR and FBR core concepts. French PWR should well approximate Chinese reactors because most of PWR under operation and construction are designed on the basis of M310, imported from France. Chinese commercial FBR is currently still being designed. The reactor characteristics initially used for the simulations are summarized inTable 1. Most of them are quoted from the IAEA website (IAEA). A representative PWR named GEN-III shown inTable 1will be used to simulate any PWR started after 2020. PWR and FBR reactors operating or planned in the future that are used as input parameters in the si-mulation model are all under or going to be under IAEA safeguards.
2010 The pilot reprocessing plant with 50 tons/year (PUREX) 2011 The first FBR 25 MWe (CEFR) 2018-19 Two BN-800 800 MWe (CDFR) 2025 The first commercial reprocessing plant with 800 tons/year (PUREX) The demonstration plant with 400 tons/year (NEW)
2025 One FBR designed by China 1000 MWe (CDFR) 2028 One FBR 1200MWe BR=1.2 (CDFBR) 2030 One FBR with 1000MWe Metal fuel (CCFR) 2035 The pilot reprocessing plant for FBR SF (Dry) The second reprocessing
plant Under construction
The pilot- scale MOX manufacturing facility with annual capability
of 0.5 tons
Fig. 2. Planned reprocessing plants and FBR development in China.
Fig. 3. COSI6flow scheme.
Y. Chen et al. Progress in Nuclear Energy 103 (2018) 81–90
3.3. Scenarios
Four scenarios in terms of electricity production have been studied. Two values of installed nuclear electrical capacity for 2020 have been used: 58 GWe (National Development and Reform Commission) and 70 GWe (CAE-Chinese Academy of Engineering). The scenario D comes to 150 GWe in 2050 (Suttmeier and Evan, 1996; Rothwell, 2001) whereas scenario A reaches 400 GWe (CAE-Chinese Academy of Engineering; Chen et al., 2012; Fiori and Zhou, 2015a, 2015b). The scenarios B and C (Mi, 2008; World Nuclear Association, 2015; Evans et al., 2015) stand between, with 300 GWe and 200 GWe respectively. Assuming a linear growth from 2020 to 2050, the curves of nuclear electrical capacity can be dawn inFig. 4. Since the total electricity demands by 2050 should be 12,000–15,000 TWhe according to the data published by NEA (Chinese
National Energy Administration), the electrical production for scenarios A, B, C and D accounts for 21–26%, 15–19%, 10–13% and 8–10% of the total electricity demand, respectively.
Three different options, namely “one-through” way (OTC), “Pu re-cycled in PWR” and “Pu recycled in FBR”, which are illustrated in
Figs. 5–7, have been simulated. The evolution of the Chinese nuclear fleet during the 4 scenarios A, B, C and D is presented inTable 2. There are 52 PWRs which should be in operation or under construction before 2020: detail information can be found in the IAEA website (IAEA). All newly built PWRs are CPR-1000 reactors in scenarios A and B before 2020, and GEN-III reactors after. All FBRs are SFBR-1500 reactors, except 2 SFBR-600 built in 2025.
In the case of Pu recycled in PWR, there are always 13 PWRs and 2 SFBR-600 loaded with MOX fuel, with one reprocessing plant with a capacity of 800 tHM/year commissioned in 2025. The number of PWRs loaded with MOX fuel is determined by the annual Pu output from the reprocessing plant. This output is approximately 8 tons. According to the calculated results, 13 PWRs cannot be loaded with MOX fuel in 2026, so that some of them are loaded with MOX fuel in 2027.
In short, here are the applied assumptions used to simulate the scenarios, which start from the beginnings of the nuclear power in China (1991):
1. After 2020, only GEN-III PWR and FBR are commissioned. 2. The FBR and reprocessing plants are developed as planned inFig. 3
when applying the“Pu recycled in FBR” strategy.
3. SFBR-600 substitute for BN-800 and SFBR-1500 for CDFBR, CDFBR and CCFBR shown inFig. 2. All FBR have a breeding ratio of around 1.2.
4. The cooling time in onsite pool is 5 years for UOX SF and 3 years for MOX SF (i.e. 1 year more than in (Gao et al., 2015)). Because MOX SF cool down only for 3 years before reprocessing, the radiolysis of the TBP extractant is likely to occur due to high radioactivity. Therefore, some new technology like high-temperature electrical
Table 1
Simulation parameters of reactors in China (in bold are defined the mean characteristics of PWR after 2020). Reactor Type Thermal power
(MWe) Electric power (MWe) Net Yield (%) EFPD (days)
Cycles Enrichment (%) Burn -up (MWd/t)
Fuel mass per cycle (t) Total fuel mass (t) Load factor (%) CNP-300 1035 330 31.9 410 3 3.4 34,000 12.5 37.5 IAEA data CNP-650 1930 650 33.7 340 4 3.7 45,000 14.6 58.4 IAEA data CPR-1000 2905 1000a 34.7 460 4 4.45 52,000 25.7 102.8 IAEA data
AES91(VVER) 3000 990 33 325 4 4.45 52,800 18.5 74 IAEA data M310 2905 944 32.5 460 4 4.45 52,000 25.7 102.8 IAEA data AP1000 3400 1250 37.0 518 3 4.45 55,000 32 96 87 EPR 4300 1500 34.9 518 3 4.2 51,800 43 129 87 GEN-III (Assumption) 3400 1100 34.5 518 3 4.45 55,000 30 90 87 SFBR -600 (fissile core) 1407 562.8 40 533 5 – 100,000 7.5 37.5 87 SFBR -600 (axial fertile blanket) 51 20.4 40 533 5 – 10,000 2.7 13.5 87 SFBR -600 (radial fertile blanket) 43 17.2 40 533 10 – 10,000 2.3 23 87 SFBR -1500 (fissile core) 3524 1410 40 450 5 – 100,000 14.8 74 87 SFBR -1500 (axial fertile blanket) 129 51.6 40 450 5 – 10,000 5.4 27 87 SFBR -1500 (radial fertile blanket) 119 47.6 40 450 10 – 10,000 5 50 87
aThe value used to simulate the scenarios is 944 (see section4.1).
2015 2020 2025 2030 2035 2040 2045 2050 0 50 100 150 200 250 300 350 400
]e
W
G[-yti
ca
pa
C
la
cir
tc
el
e
ra
el
cu
n
del
lat
sn
I
Year
Scenario A - 400 GW Scenario B - 300 GW Scenario C - 200 GW Scenario D - 150 GWFig. 4. Various evolutions of the nuclear power up to 2050.
U Purification
& Conversion U Mill U Mine
235U Enrichment
Deplete
dU
Reactor Fuel
(target) Fabrication PWR Interim Spent Fuel Storage Geologic Disposal
chemistry reprocessing might be put into use if this cooling period applies.
5. Material losses in conversion, enrichment, fabrication, reprocessing, MA separation and transmutation are neglected.
4. Results and discussion
4.1. Calculation assessment
The simulated electricity production between 2000 and 2014 has been compared with the data from the National Bureau of Statistics (NBS) of the People's Republic of China and from IAEA. The results are
U Purification & Conversion U Mine U Mill 235U Enrichment Depleted U
UOX Fuel Fabrication
PWR Chemical Reprocessing Interim Spent Fuel Storage
UOX SF Interim HLW Storage (Tank) HLW HLW Processing HLW Immobilization HLW HLW Geologic Disposal MOX Fuel Fabrication Reprocess U and Pu
Interim Spent Fuel Storage (No reprocessing)
MOX SF
Fig. 6.“Pu recycled in PWR”.
U Purification & Conversion U Mine U Mill 235U Enrichment Depleted U
UOX Fuel Fabrication
PWR
Chemical Reprocessing Interim Spent Fuel Storage
UOX SF Interim HLW Storage (Tank) HLW HLW Processing HLW Immobilization HLW HLW Geologic Disposal MOX Fuel Fabrication
Reprocess U and Pu
Fertile Blanket FBR
MOX SF
ADS
Fig. 7.“Pu recycled in FBR”.
Table 2
Distribution of PWR and FBR for all the simulations in 2050.
Scenario OTC Pu recycled in PWR Pu recycled in FBR A 52 PWR +313 GEN-III 352 PWR +13 PWR loaded with MOX +2 SFBR-600 246 PWR +94 FBR B 52 PWR +222 GEN-III 261 PWR +13 PWR loaded with MOX +2 SFBR-600 194 PWR +64 FBR C 52 PWR +140 GEN-III 179 PWR +13 PWR loaded with MOX +2 SFBR-600 133 PWR +45 FBR D 52 PWR +95 GEN-III 134 PWR +13 PWR loaded with MOX +2 SFBR-600 100 PWR +35 FBR 2000 2002 2004 2006 2008 2010 2012 2014 0 20 40 60 80 100 120 140 160 180
]r
ae
y/
eh
W
T[
-noi
tc
ud
or
pl
aci
rt
cel
E
Year
IAEA Data NBS DataCalculated Data (CPR1000 with 944 GW) Calculated Data (CPR1000 with 1000 GW)
Fig. 8. Electricity production up to 2014.
1992 1994 1996 1998 2000 2002 2004 2006 2008 2010 2012 2014 0 400 800 1200 1600 2000 2400 2800
]
M
Ht
[
-F
S
det
al
u
mu
c
fo
se
ss
a
M
Year
Onsite SF Offsite SF Total SFFig. 9. Cumulated SF calculated by COSI up to 2014 (without CANDU SF). Y. Chen et al. Progress in Nuclear Energy 103 (2018) 81–90
presented inFig. 8.
The calculated datafit quite well with the NBS data and IAEA data from 2000 to 2009, but the simulated results are around 20% higher than the NBS data from 2010. Most of the new PWR from 2010 are CPR-1000 which is designed on the basis of M310. According to the IAEA website (IAEA), its power is equal or beyond 1000 MWe. However, the deviation with the NBS data decreases strongly when the nuclear power of M310 (944 MWe) is employed in the calculation to simulate CPR-1000 as shown inFig. 8. Therefore CPR-1000 wasfinally set to deliver 944 MWe in the simulations. The cumulated SF calculated by COSI is illustrated inFig. 9, which does not include SF unloaded from CANDU reactors, since they are not reprocessed.
The spent fuel accumulated from Chinese reactors from 1991 to 2010 is about 1300 tHM according to (Guoqing, 2010). The total mass of SF by the end of the year 2010 is 1408 tHM, which is rather con-sistent with the data reported in the literature.
4.2. Reprocessing and Pu inventory
In order to keep the Pu inventory as low as possible, notably as regards proliferation issues, the reprocessing capacity increases in concert with the needs in MOX fuel, i.e. with the installed power of FBR in the case of the“Pu recycled in FBR” strategy. The proportion of FBR in power ratio is shown inFig. 10, and the capacities of UOX SF re-processing and MOX SF rere-processing plants are reported inFig. 11. The separated Pu stocks for each scenario are shown inFig. 12.
The results show that FBR may account for around 25–30% of the total installed nuclear capacity by 2050. Such a ratio is an upper limit,
and should however constitute a difficult challenge to reach.Fig. 12
reveals an accumulation of plutonium between 2025 and 2035. What-ever the progress of nuclear power is, the scheduled reprocessing ca-pacity of 1200 tHM/yr in this period is particularly high in all the scenarios: the Pu in excess should be recycled in PWR or the re-processing capacity reduced during this period. The Pu extracted from PWR SF remains the main resource to support the FBR development, but when no new PWR starts (from 2035 or 2040), the Pu extracted from PWR SF does not suffice to meet the demand of FBR.
4.3. Natural uranium
The one-through way is representative of the current situtation in China, because there is no reprocessing plant or commercial FBR yet. This section discusses the results of the calculation as regards the de-mand of natural uranium, if China would have decided to deploy only PWR following“one-through” way. The results from the different sce-narios are illustrated inFig. 13.
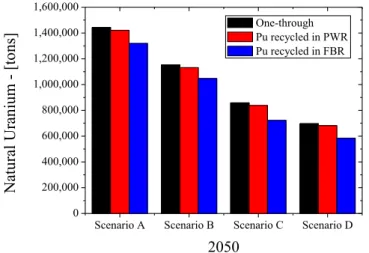
The cumulative demands of natural uranium for each scenario are near 700,000 tons at least and 1,500,000 tons at the most. Assuming uranium resources in China are consumed in priority (265,500 tons, see section2.1), they dry up in 2030 for scenario D and in 2025 for scenario A. Besides, the consumed natural uranium of each scenario in 2050 will take 11.8%, 14.5%, 19.5 and 24.4% of total low-cost uranium resources in the world respectively (5,902,900 tons, see section2.1). The price of uranium ore and its derivatives may significantly increase, since the number of PWR should rise all over the world up to 2050.
By the end of the year 2050, the demands of natural uranium for each scenario option are reported inFig. 14. Compared with the “one-through” option, the cumulative consumption of natural uranium is reduced in“Pu recycled in PWR” and “Pu recycled in FBR” options.
Uranium savings are shown inTable 3. This table reveals rather low uranium savings by 2050. When thefleet will be composed of fast re-actors only, as in (Gao et al., 2017), China could however emancipate totally from natural uranium resources. But the last PWR shall not be shut down before 2095 or 2100 if they are in operation for 60 years. The transition period toward the independence from uranium ore ap-pears actually very long, which explains relatively low uranium savings by 2050. These results plead thus for a fast FBR deployment in China, since the natural uranium consumption will continue long after 2050 even in this case, implying a considerable tension on this resource by the end of the 21st century. The transition toward a closed fuel cycle should start as soon as possible in these conditions. If tensions none-theless appear on uranium resources, recycling plutonium once in PWR as in France could lead to significant savings at competitive costs (Gao et al., 2017).
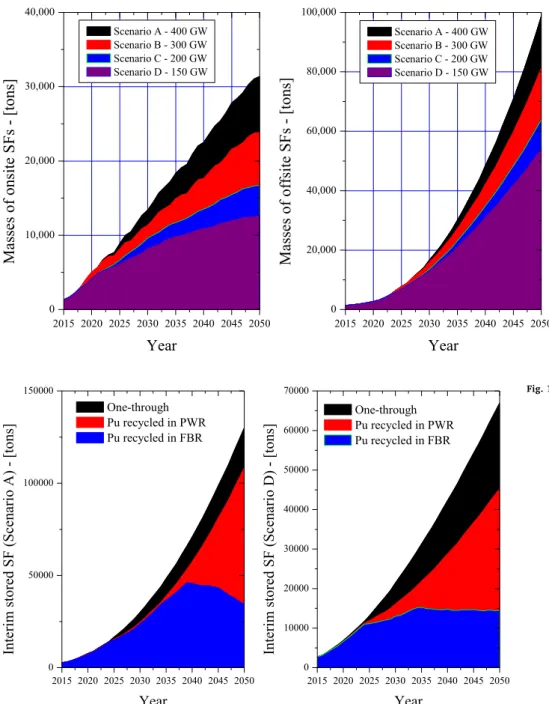
4.4. Spent fuel
If China would follow the“one-through” way to develop nuclear energy, the cumulative SF stored in on-site pool and eventually in geological disposals would increase dramatically, as illustrated in
Fig. 15.
The cumulative SF stored in on-site pool by the end of 2050 will be 13,000 tons at least and 32,000 tons at the most, which means that numerous pools would have to be built and maintained for storage purpose. The cumulative SF by the end of 2050 which have to be per-manently stored (offsite) weight 55,000 tons at least and 99,000 tons at the most. As long as the“one-through” cycle will apply in China, SF storage will remain a prime concern. For a same electrical production curve, the SF accumulation is different among the three recycling op-tions. Taking Scenario D and Scenario A as examples, the SF stocks are shown inFig. 16.
The results reveal that the reprocessing plant with the capacity of 1200 tHM/yr from 2025 cannot stop the increase of interim stored SF. It is necessary to increase the capacity of reprocessing in order to
Fig. 10. FBR power fraction for“Pu recycled in FBR” scenarios.
significantly reduce the mass of interim stored SF. Besides, the processing capacity should correspond to nominal operations of re-processing plants of reasonable lifetime. In other words, it is not rea-listic to consider oversized reprocessing plants with high capacity drying up all SF in several years. The spent fuel in interim storage for all the scenarios with respect to the 3 different options are presented in
Table 4.
4.5. Waste disposal
If the“one-through” way would apply in the future in China, there would be no reprocessing, so that the cumulative SF stored in off-site pool shown inFig. 15might be sent into geological disposal, since they contain long-life radioactive elements: SF would constitute the ultimate
solid wastes. To the opposite, reprocessing implies the separation of minor actinides (MA) andfission products. These elements are even-tually confined into high level waste (HLW) glass packages which
Fig. 12. Separated Pu stocks for“Pu recycled in FBR” scenarios.
Fig. 13. Demands of natural uranium for“one-through” way.
Scenario A Scenario B Scenario C Scenario D 0 200,000 400,000 600,000 800,000 1,000,000 1,200,000 1,400,000 1,600,000
]s
not
[
-mui
nar
Ul
ar
ut
a
N
2050
One-through Pu recycled in PWR Pu recycled in FBRFig. 14. Comparison of natural uranium consumptions with respect to the various sce-narios.
Table 3
Relative natural uranium savings with respect to one-through cycle by 2050. Scenario Pu recycled in PWR (%) Pu recycled in FBR (%)
A 1.5 7.1
B 1.9 7.4
C 2.2 13.5
D 2.4 14.0
Y. Chen et al. Progress in Nuclear Energy 103 (2018) 81–90
therefore constitute the ultimate solid wastes to manage for long. In this case, uranium and plutonium are recycled into new MOX fuels. Thanks to this, the amount of solid wastes can be considerably reduced when FBR are massively deployed, since a high reprocessing capacity is concomitantly setup, as shown inFig. 17for Scenarios D and A. In this figure, for the "one-through" cycle scenario, the mass of solid wastes
which shall be eventually disposed for a long time is the mass of heavy atoms (expressed in tHM). This is not the case of glass packages, for which the total mass is reported.
Finally, more FBR are deployed, more SF are recycled into MOX fuel. FBR therefore contribute to empty SF storage facilities in one hand, but significant reprocessing capacities must be deployed to supply them in the other hand.
If MA (Np, Am and Cm) were separated from HLLW and transmuted within ADS or FBR (assuming a 100% efficiency of the separation and transmutation processes), the mass and the thermal power of HLW packages would decrease: the results in 2050 are shown inTable 5.
It can be inferred fromTable 3that MA separation would decrease the mass of ultimate solid wastes by around 3.2%, and the amount of glass units by around 3.6%. The performance of MA separation and transmutation appears finally rather poor when these technologies apply at the scale of a nuclearfleet. Toxicity by ingestion would also decrease slightly, as shown inFig. 18.
2015 2020 2025 2030 2035 2040 2045 2050 0 10,000 20,000 30,000 40,000 Scenario A - 400 GW Scenario B - 300 GW Scenario C - 200 GW Scenario D - 150 GW
]s
not
[
-s
F
S
eti
sn
o
fo
se
ss
a
M
Year
2015 2020 2025 2030 2035 2040 2045 2050 0 20,000 40,000 60,000 80,000 100,000 Scenario A - 400 GW Scenario B - 300 GW Scenario C - 200 GW Scenario D - 150 GW]s
not
[
-s
F
S
eti
sff
o
fo
se
ss
a
M
Year
Fig. 15. SF stocks for "one-through" cycle (OTC) scenarios. 2015 2020 2025 2030 2035 2040 2045 2050 0 50000 100000 150000 One-through Pu recycled in PWR Pu recycled in FBR
]s
not
[
-)
A
oir
an
ec
S(
F
S
de
rot
s
mir
et
nI
Year
2015 2020 2025 2030 2035 2040 2045 2050 0 10000 20000 30000 40000 50000 60000 70000 One-through Pu recycled in PWR Pu recycled in FBR]s
not
[
-)
D
oir
an
ec
S(
F
S
de
rot
s
mir
et
nI
Year
Fig. 16. Comparison of SF stocks with different options.
Table 4
SF in interim storage in 2050.
Scenario OTC Pu recycled in PWR Pu recycled in FBR Absolute Value (tons) Absolute Value (tons) Decrease from OTC (%) Absolute Value (tons) Decrease from OTC (%) A 130,000 108,000 17% 46,000 65% B 105,000 84,000 20% 33,000 69% C 81,000 59,000 27% 21,000 74% D 67,000 45,000 33% 15,000 78%
5. Conclusion
The development of nuclear power in China is a part of the solution to the atmospheric pollution and to the growing electricity demand in this country, since in China, the public attitude as regards nuclear power is positive (Wu, 2017). However, nuclear power currently re-presents only few percents of the electricity production. It therefore needs a fast development in the next decades, supported by the Chinese government.
If China would go on relying on a“one-through” cycle, the foreseen Chinese nuclear expansion would need a huge amount of natural ur-anium and generate a substantial amount of spent fuel by 2050. Therefore, the closed fuel cycle appears as a necessary political and strategic decision. The results herein show that the selection of the
future strategy should take into account aspects that go beyond the natural uranium requirement. The capacity of fuel fabrication and re-processing plants, the timetable and the amplitude of the FBR devel-opment, as well as proliferation concerns related to sensitive elements, need to be part of the discussion.
It seems impossible for China to start two BN-800 fast reactors be-fore 2020 since the current pilot reprocessing plant of 50 tHM/yr cannot produce enough Pu. The deployment of FBR can start only from 2035 for scenario C and D (faster nuclear power growths), and from 2040 for scenario A and B. The pace of FBR development should be controlled carefully by the proportion of FBR and PWR with respect to the reprocessing capacity. The performances of MA separation and transmutation appearfinally rather poor when these technologies apply at the scale of a nuclearfleet.
Compared with the“one-through” way, the “Pu recycled in FBR” strategy can significantly decrease the consumption of natural uranium, the mass of SF and then the interim storage capacity needed (pools). It also leads to a reduction of the mass of solid wastes. A fast FBR de-ployment constitutes however the best long-term strategy for China in terms of sustainable development of nuclear energy.
However, natural uranium savings appear rather low by 2050, be-cause the transition toward a fast reactorfleet independent from ur-anium ore lasts decades. In these conditions, starting to close the fuel cycle is a priority, since this might be the only way to avoid the shortage of uranium resources in the end. A closed fuel cycle may be reached by the end of the century, if thefirst corners in this way are turned for the next decade. In this case, the fraction of FBR in 2050 may stand at the most for around 30% of the total nuclear power in China. Once investments in reprocessing technologies will have been decided, separated Pu can also be recycled in PWR in the form of MOX fuel, since this leads to short-term natural uranium savings and re-duction of spent fuel stocks. Recycling plutonium into PWR MOX fuel
2015 2020 2025 2030 2035 2040 2045 2050 0 20,000 40,000 60,000 one-through Pu recycled in FBR
]s
not
[
-D
oir
an
ec
s
fo
ets
a
W
dil
o
S
Year
2015 2020 2025 2030 2035 2040 2045 2050 0 20,000 40,000 60,000 80,000 100,000 one-through Pu recycled in FBR]s
not
[
-A
oir
an
ec
s
fo
ets
a
W
edi
lo
S
Year
Fig. 17. Comparison of solid waste production.
Table 5
Comparison between the glass units produced with MA separation (MA SP) and no separation (No SP) in scenarios with Pu recycled in FBR by the end of 2050. Scenario Thermal power (kW) Number of Glass units Total Masses (tHM)
MA SP No SP MA SP No SP MA SP No SP
A 13,260 15,770 65,570 67,850 4590 4740
B 8320 9950 50,730 52,601 3630 3750
C 5370 6430 38,510 39,960 2700 2790
D 3960 4800 32,450 33,710 2270 2350
Scenario A Scenario B Scenario C Scenario D 0.0 0.2 0.4 0.6 0.8 1.0 1.2 1.4 1.6 1.8 2.0
)v
S
T(
-noi
ts
eg
ni
yb
yti
ci
xo
T
MA SP No SPFig. 18. Toxicity by ingestion of wastes for the various scenarios in 2050.
Y. Chen et al. Progress in Nuclear Energy 103 (2018) 81–90
may therefore constitute a reliable strategy if FBR are delayed.
Acknowledgement
The research was supported by the STC project cooperated between CEA and CNNC (STC sheet n° CNNC_CIAE_2013_01). The databases of PWR and FBR were supplied by the laboratory of LEDC and LECy in Cadarache, CEA. Authors also wish to thank Mr Guillaume Krivtchik, Mr Pierre Sciora and Mr Bruno Fontaine for their fruitful cooperation.
References
CAE-Chinese Academy of Engineering: China to accelerate the development of nuclear power is necessary and urgent. Available at:http://www.chinanews.com/ny/2011/
02-28/2873748.shtm.
CAEA, 30 May 2008. The Uranium Conversion Production Line with a 3000 ton Capability had a Successful Test Run at the 404 Plant. Available at: http://www.
caea.gov.cn/n16/n1100/n1298/39259.html.
Chen, J., Zhu, Y.J., Jiao, R.Z., 1996. The separation of Am from lanthanides by purified
Cyanex 301 extraction. Sep. Sci. Technol. 31 (19), 2723–2731.
Chen, Jing, Wei, Meng, Liu, Xueliang, et al., 2012. Back-end of nuclear fuel cycle in
China. Prog. Nucl. Energy 54, 46–48.
China's nuclear export drive: Trojan horse or marshall plan? Energy Pol. 101, 683–691.
CNNC, 22 December 2010. China Successfully Conducted its First Hot Test at its Reprocessing Pilot Plant. Available at: http://www.cnnc.com.cn/publish/portal0/
tab293/info51006.htm.
CNPC Economics and Technology Research Institute, 2015. Energy Outlook in the World
and China by the End of the Year 2050. (in Chinese).
Coquelet, C., Kieffer, C., Dec. 11-16, 2011. Validation of physical models used in scenarios studies by coupling COSI with ERANOS package. In: Proc. Of GLOBAL 2011,
Makuhari, Japan.
Coquelet-pascal, C., Tiphine, M., Krivtchik, G., Fbreynet, D., Cany, C., Eschbach, R., Chabert, C., 2015. Cosi6: a tool for nuclear transition scenarios studies and appli-cation to SFBR deployment scenarios with minor actinides transmutation. Nucl.
Technol. 192, 91–110.
Energy Research Institute, National Development and Reform Commission, 2010. China's
low-carbon roadmap by 2050. Rev. Econ. Res. 26, 1–22.
Evans, Cecile, Avrin, Anne-Perrine, Carlier, Bertrand, et al., Sept. 20–24, 2015. Transition scenarios towards sustained Pu-management in China. In: Proc of GLOBAL 2015,
Paris, France.
Fiori, F., Zhou, Z., 2015a. Sustainability of the Chinese nuclear expansion: the role of ADS
to close the nuclear fuel cycle. Prog. Nucl. Energy 83, 123–134.
Fiori, F., Zhou, Z., 2015b. Sustainability of the Chinese nuclear expansion: natural ur-anium, resources availability, Pu cycle, fuel utilization efficiency and spent fuel
management. Ann. Nucl. Energy 83, 246–257.
Gao, Ruxing, Ko, Won Il, Choi, Sungyeol, Sept. 20–24, 2015. Quantitative and economic assessments of nuclear fuel cycle transition in China. In: Proc of GLOBAL 2015, Paris,
France.
Gao, R., Choi, S., Ko, W.I., Kim, S., 2017. Economic potential of fuel recycling options: a lifecycle cost analysis of future nuclear system transition in China. Energy Policy 101,
526–536.
Guobao, Zhang, 2009. Scientific development: the pathway to develop electric power industry. J. Qiushi 7 In Chinese. (In Chinese) Available at: http://www.qstheory.cn/
zxdk/2009/200907/200906/t20090609_1785.htm.
Guoqing, Deng, May 31– June 4, 2010. Overview of spent fuel management in China. In: Proc of Management of Spent Fuel from Nuclear Power Reactors, IAEA, Available at:
http://www-ns.iaea.org/downloads/rw/conferences/spentfuel2010/sessions/
session-twelve/session-12-china-1.ppt.
IAEA,https://www.iaea.org/PRIS/CountryStatistics/CountryDetails.aspx?current=CN.
IAEA, 2014. Uranium 2014: Resources, Production and Demands.
Martin, G., Girieud, R., 2016. Middle-term thorium strategy for PWRfleets. Energy Policy
99, 147–153.
Mi, Xu, 2008. The status and prospects of fast reactor technology. Eng. Sci. 10 (1), 70–76
(In Chinese).
National Development and Reform Commission (NDRC), People's Republic of China. The mid- and long-term plan for nuclear power in China (2005-2020). (In Chinese) Available at:http://nyj.ndrc.gov.cn/zywx/t20071102_170108.htm.
National Development and Reform Commission (NDRC), People's Republic of China. The mid- and long-term plan for nuclear power in China (2011-2020). Available at:
http://www.nea.gov.cn/2014-04/03/c_133235201.htm,http://test5.71online.com/
html/gongye/4090.html.
Rimpault, G., et al., Oct. 7-10, 2002. The ERANOS code and data system for fast reactors
neutronic analyses. In: Proc. Of PHYSOR 2002, Seoul, Korea.
Rothwell, G., 2001. Standardization, diversity, and learning in China's nuclear power program. Stanford Institute for Economic Policy Research, Stanford University, Palo
Alto, CA, pp. 1–28.
Santamarina, A., et al., April 12-15, 2009. APOLLO2.8: a validated code package for PWR neutronics calculations. In: Proc of ANFM 2009, Hilton Head Island, South Carolina,
USA.
Suttmeier, R.P., Evan, P.C., 1996. China Goes Nuclear. China Business Review.
September- October: 16–22.
Tiphine, M., Coquelet-Pascal, C., Girieud, R., et al., Sept. 20–24, 2015. Sodium fast
re-actor: an asset for a PWR UOX/MOXfleet. In: Proc of GLOBAL 2015, Paris, France.
Vidal, Jean-Marc, Eschbach, Romain, et al., February 26-March 1, 2012. CESAR5.3: an industrial tool for nuclear fuel and waste characterization with associated
qualifi-cation. In: Proc of WM 2012, Phoenix, Arizona, USA.
WNN, 5 November 2010. Areva into Chinese Fuel Supply. Available at: http://www.
world-nuclear-news.org/ENF_Areva_into_Chinese_fuel_supply_0511103.html.
World Nuclear Association, 2015. China Nuclear Power.
Wu, Y., 2017. Public acceptance of constructing coastal/inland nuclear power plants in
post-Fukushima China. Energy Policy 101, 484–491.
Yang, Hongyi, Liu, Yizhe, Yang, Yong, et al., 2015. Technical Progress of 600 MW Demonstration Fast Reactor(CFR600). Annual Report of China Institute of Atomic
Energy.
Yi-chong, Xu, 2008. Nuclear energy in China: contested regimes. Energy 33, 1197–1205.
Gu Zhongmao, Envision of nuclear energy and fuel cycle development in China, Workshop on Alternative East Asian Energy Futures February 27, 2014, Waikiki Beach Marriott, Honolulu, USA. Available at:http://www.npolicy.org/article_file/
Gu_-_14_02_27_East_Asia_alternative_energy_Sustainable_fuel_cycle.pdf.
Zhou, Yun, 2010. Why is China going nuclear? Energy Policy 38, 3755–3762.
Zhou, Yun, 2011. China's spent nuclear fuel management: current practices and future
strategies. Energy Policy 39, 4360–4369.
Zhou, Sheng, Zhang, Xiliang, 2010. Nuclear energy development in China: a study of
opportunities and challenges. Energy 35, 4282–4288.
Zhou, Yun, Rengifo, Christhian, Chen, Peipei, et al., 2011. Is China ready for its nuclear
expansion? Energy Policy 39, 771–781.
Zhu, Y.J., Song, C.L., 1992. Recovery of neptunium, plutonium and americium from highly active waste by tralkyl phosphine oxide extraction. In: Morss, L.R., Fuger, J. (Eds.), Transuranium Element Symposium 1990. American Chemical Society,