HAL Id: hal-01723070
https://hal.inria.fr/hal-01723070
Submitted on 5 Mar 2018
HAL is a multi-disciplinary open access
archive for the deposit and dissemination of
sci-entific research documents, whether they are
pub-lished or not. The documents may come from
teaching and research institutions in France or
abroad, or from public or private research centers.
L’archive ouverte pluridisciplinaire HAL, est
destinée au dépôt et à la diffusion de documents
scientifiques de niveau recherche, publiés ou non,
émanant des établissements d’enseignement et de
recherche français ou étrangers, des laboratoires
publics ou privés.
FLAIR MR Image Synthesis By Using 3D Fully
Convolutional Networks for Multiple Sclerosis
Wen Wei, Emilie Poirion, Benedetta Bodini, Stanley Durrleman, Olivier
Colliot, Bruno Stankoff, Nicholas Ayache
To cite this version:
Wen Wei, Emilie Poirion, Benedetta Bodini, Stanley Durrleman, Olivier Colliot, et al.. FLAIR MR
Image Synthesis By Using 3D Fully Convolutional Networks for Multiple Sclerosis. ISMRM-ESMRMB
2018 - Joint Annual Meeting, Jun 2018, Paris, France. pp.1-6. �hal-01723070�
FLAIR MR Image Synthesis By Using 3D Fully
Convolutional Networks for Multiple Sclerosis
Wen Wei1,2,3, Emilie Poirion2, Benedetta Bodini2, Stanley Durrleman2,3 Olivier Colliot2,3, Bruno Stankoff3, and Nicholas Ayache1
1
Asclepios project-team, Inria, Sophia Antipolis, France
2 Sorbonne Universit´es, UPMC Univ Paris 06, Inserm, CNRS, Institut du cerveau et la moelle (ICM), AP-HP-Hˆopital Piti´e-Salpˆetri`ere, Boulevard de l’hˆopital, Paris,
France 3
Aramis project-team, Inria, Paris, France
Synopsis. Fluid-attenuated inversion recovery (FLAIR) MRI pulse se-quence is used clinically and in research for the detection of WM lesions. However,in a clinical setting, some MRI pulse sequences can be missing because of patient or time constraints. We propose 3D fully convolutional neural networks to predict a FLAIR MRI pulse sequence from other MRI pulse sequences. We evaluate our approach on a real multiple sclerosis disease dataset by assessing the lesion contrast and by comparing our ap-proach to other methods. Both the qualitative and quantitative results show that our method is competitive for FLAIR prediction.
1
Introduction
Multiple sclerosis (MS) is a demyelinating and inflammatory disease of the cen-tral nervous system.1MS has been characterized as a white matter (WM) disease with the formation of WM lesions, which can be visualized by magnetic reso-nance imaging (MRI).2, 3FLAIR is commonly used clinically and in research to
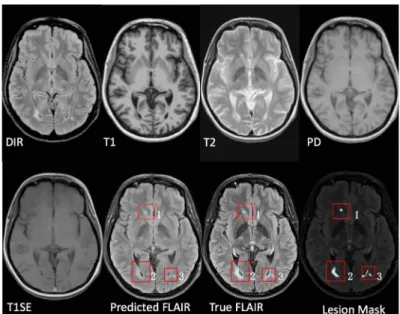
detect WM lesions which appear hyperintense compared to normal WM tissue. Additionally, observer performance is better with FLAIR,4 as shown in Fig. 1.
However, in a clinical setting, some MRI pulse sequences can be missing because of patient or time constraints. Hence, there is a big need for predicting the missed FLAIR when it was not acquired during a patient’s visit. Furthermore, it was shown in some publications5, 6 that synthesized MR images can improve brain
tissue classification and segmentation results, which is an additional motivation for this work. FLAIR may also be absent in some legacy research datasets, that are still of major interest due to their number of subjects and long follow-up.
We propose 3D Fully Convolutional Neural Networks (3D FCNs) to predict FLAIR. The proposed method can learn an end-to-end and voxel-to-voxel map-ping between other MRI pulse sequences and the corresponding FLAIR. Finally, the feasibility of our approach is validated qualitatively and quantitatively.
2
Fig. 1: FLAIR has better observer performance in the detection of multiple scle-rosis (MS) lesions on magnetic resonance (MR) images of the brain. The lesions 2 and 3 can be detected in other pulse sequences. However, it could be very time and labor consuming for the detection of lesion 1 even for an expert.
2
Method
Our goal is to predict FLAIR by finding a non-linear function s, which maps multi-sequence source images Isource, e.g. Isource= (IT1, IT2), to the
correspond-ing target sequence Itarget. The non-linear function can be found by solving the
following optimization problem:
ˆ s = arg min s∈S n X i=1
Error(Itargeti , s(Isourcei )) (1)
where S denotes potential mapping functions, n is the number of subjects. The error function above calculates the difference between the predicted and the true image.
Our 3D FCNs is shown in Fig. 2. It contains three convolutional layers fol-lowed by rectified linear functions (relu(x) = max(x, 0)). Every layer l ∈ [1, L] has Clfeature maps. The first layer extracts Cl-dimensional feature from input
images. Then, the second and third layers find a non-linear mapping between the feature representations of source images and the target image feature rep-resentations, which are used to reconstruct our target image. The mth feature
map in the lth layer is defined as follows:
ylm= max(0, Cl−1 X c=1 klm,c∗ yl−1c + b m l ) (2)
3 DIR T1SE PD T2 T1 Predicted FLAIR 3D Conv +ReLU Kernel: 64x3x3x3 3D Conv +ReLU Kernel: 64x3x3x3 3D Conv +ReLU Kernel: 64x3x3x3 3D Conv Kernel: 1x3x3x3
Feature Extraction Non-linear Mapping Image Prediction
Fig. 2: The proposed 3D fully convolutional neural networks. The first layer extracts a set of feature maps. The second and third layers find a nonlinear mapping for image prediction.Our networks use three convolutional layers with 64 filters and the filter size is 3x3x3.
where k denotes a 3-dimensional trainable kernel and b is a learned bias. The parameters k, b can be learned by minimizing the error function, which is mean-square-error (MSE) in our model.
M SE = 1 H × W × D H X h=1 W X w=1 D X d=1 (yh,w,d− ˆyh,w,d)2 (3)
where H, W, D indicate the height, weight, and depth of target image, while y and ˆy are the ground truth and the predicted image, respectively.
To evaluate our method, we compare it qualitatively and quantitatively with three other approaches : modality propagation,7 random forests (RF) with 60
trees,8and voxel-wise multilayer perceptron (MLP). Specifically, two metrics are
used to evaluate quantitatively: 1). Mean-Square-Error (MSE); 2). Peak Signal-to-noise-Ratio (PSNR).
3
Experiments and Results
We used our in-house dataset for FLAIR prediction, which contains 4 healthy volunteers and 20 MS patients, including T1-w, T2-w, T1 spin-echo (T1SE), proton density (PD), and double inversion recovery (DIR) weighted images and the corresponding FLAIR. Five-fold cross validation is used for evaluating per-formance. In 5-fold cross validation, the dataset is partitioned into 5 folds. Sub-sequently 5 iterations of training and validation are performed such that within each iteration one different fold is held-out for validation and remaining four folds are used for training.
4
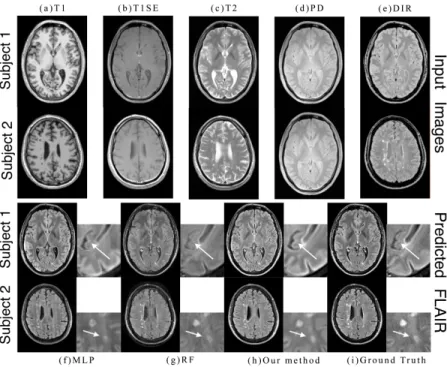
Figure 3 shows the inputs and outputs. As shown with arrows, some regions can be better predicted by our method. The modality propagation method got the worst result, so we do not show it here.
Fig. 3: The first two rows are input images for two subjects, including T1-w, T2-w, T1 spin-echo (T1SE), PD, and double inversion recovery (DIR) weighted images. The last two rows are qualitative comparison of the predicted FLAIR results obtained by our method and the other methods. As shown with arrows, some regions can be better predicted by our method.
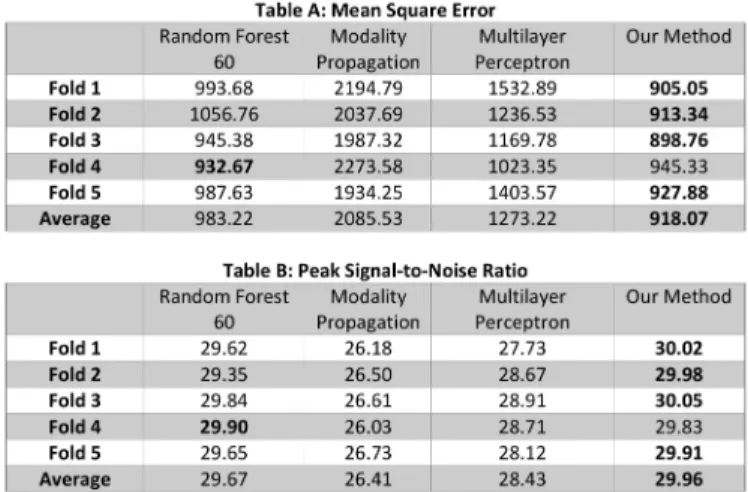
Figure 4 shows the result on 5-fold cross validation. Our method gets the best result on four folds. Even though RF gets the best performance on fold-4, the error difference is very small.
Figure 5 is the evaluation result for MS lesion contrast. MS lesions, normal-appearing WM (NAWM), and the surrounding NAWM are extracted using lesion and WM masks. Then we calculated the mean intensity of these three regions in the predicted images and ground truth. Our method keeps a good contrast between MS lesions and white matter, which is clinically very useful.
4
Conclusion
We introduced 3D FCNs for FLAIR prediction from multi-sequence MR images. The nonlinear relationship between the source images and FLAIR can be cap-tured by our network. Both the qualitative and quantitative results show its
5
Fig. 4: Table A and Table B are evaluation results for MSE and PSNR, respec-tively. Our method got the best result on Fold 1-2-3-5. Even though random forest algorithm got the best result on Fold-4, the difference with our method is very small.
Fig. 5: Evaluation result for lesion contrast. Our method keeps a good contrast between MS lesions and white matter. Even though MLP got a better contrast between lesions and the surrounding NAWM, the difference with ours is small.
good performance for FLAIR prediction. Moreover, the generated FLAIR has a good contrast for MS lesions so that it can be useful clinically. In the future, it would be interesting to also assess the utility of the method in the context of other WM lesions (e.g. age-related hyperintensities).
References
1. A. Compston and A. Coles. Multiple sclerosis. Lancet, 372(9648):1502–1517, 2008. 2. D. W. Paty, J. J. Oger, L. F. Kastrukoff, S. A. Hashimoto, J. P. Hooge, A. A. Eisen, K. A. Eisen, S. J. Purves, M. D. Low, and V. Brandejs. MRI in the diagnosis of MS: a prospective study with comparison of clinical evaluation, evoked potentials, oligoclonal banding, and CT. Neurology, 38(2):180–185, 1988.
6
3. F. Barkhof, M. Filippi, D. H. Miller, P. Scheltens, A. Campi, C. H. Polman, G. Comi, H. J. Ader, N. Losseff, and J. Valk. Comparison of MRI criteria at first presenta-tion to predict conversion to clinically definite multiple sclerosis. Brain, 120 ( Pt 11):2059–2069, 1997.
4. John H. Woo, Lana P. Henry, Jaroslaw Krejza, and Elias R. Melhem. Detection of simulated multiple sclerosis lesions on t2-weighted and flair images of the brain: Observer performance. Radiology, 241(1):206–212, 2006.
5. Juan Eugenio Iglesias, Ender Konukoglu, Darko Zikic, Ben Glocker, Koen Van Leemput, and Bruce Fischl. Is synthesizing mri contrast useful for inter-modality analysis? In Medical Image Computing and Computer-Assisted Interven-tion – MICCAI 2013, volume 8149 of Lecture Notes in Computer Science. Springer. 6. Gijs van Tulder and Marleen de Bruijne. Why does synthesized data improve multi-sequence classification? In Medical Image Computing and Computer-Assisted In-tervention – MICCAI 2015, volume 9349 of Lecture Notes in Computer Science. Springer.
7. Dong Hye Ye, Darko Zikic, Ben Glocker, Antonio Criminisi, and Ender Konukoglu. Modality propagation: Coherent synthesis of subject-specific scans with data-driven regularization. In Medical Image Computing and Computer-Assisted Intervention – MICCAI 2013, volume 8149 of Lecture Notes in Computer Science. Springer. 8. A. Jog, A. Carass, D. L. Pham, and J. L. Prince. Random Forest FLAIR
Re-construction from T1, T2, and PD -Weighted MRI. Proc IEEE Int Symp Biomed Imaging, 2014:1079–1082, 2014.