HAL Id: halshs-03174513
https://halshs.archives-ouvertes.fr/halshs-03174513
Preprint submitted on 19 Mar 2021HAL is a multi-disciplinary open access archive for the deposit and dissemination of sci-entific research documents, whether they are pub-lished or not. The documents may come from teaching and research institutions in France or abroad, or from public or private research centers.
L’archive ouverte pluridisciplinaire HAL, est destinée au dépôt et à la diffusion de documents scientifiques de niveau recherche, publiés ou non, émanant des établissements d’enseignement et de recherche français ou étrangers, des laboratoires publics ou privés.
Life Satisfaction and the Human Development Index
Across the World
Rémi Yin, Anthony Lepinteur, Andrew Clark, Conchita d’Ambrosio
To cite this version:
Rémi Yin, Anthony Lepinteur, Andrew Clark, Conchita d’Ambrosio. Life Satisfaction and the Human Development Index Across the World. 2021. �halshs-03174513�
WORKING PAPER N° 2021 – 19
Life Satisfaction and the Human
Development Index Across the World
Rémi Yin Anthony Lepinteur
Andrew E. Clark Conchita D’Ambrosio
JEL Codes:
Keywords: Human Development Index, Subjective Well-being, Gallup World Poll, Country Groups.
Life Satisfaction and the Human Development
Index Across the World
*
R
EMIY
IN University of Luxembourg [email protected]A
NTHONYL
EPINTEUR University of Luxembourg [email protected]A
NDREWE.
C
LARKParis School of Economics - CNRS [email protected]
C
ONCHITAD’A
MBROSIOUniversity of Luxembourg [email protected]
March 2021
Abstract
We use annual data on over 150 countries between 2005 and 2018 to look at the relationship between subjective well-being (both cognitive and affective) and the Human Development Index (HDI). The HDI appears to be more closely related to cognitive than affective well-being. We also consider the relationships between the three HDI components (the Income, Health and Education Indices) and well-being, and find that, on average, the Income Index has the strongest predictive power. Importantly, we find that the three HDI components only matter equally in Western and rich countries. Our analysis contributes to the discussion about cultural sensitivity in paradigms of societal development in two ways. We first show that differences in preferences towards development aims exist. Second, we propose a weighting procedure for a culturally-sensitive version of the HDI.
Keywords: Human Development Index, Subjective Well-being, Gallup World Poll, Country Groups.
* We are grateful to Carol Graham, John Helliwell and Haifang Huang for their useful advice.
We also thank the Editor, Kuba Krys, and three anonymous referees for comments that helped to improve our arguments. Andrew Clark acknowledges financial support from EUR grant ANR-17-EURE-0001.
1 1. Introduction
How can we measure progress in society? Despite the warnings of Kuznets (1934), Gross Domestic Product (GDP) has occupied centre stage as the measure of national prosperity, progress and well-being for over half a century since its creation following the end of World War II. There are, however, many criticisms of GDP, starting in the 1960s and 1970s: the Social Indicators Movement and Richard Easterlin’s celebrated work (Easterlin, 1974) are two examples. The Human Development Index (HDI), created by the United Nations Development Program (UNDP) in 1990, can be seen as one of the first well-established indices whose objective was to go beyond GDP in order to measure human development and well-being (Stanton, 2007).
From its inception in 1990 up to 2009, the HDI was calculated as the arithmetic mean of three components: the Income Index (based on the log of GDP per capita in Purchasing Power Parity), the Health Index (using information on life expectancy at birth) and the Education Index (composed of the adult literacy rate and the gross enrolment ratio).1 All three of these indices are rescaled to lie on a 0-1 scale, and therefore so is the summary arithmetic mean HDI figure.
One criticism of this original formulation of the HDI was that it was possible to obtain a reasonable summary score while neglecting one of the components, say health or education, as the index is additively separable. To penalise poor performance in any of the HDI dimensions, the UNDP decided in 2010 to switch from an arithmetic to a geometric mean of the income, health and education indices (UNDP, 2010). This geometric mean is also on the 0-1 scale.2 The rationale for this change was that with a geometric mean it was no longer possible to exhibit
1 This early HDI (which we will call HDI
0) was the simple average of the income (𝑥1), health (𝑥2), and education (𝑥3) indices: 𝐻𝐷𝐼0=
𝑥1+𝑥2+𝑥3
3 .
2 The geometric mean of the HDI (HDI
1) is the cubic root of the product of the income (𝑥1), health
(𝑥2), and education (𝑥3) indices: 𝐻𝐷𝐼1= (𝑥1× 𝑥2× 𝑥3)
1 3.
2
poor performance in one dimension but still obtain a reasonable score (although this change came with its own problems, as discussed in Ravallion, 2012). The Income and Education Indices also changed somewhat between 2010 and 2014, with the former now being based on Gross National Income (GNI) per capita in PPP and the latter on the mean and expected years of schooling (UNDP, 2015). However, one HDI feature that has remained unchanged since its inception is the equal weight that is given to each of the three components. This choice of equal weighting is normatively justified by the absence of any a priori opinion on which dimensions should matter more, and the belief that the three components are equally important in constructing human capabilities (for a complete review of the arguments, see Hirai, 2017).
Seen through the lens of the Economics of Happiness, the HDI components are arguably pertinent. While it continues to be debated whether economic growth is correlated with higher subjective well-being (Easterlin, 1974; Clark et al., 2008; Stevenson and Wolfers, 2008), people who live in richer countries very often report higher levels of subjective well-being (Di Tella et al., 2003; see also the country rankings in the annual World Happiness Report). Income is also associated with higher well-being at the individual level, both in cross-section (Graham and Pettinato, 2002; Blanchflower and Oswald, 2004; D’Ambrosio et al., 2020) and panel analyses (Apouey and Clark, 2015; Frijters et al., 2004; Gardner and Oswald, 2007). Regarding the other two components, a large body of literature has concluded that health is one of the most important factors lying behind well-being (Powdthavee and van den Berg, 2011). However, the evidence on the relationship between education and well-being is less consensual: while education is often positively correlated with well-being, there are doubts about whether this correlation is causal, or rather reflects certain types of people being more likely to choose to become educated. Both Oreopoulos (2007) and Powdthavee et al. (2015) address this issue, and argue that education does raise life satisfaction, while Clark and Jung (2017) find no such effect in UK data. Considering all three of the HDI variables together,
3
Layard et al. (2014) and Clark et al. (2018) conclude that health exhibits the largest correlations with adult life satisfaction, with income and education playing more moderate roles. This conclusion comes from linear regression analysis. Gentile et al. (2021) apply machine-learning techniques to the data used in Layard et al. (2014): the same hierarchy is found.
Although the conclusions from the Economics of Happiness literature normatively confirm that all of the HDI dimensions are relevant for well-being, preferences towards development aims might well vary between societies and cultures. As it applies the same components and weighting procedure to every country in the world, the HDI concept is culture-blind. As discussed in Krys et al. (2020), the HDI could take cultural sensitivity into account by the rescaling of its dimensions to reflect the actual preferences of each society over the realms of health, education and income.
In practice, the weighting of development aims by cultural preferences is a challenge. We here propose to combine the objective and subjective well-being literatures at the aggregate level by exploring the relationship between the HDI and its components, on the one hand, and national summary measures of subjective well-being on the other. In the spirit of Kroll (2015) and Yang (2018), our objective is to establish empirically whether the normative choice of equality between the three dimensions of the HDI also holds statistically (in that they contribute equally to individuals’ reports of their subjective well-being). We will run these analyses separately across different regions of the world in order to account for differences in preferences towards development aims. The implicit assumption that we are making here is that subjective well-being measures can be seen as a culturally-sensitive proxy for societal progress. Although Sen (1987) is critical about the use of subjective measures as preferences
4
may be adaptive, subjective well-being is being increasingly used in practice in economic and social policy discussions.3
Using combined data from the UNDP, the World Bank (WB) and the Gallup World Poll covering more than 150 countries over a 14-year period, we first show that the HDI is positively (negatively) correlated with various national measures of subjective well-being (ill-being). These correlations are not affected by the method of HDI calculation (i.e., the switch from the arithmetic to the geometric mean). The HDI is more strongly related to the Cantril Ladder, a cognitive measure of subjective being, than it is to various measures of affective well-being. Second, we show that the normative assumption of equal importance is not confirmed statistically: of the three HDI components, it is the Income Index that is the most-strongly correlated with national reported well-being. Last, we show that our results are context-dependent: there are substantial differences in the relationships between HDI and subjective well-being between different world regions. The HDI assumption that all of the three dimensions (Income, Health and Education) are of equal importance for well-being holds only in English-speaking countries and Catholic Europe, and high-income countries.
Our analysis contributes to the extant literature in a number of key ways. It can first be seen as an extension of Hall (2013), as we use more measures of national subjective well-being, a larger and more-recent dataset, and take into account both the relative importance of the three components and the calculation method in looking at the relationship between HDI and well-being. Our work also adds to the discussion of the relationship between objective and subjective indicators of well-being (two examples are Michalos, 2014, and Oswald and Wu, 2010).
3See, for example, the OECD (www.oecd.org/statistics/measuring-well-being-and-progress.htm), and
the “Green Book” from the UK Treasury used for Appraisal and Evaluation (assets.publishing.service.gov.uk/government/uploads/system/uploads/attachment_data/file/938046/T he_Green_Book_2020.pdf).
5
We also contribute to a number of the issues raised by the Social Indicators Movement (Land and Michalos, 2018; Shek and Wu, 2018), such as taking into account multiple domains of societal progress and, as suggested by Solomon et al. (1980), we underline the importance of cross-cultural comparisons by exploring different sources of cross-country heterogeneity. More importantly, our results confirm that the normative approach advocating equal weighting of the HDI components does not account for differences in preferences towards development aims. In other words, the HDI is culture-blind (as argued in Krys et al., 2020). Our method can also be considered as a framework to help promote a culturally-sensitive HDI by using as weights for its components their estimated coefficients in well-being regressions.
The remainder of the paper is organised as follows. Section 2 presents the data and the empirical strategy. Section 3 then shows the main results, and Section 4 the heterogeneity analysis across different regions of the world. Last, Section 5 concludes.
2. Data and Empirical Strategy 2.1. Data
We use the online database of the United Nations (UN) to obtain yearly national measures of the HDI and its components from 1990 to 2018 (http://hdr.undp.org/en/data). This database lists the HDI figure that corresponds to the geometric mean of the income index (rescaled log Gross National Income per capita), the health index (rescaled life expectancy at birth) and the education index (rescaled expected years and mean years of schooling), calculated using the method introduced by the UN in 2010; it also supplies the values of the three indices themselves.4 We obtain a number of time series of variables over the same time period from a
World Bank database (https://data.worldbank.org/indicator): country GDP per capita (in 2017
4 This database does not provide the arithmetic HDI figures (i.e., the measure we called HDI
0 above), which we
6
international Dollars in PPP terms), population size, the population percentage of women, and median population age.
We wish to relate the objective index of country well-being given by the HDI to a number of different measures of subjective well-being reported by that country’s inhabitants in that year. The first of these is the average Cantril Ladder figure from the Gallup World Poll (as presented, for example, in the World Happiness Report, 2020). The Cantril Ladder question is as follows: “Please imagine a ladder with steps numbered from zero at the bottom to 10 at the top. The top of the ladder represents the best possible life for you and the bottom of the ladder represents the worst possible life for you. On which step of the ladder would you say you personally feel you stand at this time?”. This figure is available almost every year from 2005 to 2018 for over 150 countries. The Cantril Ladder is a common cognitive measure of subjective well-being (Clark, 2016; Flèche et al., 2020). We will also consider a second cognitive-evaluative measure, national average life-satisfaction scores from the World Values Surveys, although this data is available for a smaller number of countries and years.
Evaluative measures of well-being may be subject to recall and cognitive biases as they refer to longer time periods and do not have a direct connection to daily-life activities (Kahneman et al., 2004; Kahneman and Krueger, 2006; Dolan and Kahneman, 2008; Krueger and Mueller, 2012; Stone et al., 2018), and/or reflect expectations rather than actual life experiences (Schwarz, 1999). This is why we also consider country-level affective well-being indices from the Gallup World Poll. The general form of the Affect questions is: “Did you experience the following feelings during a lot of the day yesterday?”. Valid answers to these questions are on a simple Yes/No scale. We use the answers to these questions to construct Positive and Negative Affect indices. Positive Affect is the average “Yes” response to the previous-day questions regarding feelings of happiness, laughter and enjoyment; the Negative
7
Affect index is constructed analogously for the questions on feelings of worry, sadness and anger.5
While cognitive and affective measures of subjective well-being are often highly correlated (Clark, 2016), Kahneman and Deaton (2010) argue that their determinants might differ substantially. For example, in Knabe et al. (2010) unemployment significantly reduces cognitive measures of well-being, while at the same time the unemployed and employed report similar levels of affective well-being.6
2.2. Empirical Strategy and Estimation Sample
We first want to see whether the way in which the HDI is calculated (as first an arithmetic and then a geometric mean) affects its correlation with national subjective well-being. We therefore estimate the following two equations via ordinary least squares regressions:
𝑊𝐵𝑖𝑡 = 𝛽0𝐻𝐷𝐼0𝑖𝑡+ 𝜆𝑡+ 𝜖𝑖𝑡, (1) 𝑊𝐵𝑖𝑡 = 𝛽1𝐻𝐷𝐼1𝑖𝑡+ 𝜆𝑡+ 𝜖𝑖𝑡. (2)
Here 𝑊𝐵𝑖𝑡 will successively be the Cantril Ladder, Positive Affect and Negative Affect
scores of country i in year t.7 𝐻𝐷𝐼0𝑖𝑡 and 𝐻𝐷𝐼1𝑖𝑡 are respectively the arithmetic and geometric
means of the Income, Health and Education indices from the UN (see the description above). We control for year fixed-effects, 𝜆𝑡, weight the observations by the size of the population,8
5 The laughter question is the only one that takes a slightly different form. It is asked as follows: “Did you smile
or laugh a lot yesterday?”. From 2013 onwards, positive affect is the average of the previous-day affect measures
for only laughter and enjoyment, as the happiness question was dropped from the Gallup World Poll questionnaire in 2013.
6 Although Krueger and Mueller (2012) emphasise the significant greater levels of sadness and pain reported by
the US unemployed in time-use diaries, neither of which measures appear in the German data analysed by Knabe
et al. (2010).
7 In line with Diener (1984) and Diener and Biswas-Diener (2002), we study positive and negative affect
separately. We do so because positive and negative affect do not share the same set of determinants and because in our estimation sample, as revealed in Table A1, the raw correlation between the two types of affect is relatively low. We have also considered Affect Balance, as in Brulé and Veenhoven (2015) and find similar conclusions. These Affect Balance results are available upon request.
8 Weighting observations by the population size can be problematic because the estimates might be biased by
extremely large countries. We find similar results in unweighted analyses, and if we exclude the largest countries (China and India) from our estimation sample.
8
and cluster standard errors at the country level.9 We can compare 𝛽
0 and 𝛽1 directly, as both
HDI measures are on a 0-1 scale: if there is a statistically-significant difference between the partial correlation coefficients in Equations (1) and (2), 𝛽0 and 𝛽1, then subjective well-being is differently associated with the arithmetic and the geometric HDI measures.
We will estimate two versions of equations (1) and (2). The first includes the controls listed above, while the second will add a set of time-varying national characteristics, 𝑋𝑖𝑡 (median population age and its square, and the population percentage of women) and a set of cultural fixed effects θc. Note that 𝑋𝑖𝑡 does not include any measures of income, education or
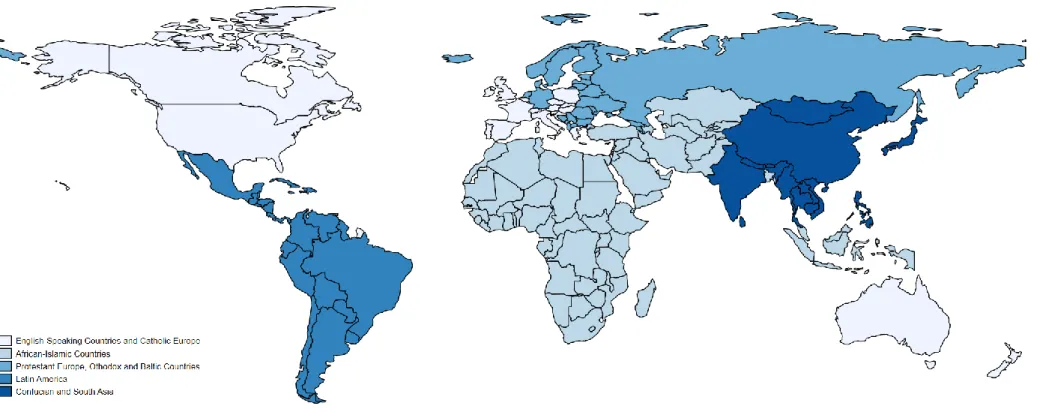
health, as these are already present in the three index variables. We include cultural fixed effects as we are interested in whether the relationship between objective and subjective well-being varies across different cultures. We here use the grouping and terminology of Inglehart and Welzel (2010) to construct the following five culture groups: “English-speaking countries and Catholic Europe”, “Protestant Europe, Orthodox and Baltic countries”, “Latin America”, “African-Islamic countries” and “Confucian and South Asia” (see Figure A1 for more details).10 This second specification asks whether the difference between countries reflects the characteristics of their populations.
We then decompose the HDI into its three constituent indices in order to see how these are separately correlated with national subjective well-being:
𝑊𝐵𝑖𝑡 = 𝛾1𝐼𝑛𝑐. 𝐼𝑛𝑑𝑒𝑥𝑖𝑡+ 𝛾2𝐻𝑒𝑎𝑙𝑡ℎ 𝐼𝑛𝑑𝑒𝑥𝑖𝑡+ 𝛾3𝐸𝑑𝑢𝑐. 𝐼𝑛𝑑𝑒𝑥𝑖𝑡 + 𝜆𝑡+ 𝜖𝑖𝑡. (3)
As in Equations (1) and (2) above, we will estimate Equation (3) first as it appears above and then controlling for the 𝑋𝑖𝑡 and θc variables.
9 We have also carried out a robustness check where we keep only one observation per country, corresponding to
the country average values of the dependent and independent variables. The results, which are available upon request, remain unchanged.
10 We obtain very similar results if we use continent rather than cultural fixed effects. Note that we cannot use
country fixed effects in these analyses due to the only limited within-country variance in the independent and dependent variables.
9
Before estimating Equation (3), we follow a beauty-contest approach where we separately control for each of the three indices and then control for all of them simultaneously. Any significant differences in the estimated 𝛾1, 𝛾2 and 𝛾3 coefficients in Equation (3) would show
that the three HDI dimensions are not equally important in terms of their correlation with subjective well-being. This matters, as the implicit assumption behind the HDI is that all three domains are equally important from a normative perspective. We do not believe that this question has ever been explicitly analysed using cross-country (and over-time) aggregate subjective well-being data. In Equation (3), this amounts to testing 𝛾1 = 𝛾2 = 𝛾3.
Equation (3) provides a potential framework that can be used to build a culturally-sensitive version of the HDI. Under the assumption that all of the estimated coefficients are unbiased, the estimation of Equation (3) in different cultural groups would produce a set of (𝛾1,𝛾2, 𝛾3) coefficients that would accurately reflect differences in preferences towards development aims, and could be used as weights in a culturally-sensitive HDI (as proposed in Krys et al., 2020).
The estimation of Equations (1), (2) and (3) requires a dataset with valid information on subjective well-being, the HDI and its components, and the aggregate control variables in 𝑋𝑖𝑡. The combination of the Gallup World Poll, UN and World Bank datasets yields 1623 country-year observations, corresponding to 155 countries that are observed an average of 10.47 times over the 14-year period between 2005 and 2018.11 Appendix Figure A2 lists the countries in
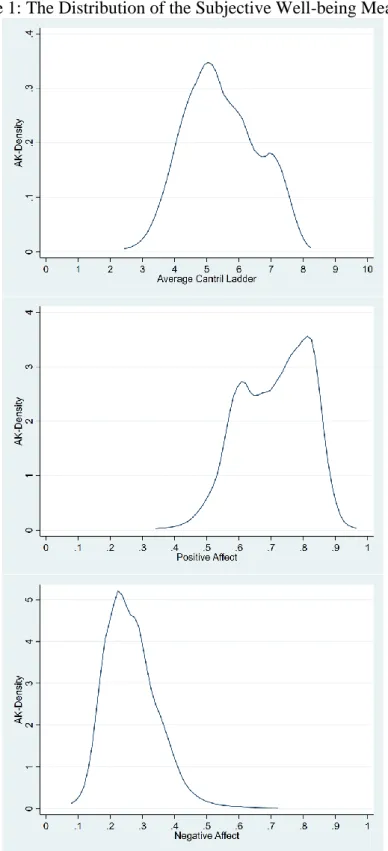
this estimation sample, as well as the number of times each country is observed. Figure 1 displays the distribution of the dependent variables, while Table 1 reports the descriptive statistics of all of the variables that we will analyse.
11 The missing values here refer to countries that are not always present in the Gallup World Poll over the 14-year
10 3. Main Results
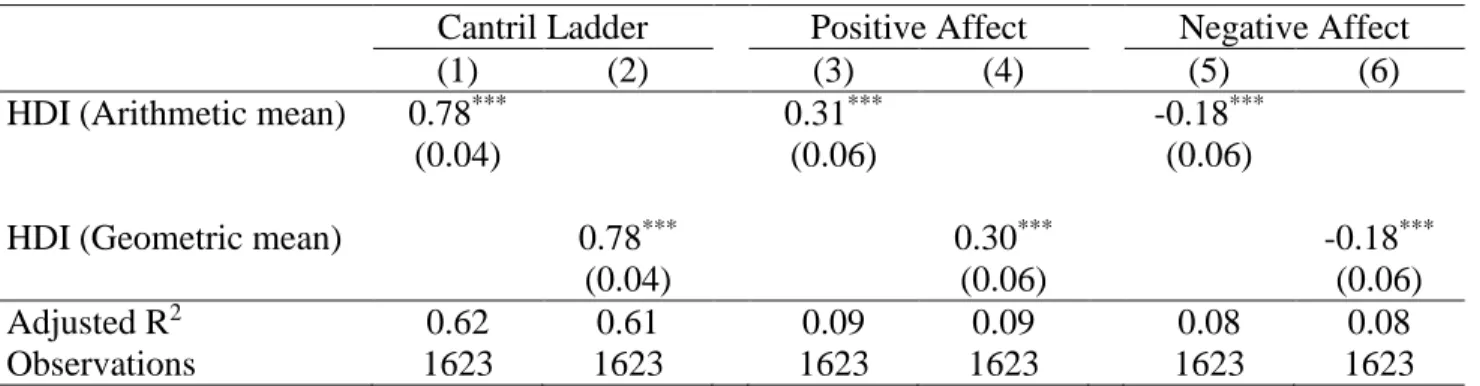
Table 2 shows the estimated coefficients from regressions of our three subjective well-being variables from the Gallup World Poll on the UN’s Human Development Index. The results here correspond to Equations (1) and (2) without any control variables other than year dummies. All of the well-being and HDI variables are standardised for ease of comparison. Column (1) shows that one standard-deviation (SD) higher HDI, when this is an arithmetic mean, is associated with a 0.78 SD-point higher average Cantril-Ladder score. Column (2) repeats this exercise, substituting the geometric for the arithmetic mean: this produces exactly the same estimated coefficient. The relationship between the Cantril Ladder and the HDI is then not sensitive to the way in which the latter is calculated.12 Columns (3) to (6) carry out analogous analyses for first Positive and then Negative Affect. The estimated coefficients on the HDI measures in the Affect regressions are smaller than those for the Cantril Ladder (but remain significant at all conventional levels). A one-SD higher arithmetic HDI is associated with 0.31 SD-point higher Positive Affect and 0.18 SD-point lower Negative Affect. These coefficients are again almost identical for the two HDI calculation methods. The lack of any significant difference by calculation method is not surprising: the two HDI measures are highly correlated (Table A2), and the country HDI ranks in our estimation sample are almost identical when using geometric or arithmetic HDI. This suggests that the penalisation for poor performance in one HDI dimension introduced in the geometric HDI had only minor effects in practice.
12 Table A3 in the Appendix reproduces this analysis with data from the World Values Survey (WVS) matched to
the three HDI dimension indices calculated using the pre-2010 method for the Education and Income indices (http://hdr.undp.org/en/global-reports). Given the data availability of these pre-2010 dimensions, we can carry out this analysis for WVS waves 3 to 5 (1995-2009). We consider both the pre-2010 (arithmetic mean) and post-2010 (geometric mean) ways of combining these three dimension indices. The subjective well-being measure in the WVS is life satisfaction. Table A3 shows that the World Values Survey results are similar to those using the Cantril Ladder from the Gallup World Poll. Our results are therefore not sensitive to either the time period that is covered or the way in which cognitive well-being is measured.
11
The Adjusted-R2 figures at the foot of Table 2 reveal that the predictive power of the HDI is far larger for cognitive well-being than for either Affect measure. This is in line with research at the individual level that has shown that cognitive measures of well-being are relatively more responsive to variations in life circumstances (Kapteyn et al., 2015), and that Affect measures may exhibit somewhat less international variation (Helliwell and Wang, 2013; Kahneman and Deaton, 2010). The theory of happiness of Veenhoven (2009) can also be mobilised here: although the HDI and its components were meant to represent the gratification of universal needs (proxied by affective measures), the difference in predictive power across measures of subjective well-being suggests that they are more likely to reflect cultural wants (proxied by cognitive measures).
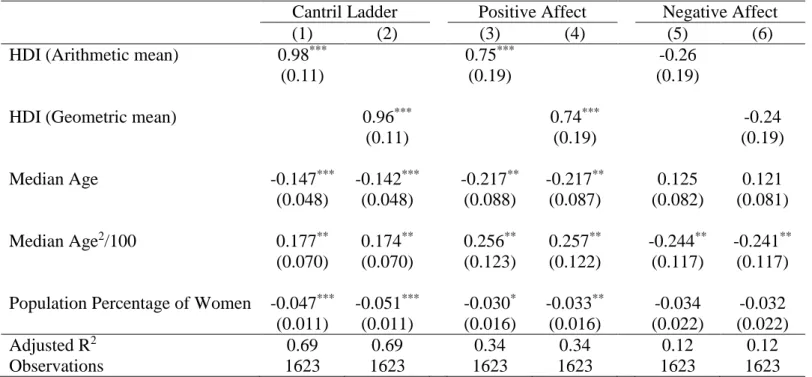
Table 3 is of the same form as Table 2, but adds controls for median population age and its square (to allow for a potential U-shaped relationship between subjective well-being and age, as is commonly found in the literature), the population percentage of women, and the cultural fixed effects discussed in Section 2.2 above. The estimated coefficients in columns (1) and (2) of Table 3 are somewhat higher than their counterparts in Table 2; again, there is very little difference by HDI calculation method. The same pattern is found for the Affect measures in columns (3) through (6): the results are the same across HDI calculation methods and introducing controls raises the correlations between HDI and subjective well-being measures (and significantly so for Positive Affect).13 This movement towards a more positive correlation renders the estimated coefficients for Negative Affect insignificant in columns (5) and (6), although again the difference in the estimated coefficients between Tables 2 and 3 is not significant.
13 This is explained by the correlations between the control variables and both subjective well-being and the HDI.
Notably, HDI is hump-shaped in age (as is the average Cantril ladder score by country) but the country median-age coefficients for positive affect are almost exactly zero.
12
Table 4 shows the estimation results from Equation (3), where we introduce the Income, Health and Education indices separately. There are three panels in this table, referring to the Cantril Ladder, Positive Affect and Negative Affect as the dependent variables. Each panel has the same structure, with the first three columns introducing the three HDI components separately, whereas the last column takes a beauty-contest approach and includes all three HDI dimensions at the same time. Introducing all HDI indices simultaneously may well change the estimated coefficients found in the first three columns, as Income, Education and Health are correlated with each other (see Kovacevic, 2011). All of the regressions in Table 4 include year dummies, but no other controls.
In columns (1) to (3) of the top panel, each HDI component is independently positively correlated with the Cantril Ladder, and all of the estimated coefficients are statistically identical. Analogous results are found for the two affective well-being measures in the middle and bottom panels: all HDI indices are positively (negatively) correlated with Positive (Negative) Affect when entered one at a time.
The last column of Table 4 shows what happens when all three indices enter simultaneously. In the Cantril-Ladder regression in the top panel, only the Income and Health indices attract significant positive estimated coefficients. The same conclusion holds in the Positive Affect regression in the middle panel, although the significance levels are lower here. In the bottom panel, Negative Affect is only significantly correlated with the Education and Health indices. Surprisingly, the estimated coefficient on the Health Index is positive here. As the Health index is calculated from life expectancy, this positive correlation might capture the health worries of ageing populations. Note nevertheless that this correlation is only significant at the 10% level.14
14 As the different HDI components are highly correlated (see Table A1), we calculated variance inflation factors
(VIF) for the independent variables in all of our regressions. None of these is over the rule-of-thumb figure of 10, which is considered as threshold for multicollinearity requiring correction.
13
Table 5 then adds the controls for median age and its square, the population percentage of women and cultural fixed effects. In the top panel, the Income, Health and Education indices are all positively and significantly correlated with the Cantril Ladder, either when introducing each index separately or with all three indices at the same time. In the middle panel, the introduction of controls renders the correlation between the Health index and Positive Affect insignificant. Last, in the bottom panel, when each index is introduced separately, Education is the only index that is significantly correlated with Negative Affect. When all indices are introduced simultaneously, the results are virtually the same as in Table 4 where there were no controls.
4. Accounting for Cultural Sensitivity: Differences across World Regions
The numbers in Tables 4 and 5 refer to the average effects of the different dimensions of the HDI across 150+ countries. The implicit assumption is that the Income, Health and Education Indices correlate with well-being in the same way over all of these countries. As such, our analysis so far has been culture-blind. We now relax this assumption and re-estimate Equation (3) separately for the five cultural groups presented in Inglehart and Welzel (2010) and described in Sub-section 2.2 (“English-speaking countries and Catholic Europe”, “Protestant Europe, Orthodox and Baltic countries”, “Latin America”, “African-Islamic countries” and “Confucian and South Asia”). These different groups are depicted graphically in the map in Figure A1.
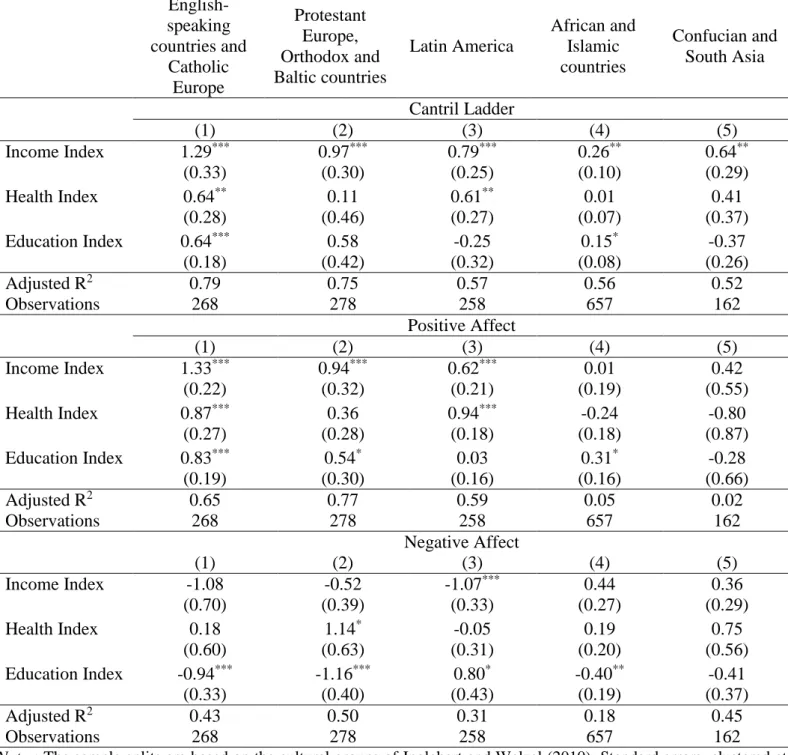
Table 6 reproduces the specification in column (4) of Table 5 separately for these five groups. The top panel refers to the Cantril Ladder. The Income Index is positively correlated with subjective well-being in all regions, with the largest coefficient in English-speaking countries and Catholic Europe and the smallest in African and Islamic countries. The Health and Education Indices are both associated with higher Cantril-Ladder scores only in English-speaking countries and Catholic Europe in column (1). This is also the only region in which
14
the three HDI dimensions are statistically significant and where we cannot reject that they are statistically equal to each other (in other words, this is the only region in which the equal weighting assumption underlying the HDI as a measure of well-being seems to hold). The Health Index attracts a positive significant coefficient in Latin America. The estimated coefficient on the Education Index is in general weak outside of column (1). Overall, these results underline that there are significant regional differences in preferences towards development aims, and that the single weighting procedure for the HDI across the world neglects substantial cultural sensitivity. They also confirm that the HDI components seem to correspond to Western wants more than universal needs.
The middle panel carries out the same exercise for Positive Affect. The results here are similar to those for the Cantril Ladder in the top panel in columns (1) to (3). However, contrary to the top panel, the estimated coefficient on the income index is insignificant in columns (4) and (5). Last, there are only few significant estimates and differences across groups of countries in the analysis of Negative Affect in the bottom panel. Income significantly reduces Negative Affect only in Latin America, while the results for Education there are somewhat surprising: education increases the level of Negative Affect. One potential explanation is that education raises expectations. However, if expectations are not accompanied by better outcomes, education widens the gap between expectations and realisations and, consequently, reduces well-being.15
The definition of culture in Inglehart and Welzel (2010) is based on differences in traditional vs. secular-rational values and survival vs. self-expression values. However, the descriptive statistics by region in Table A4 reveal large differences within each of these groups in terms of subjective well-being, the HDI and objective country characteristics. As such, Table
15 Using different groupings of countries (such as that used by the Gallup World Poll, or by Continent) produces
similar results: the three indices of the HDI attract significant estimates in Western and Developed countries only, and are always statistically equal to each other.
15
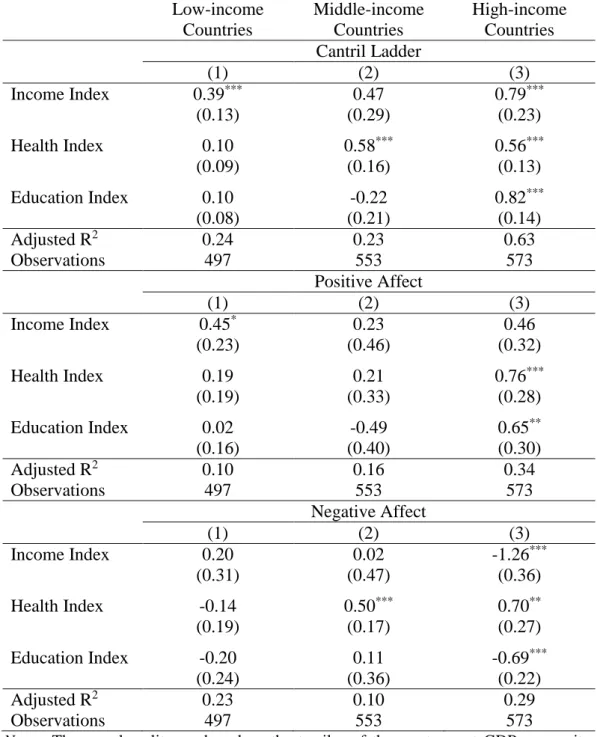
6 may not capture all of the heterogeneity across world regions. As an alternative, we construct three groups of countries that are more homogeneous in terms of income, based on the terciles of the most recent country GDP-per-capita figures from the World Bank. The income-based map of the world appears in Figure A3, and the descriptive statistics in Table A5 confirm that there is now less heterogeneity within groups than there was for the cultural groups in Table A4.
The estimated coefficients from the re-estimation of Equation (3) separately for Low-, Middle- and High-income countries are listed in Table 7. There is no significant difference in the Income coefficient across country groups for the Cantril ladder in the top panel (even though the estimated coefficient seems to rise in size as income rises from left to right), while Health Index is significant only in Middle- and High-income countries. Last, Education is important only in High-income countries. In High-income countries, none of the estimated coefficients on the three HDI components are statistically different from each other (and all are significant). Again, this suggests that it is only in High-income countries that the equal weighting of the three HDI dimensions accurately reflects societal progress.
As was the case for Inglehart and Welzel’s culture-based groups, the results differ for affective measures of subjective well-being. While the Income coefficient in the middle panel of Table 7 is significant only in Low-income countries, the size of the standard errors mean that it is not statistically different from that in the other two country groups. The only significant estimated Health coefficient is in high-income countries, although again the coefficients for the Health Index are statistically equal to each other due to the large standard errors. Last, Education is only significantly correlated with Positive Affect in high-income countries. The bottom panel looks at Negative Affect. As in Tables 4 and 5, Health is associated with greater Negative Affect, but only in Middle- and High-income countries, suggesting that this might reflect issues related to rich ageing societies. Along these lines, if we control for the percentage
16
of the population aged 65 or over, the estimated health-index coefficient becomes smaller in size, and is no longer significant in middle-income countries.
5. Conclusion
We here used data from the UN, the World Bank and the Gallup World Poll for more than 150 countries over a 14-year period to consider the relationship between the HDI, a measure of composite objective well-being, and the subjective well-being that individuals report. We first show that the HDI is more-closely related to cognitive than affective measures of subjective well-being, and that its calculation method (arithmetic vs. geometric mean) has no impact on its estimated relationship with subjective well-being. The HDI is then a reasonable short-cut proxy for subjective being for those who believe that national well-being is cognitive-evaluative, but not those who think that it should be given by the population’s average mood.
Splitting the HDI into its three components, the Income Index explains subjective well-being better than do the Health or Education indices. Over the whole world, the HDI supposition that the three components are of equal importance does not hold. However, these broad conclusions no longer apply when we split the world up into different regions using either cultural values or GDP per capita to account for cultural sensitivity. The HDI assumption of equally-important and significant Income, Health and Education indices holds only in English-speaking countries and Catholic Europe, and in high-income countries. Other countries, accounting for the majority of the World’s population, have different preferences towards development aims
These results are of importance for a number of reasons. They first underline that the determinants of well-being are context-dependent. While indices like the HDI allow easy cross-country comparisons via their harmonised construction, these comparisons are of only limited
17
validity if the conception of subjective well-being is not universal. While one of the main objectives of the HDI was to extend the measure of a country’s progress beyond GDP, we find that income is the only HDI component that is consistently correlated with the Cantril ladder across different country groups in terms of cultural values or GDP per capita, except in Middle-income countries where the correlation is not significant at conventional level (the situation with respect to Affect is more mixed, where in general the correlations are weaker). The choice of the HDI components is therefore not entirely reflected in individuals’ evaluations of the lives that they live in some regions of the world. These components were chosen as they are argued to represent equally-important basic capabilities at the core of human development (for a discussion, see Anand and Sen, 1994).
We believe that the method and results we present here are potentially useful for the construction of culturally-sensitive indices of progress. Were the data detailed enough, the estimated coefficients on the Income, Health and Education indices in subjective well-being regressions could serve as weights for culturally-sensitive HDI measures that would more accurately reflect the preferences towards development aims of different groups (by country, religion, age, gender etc.).
Our analysis does have limitations. First, data-driven weightings are not necessarily to be preferred to normative weightings in that they can be biased (as argued by Decancq and Lugo, 2013, and Hirai, 2017); in our case the estimates are not necessarily causal. Exploiting exogenous changes in the HDI components would of course be useful, but very difficult to isolate given the world-wide scope of our analysis here. These endogeneity issues should be carefully addressed in future research to help construct unbiased weights for culturally-sensitive indices of societal progress. Second, our analysis of subjective well-being has focussed on cognitive-evaluative measures (the Cantril Ladder and life satisfaction) and Positive and Negative Affect. There are alternative well-being measures, such as Eudaimonia
18
(which picks up aspects of life like meaning and mastery); however, these are not currently as widely-available in terms of country and year coverage. Third, we have focussed only on the HDI, as it is the best-known social indicator. This is only one of many indicators, and a useful research programme would be to establish the degree to which other innovative objective indices are correlated with various national measures of subjective well-being. Last, it would be of great interest to examine the interplay between economic development and preferences towards development aims.
19 References
Anand, S., and Sen, A.K. (1994). “Human Development Index: Methodology and Measurement.” Human Development Report Office Occasional Papers.
Apouey, B., and Clark, A.E. (2015). “Winning Big but Feeling No Better? The Effect of Lottery Prizes on Physical and Mental Health.” Health Economics, 24, 516–538.
Blanchflower, D. G., and Oswald, A. J. (2004). “Well-being over time in Britain and the USA.” Journal of Public Economics, 88, 1359-1386.
Brulé, G., and Veenhoven, R. (2015). “Geography of happiness: configurations of affective and cognitive appraisal of life across nations”. International Journal of Happiness and Development, 2, 101-117.
Clark, A.E. (2016). “SWB as a Measure of Individual Well-Being.” In The Oxford Handbook of Well-being and Public Policy, M. Adler and M. Fleurbaey (Eds.), Oxford: Oxford University Press, Oxford, 518-552.
Clark, A. E., Frijters, P., and Shields, M. A. (2008). “Relative income, happiness, and utility: An explanation for the Easterlin paradox and other puzzles.” Journal of Economic Literature, 46, 95-144.
Clark, A. E., and Jung, S. (2017). “Does Compulsory Education Really Increase Life Satisfaction?” Inha University IBER Working Paper Series No. 2017-6.
Clark, A. E., Flèche, S., Layard, R., Powdthavee, N., and Ward, G. (2018). The Origins of Happiness: The Science of Well-Being over the Life Course. Princeton University Press. D’Ambrosio, C., Jäntti, M., and Lepinteur, A. (2020). “Money and Happiness: Income, Wealth and Subjective Well-Being.” Social Indicators Research, 148, 47-66.
Decancq, K., and Lugo, M. A. (2013). “Weights in Multidimensional Indices of Well-Being: An Overview.” Econometric Reviews, 32, 7-34.
Di Tella, R. D., MacCulloch, R. J., and Oswald, A. J. (2003). “The macroeconomics of happiness.” Review of Economics and Statistics, 85, 809-827.
20
Diener, E., and Biswas-Diener, R. (2002). “Will money increase subjective well-being?”. Social Indicators Research, 57, 119-169.
Dolan, P., and Kahneman, D. (2008). “Interpretations of utility and their implications for the valuation of health”, Economic Journal, 118, 215–234.
Easterlin, R.A. (1974). “Does Economic Growth Improve the Human Lot? Some Empirical Evidence.” In Nations and Households in Economic Growth: Essays in Honor of Moses Abramowitz, P.A. David and M.W. Reder (Eds.). New York: Academic Press, 89-125.
Flèche, S., Lepinteur, A., and Powdthavee, N. (2020). “Gender Norms, Fairness and Relative Working Hours Within Households.” Labour Economics, 65, 101866.
Frijters, P., Haisken-DeNew, J. P., and Shields, M. A. (2004). “Money does matter! Evidence from increasing real income and life satisfaction in East Germany following reunification.” American Economic Review, 94, 730-740.
Gardner, J., and Oswald, A. J. (2007). “Money and mental wellbeing: A longitudinal study of medium-sized lottery wins.” Journal of Health Economics, 26, 49-60.
Gentile, N., Clark, A.E., D’Ambrosio, C., and Tkatchenko, A. (2021). “What Makes a Satisfying Life? Predicting and Interpreting with Machine Learning Algorithms.” University of Luxembourg, mimeo.
Graham, C. L., and Pettinato, S. (2004). Happiness and Hardship: Opportunity and Insecurity in New Market Economies. Brookings Institution Press.
Hall, J. (2013). “From capabilities to contentment: Testing the links between human development and life satisfaction.” In J. Helliwell, R. Layard, and J. Sachs (Eds.), World Happiness Report. New York: Columbia Earth Institute.
Helliwell, J., and Wang, S. (2012). “The state of world happiness”. In J. Helliwell, R. Layard, and J. Sachs (Eds.), World Happiness Report. New York: Columbia Earth Institute.
Hirai, T. (2017). “The human development index and its evolution.” In T. Hirai (Eds.), The Creation of the Human Development Approach. Palgrave Macmillan, Cham.
21
Inglehart, R., and Welzel, C. (2010). The WVS Cultural Map of the World. Retrieved from: http://www.worldvaluessurvey.org/wvs/articles/folder_published/article_base_54
Kahneman, D., and Deaton, A. (2010). “High income improves evaluation of life but not emotional well-being”. Proceedings of the National Academy of Science, 107, 16489-16493. Kahneman, D., and Krueger, A.B. (2006). “Developments in the measurement of subjective well-being”, Journal of Economic Perspectives, 20, 3-24.
Kahneman, D., Krueger, A.B., Schkade, D.A., Schwarz, N., and Stone, A. (2004). “A survey method for characterizing daily life experience: The Day Reconstruction Method”, Science, 3rd
December 2004, 1776-1780.
Kapteyn, A., Lee, J., Tassot, C., Vonkova, H., and Zamarro, G. (2015). “Dimensions of Subjective Well-Being”. Social Indicators Research, 123, 625-660.
Knabe, A., Rätzel, S., Schöb, R., and Weimann, J. (2010). “Dissatisfied with Life but Having a Good Day: Time-use and Well-being of the Unemployed.” Economic Journal, 120, 867-889. Kovacevic, M. (2011). “Review of HDI Critiques and Potential Improvements.” UNDP Human Development Reports Research Paper No. 2011/33.
Kroll, C. (2015). “Global development and happiness: How can data on subjective well-being inform development theory and practice?”. Oxford Development Studies, 43, 281-309.
Krueger, A.B., and Mueller, A. (2012). “Time use, emotional well-being and unemployment: Evidence from longitudinal data”, American Economic Review Papers and Proceedings, 102, 594-599.
Krys, K., Capaldi, C. A., Lun, V. M., Vauclair, C. M., Bond, M. H., Dominguez-Espinosa, A., and Uchida, Y. (2020). “Psychologizing indexes of societal progress: Accounting for cultural diversity in preferred developmental pathways.” Culture and Psychology, 26, 303-319.
Kuznets, S. (1934). National Income 1929–1932. A Report to the U.S. Senate, 73rd Congress, 2nd Session. Washington, DC. US Government Printing Office.
Land, K. C., and Michalos, A. C. (2018). “Fifty years after the social indicators movement: Has the promise been fulfilled?” Social Indicators Research, 135, 835-868.
22
Layard, R., Clark, A. E., Cornaglia, F., Powdthavee, N., and Vernoit, J. (2014). “What predicts a successful life? A life-course model of well-being.” Economic Journal, 124, F720-F738. Michalos A. C. (2014). Encyclopedia of Quality of Life and Well-Being Research. Springer. Oreopoulos, P. (2007). “Do dropouts drop out too soon? Wealth, health and happiness from compulsory schooling.” Journal of Public Economics, 91, 2213-2229.
Oswald, A.J., and Wu, S. (2010). “Objective Confirmation of Subjective Measures of Human Well-being: Evidence from the USA.” Science, 327, 576-579.
Powdthavee, N., and Van Den Berg, B. (2011). “Putting different price tags on the same health condition: Re-evaluating the well-being valuation approach.” Journal of Health Economics, 30, 1032-1043.
Powdthavee, N., Lekfuangfu, W. N., and Wooden, M. (2015). “What's the good of education on our overall quality of life? A simultaneous equation model of education and life satisfaction for Australia.” Journal of Behavioral and Experimental Economics, 54, 10-21.
Ravallion, M. (2012). “Troubling tradeoffs in the Human Development Index.” Journal of Development Economics, 99, 201-209.
Sen, A. (1999). On Ethics and Economics. Oxford and New York: Basil Blackwell.
Schwarz, N. (1999). “Self-reports. How the questions shape the answers”, American Psychologist, 54, 93-105.
Shek, D. T., and Wu, F. K. (2018). “The social indicators movement: progress, paradigms, puzzles, promise and potential research directions.” Social Indicators Research, 135, 975-990. Solomon, E. S., Bouchouchi, V., Denisov, V., Hankiss, E., Mallman, C. A., and Milbrath, L. W. (1980). “UNESCO’s Policy-Relevant Quality of Life Research Program.” In The Quality of Life, A. Szalai and F. M. Andrews (Eds.). London: SAGE Publications.
Stanton, E. A. (2007). “The Human Development Index: A History.” PERI Working Papers, 85.
Stevenson, B., and Wolfers, J. (2008). “Economic Growth and Subjective Well-Being: Reassessing the Easterlin Paradox.” Brookings Papers on Economic Activity, Spring, 1-102.
23
Stone, A., Schneider, S., Krueger, A., Schwartz, J., and Deaton, A. (2018). “Experiential wellbeing data from the American Time Use Survey: Comparisons with other methods and analytic illustrations with age and income”, Social Indicators Research, 136, 359-378.
United Nations Development Programme. (2010). Human Development Report 2010. Palgrave Macmillan.
Van Kerm, P. (2003). “Adaptive kernel density estimation”. Stata Journal, 3, 148-156. Yang, L. (2018). “Measuring being: a multidimensional index integrating subjective well-being and preferences”. Journal of Human Development and Capabilities, 19, 456-476.
24 Tables and Figures:
Figure 1: The Distribution of the Subjective Well-being Measures
Notes: These figures refer to our estimation sample of 1623 observations (155 countries observed on
average 10.47 times between 2005 and 2018). The densities are plotted using an adaptive kernel (see Van Kerm, 2003, for technical details). The graphs plot probability densities, which is the probability per unit, on the X-axis. As such, the total area under the curve integrates to one (note that the Cantril Ladder in the top panel is on a scale of 0 to 10, while the two Affect scores below take on values between 0 and 1).
25
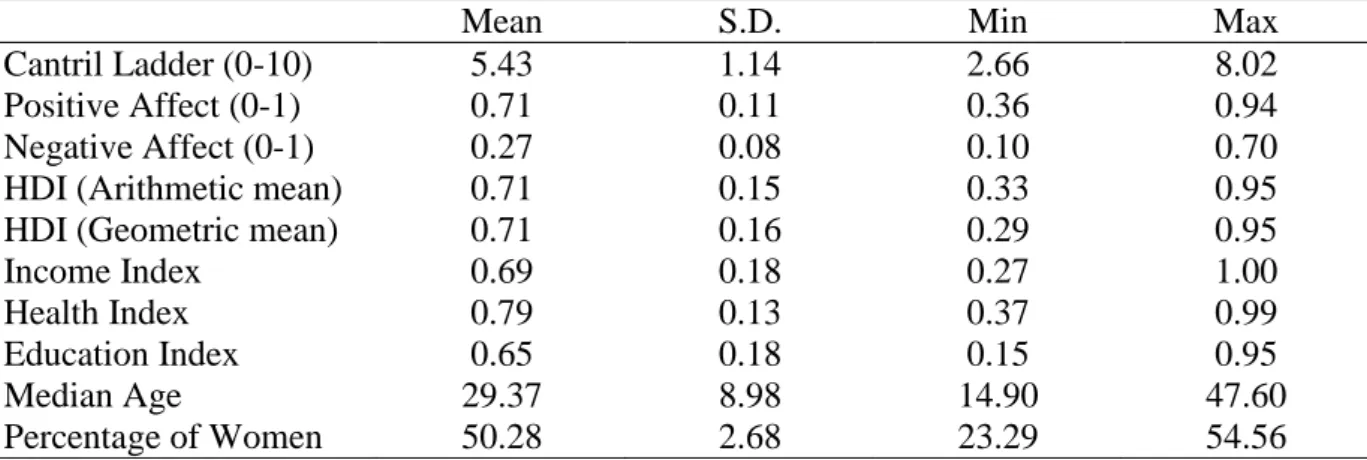
Table 1: Descriptive Statistics
Mean S.D. Min Max
Cantril Ladder (0-10) 5.43 1.14 2.66 8.02
Positive Affect (0-1) 0.71 0.11 0.36 0.94
Negative Affect (0-1) 0.27 0.08 0.10 0.70
HDI (Arithmetic mean) 0.71 0.15 0.33 0.95
HDI (Geometric mean) 0.71 0.16 0.29 0.95
Income Index 0.69 0.18 0.27 1.00
Health Index 0.79 0.13 0.37 0.99
Education Index 0.65 0.18 0.15 0.95
Median Age 29.37 8.98 14.90 47.60
Percentage of Women 50.28 2.68 23.29 54.56
Notes: These figures refer to our estimation sample of 1623 observations (155 countries observed on
26
Table 2: Subjective Well-being and the HDI: OLS Results
Cantril Ladder Positive Affect Negative Affect
(1) (2) (3) (4) (5) (6)
HDI (Arithmetic mean) 0.78*** 0.31*** -0.18***
(0.04) (0.06) (0.06)
HDI (Geometric mean) 0.78*** 0.30*** -0.18***
(0.04) (0.06) (0.06)
Adjusted R2 0.62 0.61 0.09 0.09 0.08 0.08
Observations 1623 1623 1623 1623 1623 1623
Notes: These figures refer to our estimation sample of 1623 observations (155 countries observed on average
10.47 times between 2005 and 2018). Standard errors, clustered at the country level, appear in parentheses. All regressions include year dummies and the observations are weighted by population size. The dependent and HDI variables are standardised. * p < 0.1, ** p < 0.05, *** p < 0.01.
27
Table 3: Subjective Well-being and the HDI: OLS Results with Controls
Cantril Ladder Positive Affect Negative Affect
(1) (2) (3) (4) (5) (6)
HDI (Arithmetic mean) 0.98*** 0.75*** -0.26
(0.11) (0.19) (0.19)
HDI (Geometric mean) 0.96*** 0.74*** -0.24
(0.11) (0.19) (0.19)
Median Age -0.147*** -0.142*** -0.217** -0.217** 0.125 0.121
(0.048) (0.048) (0.088) (0.087) (0.082) (0.081)
Median Age2/100 0.177** 0.174** 0.256** 0.257** -0.244** -0.241**
(0.070) (0.070) (0.123) (0.122) (0.117) (0.117)
Population Percentage of Women -0.047*** -0.051*** -0.030* -0.033** -0.034 -0.032
(0.011) (0.011) (0.016) (0.016) (0.022) (0.022)
Adjusted R2 0.69 0.69 0.34 0.34 0.12 0.12
Observations 1623 1623 1623 1623 1623 1623
Notes: These figures refer to our estimation sample of 1623 observations (155 countries observed on average 10.47
times between 2005 and 2018). Standard errors, clustered at the country level, appear in parentheses. All regressions include year dummies and the observations are weighted by population size. All regressions include culture fixed effects (see Inglehart and Welzel, 2010, for more details). The dependent and HDI variables are standardised. * p <
28
Table 4: Subjective Well-being and the HDI Components: OLS Results Cantril Ladder (1) (2) (3) (4) Income Index 0.78*** 0.53*** (0.04) (0.09) Health Index 0.74*** 0.25*** (0.05) (0.08) Education Index 0.71*** 0.04 (0.05) (0.09) Controls No No No No Adjusted R2 0.62 0.55 0.51 0.64 Observations 1623 1623 1623 1623 Positive Affect (1) (2) (3) (4) Income Index 0.31*** 0.28** (0.05) (0.14) Health Index 0.32*** 0.24* (0.06) (0.14) Education Index 0.24*** -0.19 (0.06) (0.15) Controls No No No No Adjusted R2 0.09 0.10 0.05 0.11 Observations 1623 1623 1623 1623 Negative Affect (1) (2) (3) (4) Income Index -0.17*** -0.03 (0.06) (0.16) Health Index -0.12** 0.18* (0.06) (0.10) Education Index -0.22*** -0.33** (0.06) (0.14) Controls No No No No Adjusted R2 0.07 0.06 0.09 0.10 Observations 1623 1623 1623 1623
Notes: These figures refer to our estimation sample of 1623 observations (155
countries observed on average 10.47 times between 2005 and 2018). Standard errors, clustered at the country level, appear in parentheses. All regressions include year dummies and the observations are weighted by population size. The dependent and HDI variables are standardised. * p < 0.1, ** p < 0.05, *** p < 0.01.
29
Table 5: Subjective Well-being and the HDI Components: OLS Results with Controls Cantril Ladder (1) (2) (3) (4) Income Index 0.76*** 0.60*** (0.10) (0.10) Health Index 0.43*** 0.21*** (0.10) (0.07) Education Index 0.54*** 0.21** (0.09) (0.08)
Controls Yes Yes Yes Yes
Adjusted R2 0.70 0.62 0.64 0.71 Observations 1623 1623 1623 1623 Positive Affect (1) (2) (3) (4) Income Index 0.58*** 0.44*** (0.16) (0.16) Health Index 0.22 0.03 (0.16) (0.14) Education Index 0.50*** 0.28** (0.13) (0.14)
Controls Yes Yes Yes Yes
Adjusted R2 0.36 0.30 0.34 0.37 Observations 1623 1623 1623 1623 Negative Affect (1) (2) (3) (4) Income Index -0.13 0.02 (0.18) (0.20) Health Index 0.11 0.19 (0.14) (0.13) Education Index -0.38*** -0.43** (0.14) (0.17)
Controls Yes Yes Yes Yes
Adjusted R2 0.13 0.13 0.15 0.16
Observations 1623 1623 1623 1623
Notes: These figures refer to our estimation sample of 1623 observations (155
countries observed on average 10.47 times between 2005 and 2018). Standard errors, clustered at the country level, appear in parentheses. All regressions include year dummies and the observations are weighted by population size. The controls are median age, the median-age squared, the population percentage of women, and culture fixed effects (see Inglehart and Welzel, 2010, for more details). The dependent and HDI variables are standardised. * p < 0.1, ** p < 0.05, *** p < 0.01.
30
Table 6: Subjective Well-being and the HDI Components by Cultural Groups: OLS Results with Controls English-speaking countries and Catholic Europe Protestant Europe, Orthodox and Baltic countries Latin America African and Islamic countries Confucian and South Asia Cantril Ladder (1) (2) (3) (4) (5) Income Index 1.29*** 0.97*** 0.79*** 0.26** 0.64** (0.33) (0.30) (0.25) (0.10) (0.29) Health Index 0.64** 0.11 0.61** 0.01 0.41 (0.28) (0.46) (0.27) (0.07) (0.37) Education Index 0.64*** 0.58 -0.25 0.15* -0.37 (0.18) (0.42) (0.32) (0.08) (0.26) Adjusted R2 0.79 0.75 0.57 0.56 0.52 Observations 268 278 258 657 162 Positive Affect (1) (2) (3) (4) (5) Income Index 1.33*** 0.94*** 0.62*** 0.01 0.42 (0.22) (0.32) (0.21) (0.19) (0.55) Health Index 0.87*** 0.36 0.94*** -0.24 -0.80 (0.27) (0.28) (0.18) (0.18) (0.87) Education Index 0.83*** 0.54* 0.03 0.31* -0.28 (0.19) (0.30) (0.16) (0.16) (0.66) Adjusted R2 0.65 0.77 0.59 0.05 0.02 Observations 268 278 258 657 162 Negative Affect (1) (2) (3) (4) (5) Income Index -1.08 -0.52 -1.07*** 0.44 0.36 (0.70) (0.39) (0.33) (0.27) (0.29) Health Index 0.18 1.14* -0.05 0.19 0.75 (0.60) (0.63) (0.31) (0.20) (0.56) Education Index -0.94*** -1.16*** 0.80* -0.40** -0.41 (0.33) (0.40) (0.43) (0.19) (0.37) Adjusted R2 0.43 0.50 0.31 0.18 0.45 Observations 268 278 258 657 162
Notes: The sample-splits are based on the cultural groups of Inglehart and Welzel (2010). Standard errors, clustered at
the country level, appear in parentheses. All regressions include year dummies and the observations are weighted by population size. The controls are median age, the median-age squared and the population percentage of women. The dependent and HDI variables are standardised. * p < 0.1, ** p < 0.05, *** p < 0.01.
31
Table 7: Subjective Well-being and the HDI Components by Income Groups: OLS Results with Controls Low-income Countries Middle-income Countries High-income Countries Cantril Ladder (1) (2) (3) Income Index 0.39*** 0.47 0.79*** (0.13) (0.29) (0.23) Health Index 0.10 0.58*** 0.56*** (0.09) (0.16) (0.13) Education Index 0.10 -0.22 0.82*** (0.08) (0.21) (0.14) Adjusted R2 0.24 0.23 0.63 Observations 497 553 573 Positive Affect (1) (2) (3) Income Index 0.45* 0.23 0.46 (0.23) (0.46) (0.32) Health Index 0.19 0.21 0.76*** (0.19) (0.33) (0.28) Education Index 0.02 -0.49 0.65** (0.16) (0.40) (0.30) Adjusted R2 0.10 0.16 0.34 Observations 497 553 573 Negative Affect (1) (2) (3) Income Index 0.20 0.02 -1.26*** (0.31) (0.47) (0.36) Health Index -0.14 0.50*** 0.70** (0.19) (0.17) (0.27) Education Index -0.20 0.11 -0.69*** (0.24) (0.36) (0.22) Adjusted R2 0.23 0.10 0.29 Observations 497 553 573
Notes: The sample-splits are based on the terciles of the most recent GDP per capita
figures from the World Bank. Standard errors, clustered at the country level, appear in parentheses. All regressions include year dummies and the observations are weighted by population size. The controls are median age, the median-age squared and the population percentage of women. The dependent and HDI variables are standardised. * p < 0.1, ** p
32 Appendix:
Figure A1: Culture-based Groups
33
Figure A2: Number of Annual Observations per Country
Note: This heat map shows the number of observations per country in our estimation sample of 1623 observations (155 countries observed on
34
Figure A3: Income-based Groups
35
Table A1: Correlation Matrix – Subjective Well-being Measures Cantril Ladder Positive Affect Negative Affect Cantril Ladder 1 Positive Affect 0.55*** 1 Negative Affect -0.27*** -0.36*** 1
Notes: These figures refer to our estimation sample of 1623 observations
(155 countries observed on average 10.47 times between 2005 and 2018).
* p < 0.1, ** p < 0.05, *** p < 0.01.
Table A2: Correlation Matrix – HDI and its Components HDI (Arithmetic mean) HDI (Geometric mean) Income Index Health Index HDI (Arithmetic mean)
HDI (Geometric mean) 0.99***
Income Index 0.96*** 0.96***
Health Index 0.92*** 0.91*** 0.84***
Education Index 0.95*** 0.96*** 0.86*** 0.81***
Notes: These figures refer to our estimation sample of 1623 observations (155 countries
observed on average 10.47 times between 2005 and 2018). * p < 0.1, ** p < 0.05, *** p <
36
Table A3: Average Life satisfaction, HDI and its Components: OLS Results with Controls using Data from the World Values Survey Life Satisfaction
(1) (2) (3) (4) (5) (6) (7)
HDI (Arithmetic mean) 0.48*** (0.09)
HDI (Geometric mean) 0.53***
(0.10) Income Index 0.53*** 0.50*** 0.49*** (0.10) (0.18) (0.16) Health Index 0.46*** 0.13 0.19 (0.10) (0.14) (0.19) Education Index 0.36*** -0.08 0.23 (0.09) (0.15) (0.15) Observations 117 117 117 117 117 117 117 Adjusted R2 0.36 0.33 0.39 0.30 0.25 0.39 0.59 Controls No No No No No No Yes
Notes: These figures refer to an estimation sample of 117 observations from three waves of the World Values
Surveys (1995-2009). Standard errors, clustered at the country level, appear in parentheses. All regressions include year dummies and the observations are weighted by population size. The controls in column (7) are median age and its square, the population percentage of women, and culture fixed effects (see Inglehart and Welzel, 2010, for more details). The dependent and HDI variables are standardised. * p < 0.1, ** p < 0.05, *** p < 0.01.
37
Table A4: Descriptive Statistics by Cultural Group English-speaking countries and
Catholic Europe (268 observations)
Protestant Europe, Orthodox and Baltic countries
(278 observations)
Latin America (258 observations)
Mean S.D. Min Max Mean S.D. Min Max Mean S.D. Min Max
Average Cantril Ladder 6.57 0.75 4.68 7.78 5.78 1.14 3.68 8.02 6.00 0.79 3.35 7.61
Positive Affect 0.75 0.08 0.58 0.89 0.66 0.12 0.43 0.90 0.81 0.06 0.54 0.94
Negative Affect 0.26 0.06 0.15 0.48 0.26 0.08 0.13 0.47 0.28 0.06 0.13 0.43
HDI (Arithmetic mean) 0.88 0.03 0.80 0.95 0.82 0.07 0.67 0.95 0.72 0.08 0.47 0.85
HDI (Geometric mean) 0.88 0.03 0.80 0.95 0.82 0.08 0.67 0.95 0.71 0.08 0.46 0.85
Income Index 0.88 0.04 0.78 0.98 0.80 0.10 0.58 0.98 0.69 0.10 0.41 0.86 Health Index 0.93 0.03 0.82 0.98 0.86 0.06 0.71 0.96 0.83 0.06 0.60 0.93 Education Index 0.84 0.05 0.68 0.93 0.81 0.08 0.61 0.95 0.63 0.10 0.38 0.84 Median Age 39.75 3.27 28.98 46.54 39.07 3.16 30.34 45.90 26.69 3.91 18.74 36.16 Population Percentage of Women 50.97 0.69 49.54 52.71 51.62 1.52 49.05 54.21 50.55 0.80 49.11 53.11 African-Islamic countries (657 observations)
Confucian and South Asia (162 observations)
Mean S.D. Min Max Mean S.D. Min Max
Average Cantril Ladder 4.68 0.86 2.66 7.27 5.14 0.76 3.57 7.06
Positive Affect 0.67 0.10 0.36 0.90 0.75 0.09 0.48 0.93
Negative Affect 0.28 0.10 0.10 0.70 0.23 0.08 0.11 0.48
HDI (Arithmetic mean) 0.59 0.13 0.33 0.87 0.71 0.12 0.50 0.94
HDI (Geometric mean) 0.58 0.14 0.29 0.87 0.70 0.13 0.48 0.94
Income Index 0.58 0.17 0.27 1.00 0.68 0.16 0.43 1.00
Health Index 0.69 0.12 0.37 0.91 0.82 0.09 0.65 0.99
Education Index 0.51 0.15 0.15 0.82 0.62 0.14 0.38 0.86
Median Age 21.74 5.01 14.90 36.74 30.73 7.59 19.42 47.60
Percentage of Women 49.31 3.71 23.29 52.45 50.37 1.63 47.24 54.56
Notes: These figures refer to our estimation sample of 1623 observations (155 countries observed on average 10.47 times between 2005 and 2018). The cultural groups
38
Table A5: Descriptive Statistics by Income Group Low-income Countries (497 observations) Middle-income Countries (553 observations) High-income Countries (573 observations)
Mean S.D. Min Max Mean S.D. Min Max Mean S.D. Min Max
Average Cantril Ladder 4.36 0.67 2.66 6.48 5.35 0.81 3.46 7.61 6.45 0.78 4.67 8.02
Positive Affect 0.67 0.09 0.36 0.87 0.71 0.13 0.42 0.94 0.75 0.09 0.43 0.91
Negative Affect 0.28 0.10 0.11 0.70 0.28 0.08 0.10 0.59 0.24 0.06 0.10 0.51
HDI (Arithmetic mean) 0.52 0.08 0.33 0.80 0.72 0.05 0.52 0.82 0.87 0.05 0.72 0.95
HDI (Geometric mean) 0.51 0.09 0.29 0.80 0.72 0.05 0.51 0.82 0.86 0.05 0.71 0.95
Income Index 0.48 0.09 0.27 0.79 0.70 0.06 0.52 0.83 0.88 0.06 0.72 1.00
Health Index 0.65 0.10 0.37 0.89 0.81 0.07 0.50 0.93 0.90 0.06 0.70 0.99
Education Index 0.44 0.12 0.15 0.78 0.66 0.09 0.40 0.86 0.82 0.08 0.56 0.95
Population size (in log) 14.49 1.26 11.13 18.72 14.15 1.58 10.31 18.78 13.93 1.50 10.31 17.30
Median Age 19.61 3.27 14.90 36.16 29.27 6.12 16.40 44.12 37.93 5.20 23.70 47.60
Population Percentage of Women
50.22 0.99 46.62 54.56 50.61 1.20 47.24 53.84 50.02 4.24 23.29 54.21
Notes: These figures refer to our estimation sample of 1623 observations (155 countries observed on average 10.47 times between 2005 and 2018). The income groups