HAL Id: hal-01587574
https://hal.archives-ouvertes.fr/hal-01587574
Submitted on 3 Nov 2017
HAL is a multi-disciplinary open access
archive for the deposit and dissemination of
sci-entific research documents, whether they are
pub-lished or not. The documents may come from
teaching and research institutions in France or
abroad, or from public or private research centers.
L’archive ouverte pluridisciplinaire HAL, est
destinée au dépôt et à la diffusion de documents
scientifiques de niveau recherche, publiés ou non,
émanant des établissements d’enseignement et de
recherche français ou étrangers, des laboratoires
publics ou privés.
meridional overturning circulation during the last glacial
(20–50 ka)
Pierre Burckel, Claire Waelbroeck, Yiming Luo, Didier M. Roche, Sylvain
Pichat, Samuel L. Jaccard, Jeanne Gherardi, Aline Govin, Jörg Lippold,
François Thil
To cite this version:
Pierre Burckel, Claire Waelbroeck, Yiming Luo, Didier M. Roche, Sylvain Pichat, et al.. Changes in
the geometry and strength of the Atlantic meridional overturning circulation during the last glacial
(20–50 ka). Climate of the Past, European Geosciences Union (EGU), 2016, 12 (11), pp.2061-2075.
�10.5194/cp-12-2061-2016�. �hal-01587574�
www.clim-past.net/12/2061/2016/ doi:10.5194/cp-12-2061-2016
© Author(s) 2016. CC Attribution 3.0 License.
Changes in the geometry and strength of the Atlantic meridional
overturning circulation during the last glacial (20–50 ka)
Pierre Burckel1,2, Claire Waelbroeck1, Yiming Luo3, Didier M. Roche1,4, Sylvain Pichat5, Samuel L. Jaccard6, Jeanne Gherardi1, Aline Govin1, Jörg Lippold6, and François Thil1
1Laboratoire des Sciences du Climat et de l’Environnement, LSCE/IPSL, CEA-CNRS-UVSQ, Université Paris-Saclay,
91191 Gif-sur-Yvette, France
2Institut de Physique du Globe de Paris, Université Sorbonne Paris Cité, 75238 Paris, France
3Dalhousie University, Department of Oceanography, 1355 Oxford Street, P.O. BOX 15000, Halifax, NS B3H 4J1, Canada 4Department of Earth Sciences, Earth and Climate Cluster, Faculty of Earth and Life Sciences, Vrije Universiteit Amsterdam,
Amsterdam, the Netherlands
5Laboratoire de Géologie de Lyon (LGL-TPE), Ecole Normale Supérieure de Lyon, 46 allée d’Italie, 69007 Lyon, France 6Institute of Geological Sciences and Oeschger Centre for Climate Change Research, University of Bern, Baltzerstr. 1 & 3,
3012, Bern, Switzerland
Correspondence to:Pierre Burckel (burckel@ipgp.fr)
Received: 26 February 2016 – Published in Clim. Past Discuss.: 11 March 2016
Revised: 11 September 2016 – Accepted: 29 September 2016 – Published: 8 November 2016
Abstract.We reconstruct the geometry and strength of the Atlantic meridional overturning circulation during the Hein-rich stadial 2 and three Greenland interstadials of the 20– 50 ka period based on the comparison of new and published sedimentary 231Pa /230Th data with simulated sedimentary
231Pa /230Th. We show that the deep Atlantic circulation
during these interstadials was very different from that of the Holocene. Northern-sourced waters likely circulated above 2500 m depth, with a flow rate lower than that of the present-day North Atlantic deep water (NADW). Southern-sourced deep waters most probably flowed northwards below 4000 m depth into the North Atlantic basin and then southwards as a return flow between 2500 and 4000 m depth. The flow rate of this southern-sourced deep water was likely larger than that of the modern Antarctic bottom water (AABW). Our results further show that during Heinrich stadial 2, the deep Atlantic was probably directly affected by a southern-sourced water mass below 2500 m depth, while a slow, southward-flowing water mass originating from the North Atlantic likely influ-enced depths between 1500 and 2500 m down to the equator.
1 Introduction
Greenland ice core records show that the last glacial climate repeatedly shifted between cold (stadial) and warm (inter-stadial) conditions (Johnsen et al., 1992). Greenland stadials (GSs) and Greenland interstadials (GIs) are the Greenland expressions of the characteristic millennial-scale Dansgaard– Oeschger events that represent cold and warm phases of the North Atlantic region, respectively (Rasmussen et al., 2014). GSs typically lasted for several centuries and were followed by a rapid warming of up to 15◦C achieved in (at most) a couple of centuries (Kindler et al., 2014). The subsequent GI then lasted for several centuries to millennia, with Greenland temperatures slowly decreasing and leading to the onset of a new GS. During some of the GSs, icebergs were released from high-latitude Northern Hemisphere ice sheets into the North Atlantic Ocean, and their melting led to the deposition of ice rafted detritus on the seafloor, as observed in marine sediment cores (Heinrich, 1988). We refer to these periods as Heinrich stadials (HSs).
Changes in Atlantic Ocean circulation have long been sug-gested to impact Greenland temperatures (Broecker et al., 1985) and could be at the origin of the glacial millennial-scale variability. Indeed, there is much evidence for
de-creased North Atlantic deep-water formation and inde-creased influence of southern-sourced deep waters in the Atlantic during Heinrich stadials (Elliot et al., 2002; McManus et al., 2004; Skinner et al., 2003; Vidal et al., 1997). More-over, climate models are able to reproduce the bipolar see-saw pattern characterizing millennial-scale glacial variabil-ity through variations of the strength of the Atlantic merid-ional overturning circulation (AMOC) in response to fresh-water forcings (Ganopolski and Rahmstorf, 2001). However, recent studies show that a shallow circulation cell could have been still active during HSs (Bradtmiller et al., 2014; Gher-ardi et al., 2009; Lynch-Stieglitz et al., 2014; Roche et al., 2014; Wary et al., 2015), suggesting that Greenland temper-ature millennial-scale variability might be related to more complex changes in Atlantic circulation than simply switch-ing between “on” and “off” circulation modes. A better un-derstanding of the vertical layout and flow rate of the wa-ter masses constituting the AMOC during the last glacial is therefore needed to assess the relationship between AMOC and glacial millennial-scale variability.
Sedimentary (231Pa /230Th)xs,0(activity ratio of231Pa and 230Th unsupported by lithogenic and authigenic uranium
and corrected from decay to the time of sediment deposi-tion; Pa / Th hereafter) records were first used to assess the AMOC intensity during the last glacial maximum (LGM; Yu et al., 1996). Since then, Pa / Th records have been used in the Atlantic to infer changes in the intensity of the deep ocean circulation during HSs (Böhm et al., 2015; Bradtmiller et al., 2014; Burckel et al., 2015; Gherardi et al., 2005, 2009; Mc-Manus et al., 2004). The comparison of simulated sedimen-tary Pa / Th values with core top Pa / Th data has shown that sedimentary Pa / Th reflects circulation intensity in the mod-ern Atlantic Ocean (Lippold et al., 2011).
However, interpretations of sediment Pa / Th from a sin-gle core can be ambiguous because similar values can result from different geometry and overturning strength (Luo et al., 2010). Reconstructing past circulation thus requires combin-ing Pa / Th records from multiple sites over a wide range of latitudes and depths (Gherardi et al., 2009; Lippold et al., 2011, 2012).
In this study, we present new sedimentary Pa / Th data from a deep sediment core recovered from the Brazilian mar-gin and from an intermediate depth core from the midlati-tude North Atlantic. We then compare the last glacial Pa / Th records from different water depths and latitudes with Pa / Th values simulated using a simple 2-D box model (Luo et al., 2010) forced by various stream functions. One stream func-tion is derived from present-day geostrophic velocity esti-mates (Talley et al., 2003) and two others were simulated with the Earth System model iLOVECLIM under different climatic conditions (Roche et al., 2014). Results of this com-parison allow us to constrain the geometry and strength of the AMOC during GI-3, GI-8, GI-10 (Rasmussen et al., 2014) and HS2. We chose to focus our study on HS2 and the inter-stadials surrounding HS2 and HS4 as these periods are
asso-ciated with very different ice-sheet volumes (Lambeck and Chappell, 2001).
2 Material and methods
2.1 Sediment cores
Sediment cores MD09-3257 (04◦14.690S, 36◦21.180W; 2344 m water depth) and MD09-3256Q (03◦32.810S, 35◦23.110W; 3537 m water depth) were recovered from the Brazilian margin during R/V Marion Dufresne cruise MD173/RETRO3 (Fig. 1). Improved recovery of deep-sea sediments with no or little deformation of sediment layers was achieved during this coring cruise thanks to the system-atic use of the CINEMA software (Bourillet et al., 2007; Wo-erther and Bourillet, 2005). This software computes the am-plitude and duration of the elastic recoil of the aramid cable and the piston displacement throughout the coring phase, ac-counting for the length of the cable (water depth) and total weight of the coring system. The length of the coring cable is indeed of primary importance regarding the deformation rate of the Calypso long piston cores (Bourillet et al., 2007; Skinner and McCave, 2003).
Core GeoB3910 (04◦14.70S, 36◦20.70W; 2362 m water depth; Jaeschke et al., 2007) was recovered from approx-imately the same position and depth as core MD09-3257, during the Meteor cruise M34/4. Hereafter, we refer to both GeoB3910 and MD09-3257 as intermediate equatorial cores and to MD09-3256Q as the deep equatorial core. At present, the Brazilian margin at these depths is bathed by the North Atlantic deep water (NADW; Fig. 1). Because the Brazilian margin is affected by western boundary currents (Rhein et al., 1995), these sediment cores are ideally located to observe changes in the strength and extent of the intermediate and deep AMOC water masses (Schott, 2003).
Sediment core SU90-03 (40◦30.30N, 32◦3.1980W; 2475 m water depth) was recovered from the northern margin of the subtropical gyre (Chapman et al., 2000). Its location in the midlatitude North Atlantic provides informa-tion on changes in NADW producinforma-tion rates that could not be deduced from the sole equatorial depth transect.
We compare these Pa / Th records with published records from other Atlantic cores that span the 20–50 ka period: ODP Leg 172 site 1063 (33◦410N, 57◦370W; 4584 m wa-ter depth; hereafwa-ter, ODP1063) (Böhm et al., 2015); MD02-2594 (34◦430S, 17◦200E; 2440 m water depth) (Negre et al.,
2010) and V29-172 (33◦420N, 29◦22.980W; 3457 m water
depth) (Bradtmiller et al., 2014) (Fig. 1, Table S1 in the Sup-plement).
2.1.1 Benthic δ13C
The stable carbon isotopic composition (δ13C) of the epi-faunal benthic foraminifer Cibicides wuellerstorfi has been shown to record the δ13C of bottom-water dissolved
inor-MD02-2594 MD09-3257 MD09-3256Q ODP site 1063 NADW AAIW AABW SU90-03 V29-172 60° N 40° N 20° N EQ 20° S 40° S 60° S 20° E 0° 20° W 40° W 60° W 80° W SU90-03 ODP 1063 V29-172 MD02-2594 MD09-3256Q MD09-3257 (a) (b) Phosphate [μmol kg ]-1 º º 40º S 20º S EQ 20º N 40º N 60º N
Figure 1.(a) Phosphate section (Schlitzer, 2000) and (b) map of the Atlantic Ocean showing the location of the studied sediment cores (see
Sect. 2.1 or Table S1 for detailed locations). Cores, for which we provide new Pa / Th or δ13C data, are circled in red. Phosphate content
follows the structure of the present-day AMOC. White arrows indicate the approximate flow directions of the Antarctic intermediate water (AAIW), Antarctic bottom water (AABW) and North Atlantic deep water (NADW).
ganic carbon (DIC) with minor isotopic fractionation (Du-plessy et al., 1984; Zahn et al., 1986). Initial DIC isotopic concentration is acquired by a water mass in its formation region by surface productivity (which consumes 12C there-fore increasing dissolved δ13C) and temperature-dependent air–sea interactions (Lynch-Stieglitz et al., 1995; Rohling and Cooke, 2003). DIC δ13C then evolves as deep water ages, be-cause the constant export of12C-enriched biogenic material
that is remineralized at depth leads to the decrease of the DIC δ13C along the flow path of the water mass. As DIC δ13C largely follows water mass structure and circulation in the modern ocean, C. wuellerstorfi δ13C has been used to trace water masses, with a decrease in C. wuellerstorfi δ13C be-ing interpreted as a decrease in bottom water ventilation, and conversely (e.g., Duplessy et al., 1988). However, the infor-mation on bottom water ventilation embedded in C. wueller-storfiδ13C is complicated by the impact of changes in surface water δ13C, marine biological productivity and continental biomass changes.
Because LGM δ13C values are higher in northern-sourced waters (1.5 ‰) than in southern-sourced waters (< −0.2 ‰; Curry and Oppo, 2005), we interpret a decrease in C. wueller-storfiδ13C values at the equatorial sites as an increase in the time elapsed since the water mass was last in contact with the atmosphere or as an increased influence of nutrient-rich southern-sourced deep waters. Note that because we lack in-formation on past marine productivity changes, we do not ac-count for their potential impact on benthic δ13C in the present study.
Core MD09-3256Q benthic foraminifer C. wuellerstorfi were handpicked in the size fraction higher than 250 µm, washed with methanol in an ultrasonic bath and then roasted in glass vials at 380◦C under vacuum for 45 min. C. wueller-storfiδ13C (expressed in ‰ VPDB) was measured at LSCE (Gif-sur-Yvette) using an Elementar Isoprime mass
spec-trometer. VPDB is defined with respect to NBS-19 cal-cite standard (δ18O = −2.20 and δ13C = +1.95 ‰; Coplen, 1988). The mean external reproducibility (1σ ) of carbon-ate standards is ±0.05 for δ18O and ±0.03 ‰ for δ13C. Measured NBS-18 δ18O is −23.2 ± 0.2 VPDB and δ13C is −5.0 ± 0.1 ‰ VPDB. δ13C measurements were done at the highest possible resolution, depending on the availability of C. wuellerstorfi(usually every 1 to 2 cm).
2.1.2 Sedimentary Pa / Th
In contrast to C. wuellerstorfi δ13C, which reflects the nutri-ent contnutri-ent of bottom waters, sedimnutri-entary Pa / Th is a rela-tively recent tracer that can be used to estimate the renewal rate of water masses occupying the first ∼ 1000 m above the seafloor (Thomas et al., 2006; Luo et al., 2010). This tracer has been successfully used to reconstruct past changes in deep Atlantic circulation intensity (Böhm et al., 2015; Gher-ardi et al., 2005, 2009; Guihou et al., 2010, 2011; Hall et al., 2006; Jonkers et al., 2015; Lippold et al., 2011, 2012; Mc-Manus et al., 2004; Negre et al., 2012; Yu et al., 1996).
231Pa and230Th are produced at a constant Pa / Th
activ-ity ratio of 0.093 by dissolved uranium, which is homoge-neously distributed in the oceans. 230Th is however much more particle reactive than 231Pa, as reflected by their re-spective residence time in the ocean (30–40 years for230Th, 200 years for 231Pa; Francois, 2007). 230Th is therefore rapidly removed from the water column to the underlying sediment, while231Pa can be advected by oceanic currents. High (low) rates of overturning therefore result in high (low)
231Pa export and hence low (high) sedimentary Pa / Th
ra-tio in the Atlantic. However, affinities of231Pa and230Th for settling particles depend on the particle type (Chase et al., 2002). For instance,231Pa has a high affinity for opal, so that high opal fluxes can result in high sedimentary Pa / Th values even in the presence of lateral advection (Chase et al., 2002).
The origin of sedimentary Pa / Th variability therefore needs to be carefully assessed.
Pa / Th measurements on core MD09-3256Q were per-formed by isotopic dilution mass spectrometry on a Thermo Finnigan MC-ICP-MS Neptune, following the method of Guihou et al. (2010).
Core SU90-03 sedimentary Pa / Th was measured by iso-topic dilution on a single collector, sector field ICP-MS (El-ement2) at the University of British Columbia, following the procedure described by Choi et al. (2001).
For both cores, Pa and Th are corrected from radioactive decay since the time of sediment deposition and from authi-genic and lithoauthi-genic components using a 238U /232Th ratio of 0.5 ± 0.1 (Fig. S1 in the Supplement; Guihou et al., 2010). 2.1.3 Age model
Over the period 0–34 ka, core MD09-3256Q age model is based on 1114C dates measured on planktic foraminifer G. ruber white and converted to calendar age using the Ma-rine13 curve with no additional reservoir age correction (Bur-ckel et al., 2016; Reimer et al., 2013; Fig. S2). During the last glacial, Heinrich stadials were recorded in marine sediment cores from the Brazilian margin as Ti / Ca peaks resulting from increased terrigenous input during periods of increased precipitation associated with southward shifts in the position of the intertropical convergence zone (ITCZ; Jaeschke et al., 2007). Ti / Ca peaks are therefore good stratigraphic markers for correlating sediment cores with neighboring well-dated cores. Therefore, from 34 to 50 ka, core MD09-3256Q was dated by correlation of its Ti / Ca record with that of core GeoB3910 using two tie points corresponding to the Ti / Ca peaks associated with HS4 and HS5. The GeoB3910 age model over the 34 to 50 ka period is based on one14C date calibrated using the Marine13 curve and on four speleothem tie points at the onset and end of HS4 and HS5 (Burckel et al., 2015). Core MD09-3256Q age model and sedimentation rates are given in Table S2 and Fig. S3. The age model of core SU90-03 is based on 1714C dates measured on various species of planktic foraminifera (Chapman et al., 2000) that were converted to calendar ages using Marine13 calibration curve with no additional reservoir age correction.
14C dates of all the published Atlantic cores used in this
study were converted into calendar ages using the same method (Table S1).
2.2 Circulation and Pa / Th model 2.2.1 Description of the models
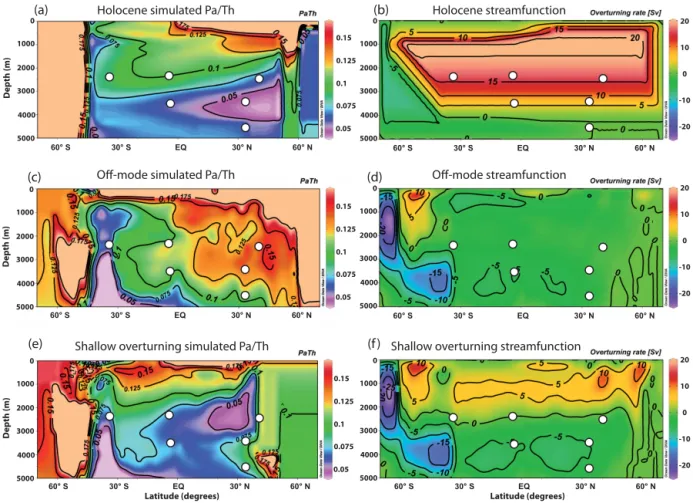
In order to assess the vertical layout and renewal rate of the water masses constituting the AMOC during the last glacial period, the sedimentary Pa / Th data of the studied sedi-ment cores were compared to Pa / Th values simulated with a simple 2-D box model (Luo et al., 2010) forced by differ-ent stream functions (Fig. 2b, d, f). Stream functions were
generated using the iLOVECLIM coupled climate model, comprising atmosphere, ocean and vegetation components (Roche et al., 2014). A LGM equilibrium state computed using the PMIP-2 protocol was used as background climate (see Roche et al., 2007) for details). Stream functions char-acterized by a shallow (< 2500 m) northern-sourced overturn-ing cell (shallow overturnoverturn-ing stream function) and by a com-plete shutdown of the AMOC (off-mode stream function) were generated by imposing a 0.16 and 0.35 Sv freshwater forcing in the Labrador Sea, respectively (Roche et al., 2010, 2014). The freshwater input is added during 300 years on the LGM background state. The stream functions are taken as the mean over the 100-year period of lowest deep-water formation in the North Atlantic, during or right after the period of freshwater forcing. A freshwater input of 0.16 Sv allows the presence of a shallow circulation cell in the At-lantic Ocean, while a freshwater forcing of 0.35 Sv leads to an almost complete shutdown of the AMOC (Roche et al., 2014). Note that the freshwater input values needed to mod-ify the AMOC are strongly model dependent and the impor-tant information carried by the model in the present context is the state of the AMOC rather than the freshwater input value. Contrary to shallow overturning and off-mode stream functions, the Holocene stream function was computed us-ing data-based geostrophic velocity estimates (Talley et al., 2003).
Dissolved Pa and Th concentrations in the 2-D box model are controlled by (1) production from U decay in the water column, (2) adsorption and desorption on settling particles and (3) advection by oceanic circulation. Particulate Pa and Th concentrations are controlled by (1) adsorption and des-orption from the dissolved pool and (2) removal of sedimen-tary particles to the seafloor (Luo et al., 2010).
Modeled sedimentary meridional Pa / Th sections gener-ated with the different stream functions are shown in Fig. 2a, c, e. Different water mass circulation intensities and geome-tries result in different simulated sedimentary Pa / Th (Luo et al., 2010). In the deep Atlantic, increasing circulation in-tensity above a specific location causes Pa / Th to decrease at that water depth because of the increased Pa export and conversely. Increasing water depth without modifying circu-lation intensity also causes sedimentary Pa / Th ratio to de-crease in the model because of the inde-creased residence time of Pa and resulting higher Pa export, and conversely. Finally, the sedimentary Pa / Th ratio increases along the flow path of any newly formed water mass as low dissolved Pa concentra-tions of newly formed water masses increase by desorption of Pa from Pa-concentrated settling particles equilibrating with ambient waters (Francois, 2007). Adsorption and desorption rate constants also impact the simulated Pa / Th ratio. These constants were adjusted to reflect the opal belt in the South-ern Ocean (Luo et al., 2010). For the Holocene, these con-stants were also changed to reflect preferential scavenging of Pa by biogenic opal in the northern North Atlantic (Lippold et al., 2012).
(a) (b)
(e) (f )
(c) (d)
Holocene simulated Pa/Th Holocene streamfunction
Shallow overturning simulated Pa/Th Shallow overturning streamfunction
Off-mode simulated Pa/Th Off-mode streamfunction
0.15 0.05 0.1 0.125 0.075 0 1000 2000 3000 4000 5000 0.15 0.05 0.1 0.125 0.075 0 1000 2000 3000 4000 5000 0.15 0.05 0.1 0.125 0.075 0 1000 2000 3000 4000 5000 0 1000 2000 3000 4000 5000 Depth (m) 0 1000 2000 3000 4000 5000 Depth (m) 0 1000 2000 3000 4000 5000 Depth (m) 60° S 30° S EQ 30° N 60° N 60° S 30° S EQ 30° N 60° N 60° S 30° S EQ 30° N 60° N Latitude (degrees) 60° S 30° S EQ 30° N 60° N Latitude (degrees) 60° S 30° S EQ 30° N 60° N 60° S 30° S EQ 30° N 60° N 20 10 0 -10 -20 20 10 0 -10 -20 20 10 0 -10 -20
Figure 2.Simulated sedimentary Pa / Th values (left) in response to different stream functions (right): (a, b) Holocene, (c, d) off-mode, (e, f) shallow overturning. White dots indicate the position of the studied sediment cores (see Fig. 1). Data gridding was achieved using the Ocean Data View software (Schlitzer, 2015).
2.2.2 Limits of the models
The absence of margins in the simple 2-D Pa / Th model (Luo et al., 2010) prevents it from simulating boundary scav-enging, which is the lateral advection of dissolved Pa from open ocean regions characterized by high Pa concentrations to coastal regions of low Pa concentration such as in up-welling zones (Christl et al., 2010). However, as described in the results section below, we verified that our Pa / Th signal is mainly driven by oceanic circulation changes and the im-portance of diffusive transport is therefore likely negligible here. This simple 2-D Pa / Th model therefore appears ade-quate for comparison with our Pa / Th data. The vertical res-olution of the iLOVECLIM model is depth dependent, with higher resolution (10 to 100 m) in the upper water column than below 1000 m (500 to 700 m). Hence, the uncertainty in the position of the water mass transitions in the stream func-tions below 1000 m is of 500 to 700 m. However, because sedimentary Pa / Th likely reflects the Pa export in the bot-tom 1000 m of the water column (Thomas et al., 2006), the model vertical resolution is sufficient to properly simulate sedimentary Pa / Th values. Hence, the relatively low
verti-cal resolution of the iLOVECLIM model in the deep ocean does not affect our conclusions.
2.3 Time slice definition
We define three interstadial time slices and one Heinrich sta-dial time slice (Fig. 3) to compare Pa / Th data measured in Atlantic cores to Pa / Th values simulated with the different stream functions. We focus on HS2, the preceding GI and the GIs bracketing HS4. We did not include HS4 in our study because core MD09-3257 HS4 Pa / Th data are affected by boundary scavenging (see Sect. 3.1, Burckel et al., 2015) and we therefore lack information from an important location of the Atlantic Ocean.
GI-3, GI-8 and GI-10 time slices are defined as the peri-ods of stable sedimentary Pa / Th values in core MD09-3257 associated with the NGRIP GI time intervals (Fig. 3). More specifically, we used as a reference MD09-3257 Pa / Th val-ues bracketing the middle of NGRIP GI time intervals in the GICC05 age scale (Rasmussen et al., 2014). Contiguous Pa / Th values within 1σ uncertainty of the Pa / Th reference value form a plateau of stable Pa / Th values that was used to
Age (ka) T° (° C) δ 13C (‰) Pa/Th HS2 HS4 2 3 4 5 6 7 8 9 10 11 12 Pa/Th production ratio
MD09-3257 GeoB3910 MD09-3256Q ODP1063 (a) (b) (c) SU90-03 MD09-3256Q MD02-2594 SU90-03 -0.4 0.1 0.6 1.1 1.6 -60 -50 -40 -30 20 25 30 35 40 45 50 V29-172 0.02 0.04 0.06 0.08 0.10 0.12 0.14 20 25 30 35 40 45 50
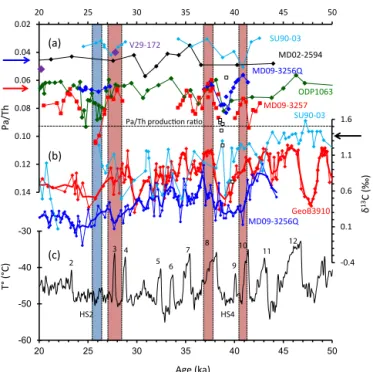
Figure 3. Comparison between sedimentary Pa / Th and benthic
δ13C data from the Brazilian margin, Bermuda Rise, midlatitude
North Atlantic Ocean and South Atlantic Ocean and Greenland temperatures. (a) MD09-3256Q (this study), SU90-03 (this study), MD09-3257 (Burckel et al., 2015), ODP1063 (Böhm et al., 2015), MD02-2594 (Negre et al., 2010) and V29-172 (Bradtmiller et al., 2014) Pa / Th; (b) MD09-3256Q (this study), SU90-03 (Chapman et al., 2000) and GeoB3910 (Burckel et al., 2015) C. wuellerstorfi
δ13C; and (c) NGRIP temperature record on the GICC05 timescale
(Kindler et al., 2014). In (a) lines pass through average Pa / Th val-ues in case of replicates, while diamonds and squares (MD09-3257) correspond to individual Pa / Th measurements. V29-172 Pa / Th values are represented by two purple diamonds. White squares in-dicate Pa / Th values not considered in core MD09-3257, as they might not be influenced by oceanic circulation only (Burckel et al., 2015). The red and blue arrows indicate the late Holocene Pa / Th values in cores MD09-3257 (0.065 ± 0.004, Burckel et al., 2015) and MD09-3256Q (0.043 ± 0.002), respectively. Error bars on Pa / Th measurements are given in Fig. S1 and Tables S7 and S8. In (b) thick lines are three-point running averages of the C.
wueller-storfiδ13C records; the black arrow indicates present-day NADW
δ13C value (∼ 1.36 ‰; the Supplement). δ13C values are given in
Table S9. In (c) numbers indicate the GIs. Red vertical bands repre-sent the GI-3, GI-8 and GI-10 time slices and the blue vertical band the HS2 time slice.
define the GI time slices. With this definition, GI time slices represent the periods of stable oceanic circulation associated with each GI. The HS2 time slice was defined in core MD09-3257 as the period of maximum sedimentary Pa / Th after the abrupt rise associated with the onset of HS2.
Sedimentary Pa / Th values associated with each time slice and core are given in Table S3. We computed uncertainties on the Pa / Th values associated with each time slice accounting
for the uncertainty on individual Pa / Th measurements and uncertainties on the age model (see the Supplement).
Both GI-8 and GI-10 time slices are associated with high temperatures recorded in Greenland ice cores. The GI-3 time slice includes both the period of high Greenland temperatures associated with GI-3 and periods of low temperatures asso-ciated with GS-4 and the beginning of GS-3. Given the low Pa / Th and high δ13C values in the intermediate equatorial core at that time, we consider that the GI-3 time slice mainly reflects interstadial conditions. However, because temporal resolution of the marine records is too low to clearly distin-guish between GI-3 and GS-4, information about the state of the AMOC during GIs derived from this time slice should be considered with caution.
2.4 Quantification of the model–data agreement
In order to quantify the agreement between simulated and measured sedimentary Pa / Th, we compute the Euclidean distance, defined as the square root of the sum of squared differences between simulated and measured Pa / Th for each core. Minimum values indicate the best agreement between simulated and measured Pa / Th (Tables S4 and S5). Note that due to the limited number of sedimentary Pa / Th records during MIS3, we can only provide an approximate estimate of water mass boundary positions. Our equatorial transect is however ideally located to record shifts in the position of the transition between southern- and northern-sourced water masses.
3 Results
3.1 Sedimentary Pa / Th data
Cores MD09-3257, MD09-3256Q and SU90-03 Pa / Th measurements were centered on HS2 and HS4 (Burckel et al., 2016; Fig. 3). No Pa / Th values were measured within HS2 in core MD09-3257 because of the presence of turbidite layers (Burckel et al., 2015). During HS4 and before HS2, the sedimentary Pa / Th ratio of core MD09-3257 rises above the production ratio of 0.093, indicating the absence of Pa export. Pa / Th variability associated with GS and GI is ob-served, with high Pa / Th values occurring during GS and low Pa / Th values during GI. Pa / Th variations in core MD09-3256Q are more muted (Fig. 3). The main Pa / Th varia-tion in core MD09-3256Q occurs during HS4, when Pa / Th values rise from ∼ 0.06 to ∼ 0.08. This increase in MD09-3256Q Pa / Th also corresponds, within dating uncertainties, with the largest Pa / Th change from ∼ 0.03 to ∼ 0.05 in core SU90-03.
Before interpreting our Pa / Th records in terms of ocean circulation changes, we need to assess whether varying lithogenic or opal fluxes impacted the scavenging intensities of Pa and Th. To do so, we use the preserved opal and232Th fluxes as tracers for past opal and terrigenous fluxes,
respec-tively (Anderson et al., 2006; Lippold et al., 2012). Core MD09-3257 Pa / Th data are mainly influenced by oceanic circulation, except during the high lithogenic flux period as-sociated with HS4 (232Th flux > 12 dpm cm−2ky−1, Fig. 3a, white squares; Burckel et al., 2015). In core MD09-3256Q, opal fluxes do not covary with the Pa / Th ratio and are very low (0.01–0.02 g cm−2kyr−1, Burckel et al., 2016; Table S6; Fig. S4a). In the Atlantic, the lowest opal flux value observed to influence the sedimentary Pa / Th ratio is 0.2 g cm−2kyr−1 (Lippold et al., 2012). Hence, given the much lower opal fluxes recorded in core MD09-3256Q and their lack of cor-relation with sedimentary Pa / Th, we conclude that biogenic silica had no (or very little) influence on Pa / Th variability. Similarly, we find no correlation between 232Th fluxes and Pa / Th values in this core (P value = 0.48, n = 22; Fig. S5a). We can therefore safely assume that the Pa / Th variability recorded in our equatorial cores is mainly driven by changes in oceanic circulation intensity.
Core SU90-03 opal fluxes are low (< 0.1 g cm−2kyr−1, Ta-ble S6) and do not show any correlation with Pa / Th data (P value = 0.52, n = 10; Fig. S4b). In contrast,232Th fluxes could be correlated to the Pa / Th signal (P value = 0.03, n =16, Fig. S5b). This correlation is only driven by the high-est Pa / Th value, and removing this single value results in the disappearance of the correlation (P value = 0.31, n = 15). However, we chose to keep this value as SU90-03232Th flux is low (< ∼ 1.5 dpm cm−2kyr−1) and its Pa / Th signal re-mains low (0.03–0.05) on the entire 20–50 ka period, indi-cating a constant significant Pa export through water mass advection. Oceanic circulation is therefore the main process explaining SU90-03 Pa / Th data.
The published Pa / Th values of other sediment cores used in this study have been shown to be mainly driven by oceanic circulation intensity (Bradtmiller et al., 2014).
3.2 C. wuellerstorfi δ13C data
C. wuellerstorfi δ13C of both equatorial cores shows millennial-scale variability, with lower δ13C values occur-ring duoccur-ring HSs (Burckel et al., 2016). GS and GI are also recorded in the δ13C record of the intermediate core by low and high δ13C values, respectively. In the deep core, the low sedimentation rate induces a low temporal resolution and a smoothing of the δ13C signal that may have erased δ13C de-creases associated with short GSs.
δ13C values during the LGM are 0.24 ± 0.07 and 0.66 ± 0.06 ‰ in the deep and intermediate equatorial core, respectively (Fig. 3). Given that the late Holocene δ13C mea-sured in the equatorial cores are both close to 1.35 ‰ (see the Supplement), these LGM δ13C values are much lower than what would be expected from the ∼ 0.3 ‰ glacial– interglacial change in mean ocean δ13C in response to a reduced continental biosphere during glacial periods (Dup-lessy et al., 1988). The low δ13C values observed during the LGM and some of the GSs could thus indicate either a
slow-down of the deep-water circulation, or an increased influ-ence of southern-sourced water masses at both sites during the glacial with respect to the Holocene.
3.3 Ocean circulation signals
In cores MD09-3257/GeoB3910, SU90-03 and ODP1063, GI time slices are generally characterized by lower Pa / Th and higher δ13C values than those characterizing GS periods (Fig. 3). The only exception is GI-10 as this period is as-sociated with a transition from relatively low to high Pa / Th values associated with HS4 in core SU90-03. Conversely, the HS2 time slice is associated with high Pa / Th values and low δ13C values in these cores, except for core SU90-03 that ex-hibits Pa / Th and δ13C values similar to GI time slices.
Core MD09-3256Q Pa / Th values are below 0.07 in all the studied time slices, with minor variability even between GI and HS2 time slices. Its δ13C record is systematically 0.4–0.5 ‰ below that of core MD09-3257, even though the δ13C difference between the two cores is reduced during HS2. Core MD09-3256Q therefore appears to be constantly bathed by a nutrient-rich water mass exporting dissolved pro-tactinium.
There is only one Pa / Th value within our GI time slices in core MD02-2594 (GI-3, Fig. 3). However, two other Pa / Th values can be attributed to both GI-8 and GI-10 as they lie within these time slices considering age model uncertainties. These low MD02-2594 Pa / Th values indicate that, during GI time slices, protactinium was exported away from the intermediate-depth South Atlantic Ocean.
In addition to the above Pa / Th records, we use one Pa / Th value from core V29-172. This value lies within the GI-3 time slice and is rather low (0.04), similarly to the shal-lower North Atlantic core SU90-03. This supports the exis-tence of Pa export between 1500 and 3500 m depth in the North Atlantic during GI-3.
4 Discussion
Time slice sedimentary Pa / Th data from the six selected At-lantic sediment cores are compared, when available, to the sedimentary Pa / Th pattern simulated in response to the dif-ferent stream functions (Figs. 4–6). We focus in particular on the equatorial cores and describe their modeled and measured sedimentary Pa / Th by referring to the vertical Pa / Th gra-dient between 2300 and 3500 m (i.e., the water depths of the sediment cores). Indeed, vertical Pa / Th gradients are use-ful indicators of the vertical layout of water masses. In what follows, we will see how each vertical gradient can be inter-preted.
0 1000 2000 3000 4000 5000 Depth (m) 0.15 0.05 0.1 0.125 0.075 0 1000 2000 3000 4000 5000 60° S 30° S EQ 30° N 60° N 0 1000 2000 3000 4000 5000 Depth (m) 0.15 0.05 0.1 0.125 0.075 0 1000 2000 3000 4000 5000 60° S 30° S EQ 30° N 60° N Latitude (degrees) 0.15 0.05 0.1 0.125 0.075 0.15 0.05 0.1 0.125 0.075 60° S 30° S EQ 30° N 60° N Latitude (degrees) 60° S 30° S EQ 30° N 60° N
(a)
(b)
(c)
(d)
HS2 data GI-3 data
GI-8 data GI-10 data
Holocene streamfunction
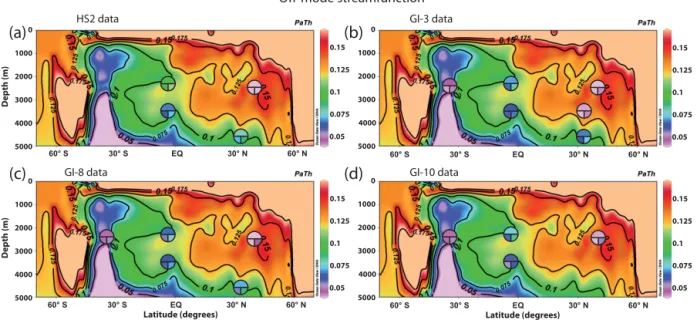
Figure 4.Comparison of the Pa / Th data (circles) for each of the time slices to the simulated Pa / Th values using the Holocene stream function. (a) HS2, (b) GI-3, (c) GI-8 and (d) GI-10 Pa / Th data. The upper half of the circles represents the Pa / Th mean value, the lower left quarter, the Pa / Th mean value −1σ , and the lower right quarter represents the Pa / Th mean value +1σ . Data gridding was achieved using the Ocean Data View software (Schlitzer, 2015).
0 1000 2000 3000 4000 5000 Depth (m) 0.15 0.05 0.1 0.125 0.075 0 1000 2000 3000 4000 5000 60° S 30° S EQ 30° N 60° N 0 1000 2000 3000 4000 5000 Depth (m) 0.15 0.05 0.1 0.125 0.075 0 1000 2000 3000 4000 5000 60° S 30° S EQ 30° N 60° N Latitude (degrees) 0.15 0.05 0.1 0.125 0.075 60° S 30° S EQ 30° N 60° N 0.15 0.05 0.1 0.125 0.075 60° S 30° S EQ 30° N 60° N Latitude (degrees) Off-mode streamfunction
(a)
(b)
(c)
(d)
HS2 data GI-3 data
GI-8 data GI-10 data
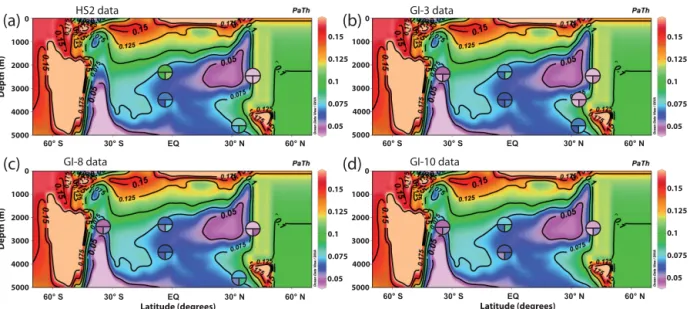
Figure 5.Comparison of the Pa / Th data for each of the time slices to the simulated Pa / Th values using the off-mode stream function. Time slices are (a) HS2, (b) GI-3, (c) GI-8 and (d) GI-10 Pa / Th data; symbols are as in Fig. 4.
4.1 Greenland interstadials (GI-3, GI-8 and GI-10 time slices)
4.1.1 Comparison with the Holocene simulation
A large vertical Pa / Th gradient between the two equato-rial core sites is simulated by the model in the presence of a southward-flowing northern-sourced deep water mass such as NADW in the Holocene simulation (Fig. 4). This is due
to the fact that the sedimentary Pa / Th ratio decreases with depth within a single water mass of uniform flow rate. This effect is intensified in the case of the Holocene stream func-tion, as the flow rate of NADW is not uniform but stronger between 2500 and 3500 m and weaker between 1300 and 2300 m (acquisition depths of sedimentary Pa / Th for the deep and intermediate cores, respectively). Hence, Pa export at 3500 m is more intense than at 2300 m, thereby
signifi-0 1000 2000 3000 4000 5000 Depth (m) 0 1000 2000 3000 4000 5000 Depth (m) 0.15 0.05 0.1 0.125 0.075 0 1000 2000 3000 4000 5000 0.15 0.05 0.1 0.125 0.075 0 1000 2000 3000 4000 5000 0.15 0.05 0.1 0.125 0.075 0.15 0.05 0.1 0.125 0.075 60° S 30° S EQ 30° N 60° N Latitude (degrees) 60° S 30° S EQ 30° N 60° N Latitude (degrees) 60° S 30° S EQ 30° N 60° N 60° S 30° S EQ 30° N 60° N
(a)
(b)
(c)
(d)
HS2 data GI-3 data
GI-8 data GI-10 data
Shallow overturning streamfunction
Figure 6.Comparison of the Pa / Th data for each of the time slices to the simulated Pa / Th values using the shallow overturning stream function. Time slices are (a) HS2, (b) GI-3, (c) GI-8 and (d) GI-10 Pa / Th data; symbols are as in Fig. 4.
cantly increasing the vertical Pa / Th gradient between the two cores.
Interstadial Pa / Th data in the deep equatorial and North Atlantic cores are consistent with simulated Pa / Th values obtained with the Holocene stream function (Fig. 4b–d). However, interstadial sedimentary Pa / Th values in the equa-torial core at intermediate depth are lower than predicted by the Pa / Th model forced with the Holocene stream func-tion. The vertical Pa / Th gradient between our equatorial cores during interstadials is small, which is in contradic-tion with the large vertical Pa / Th gradient simulated with the Holocene stream function. Moreover, data from Southern Ocean core MD02-2594 are systematically between 0.045 and 0.050 during GI (Fig. 3) and are in conflict with the high Holocene Pa / Th value (∼ 0.09) simulated at this core site (Fig. 4).
High δ13C values in the intermediate equatorial core dur-ing MIS3 interstadials suggest that northern-sourced deep waters influenced the equatorial Atlantic at 2300 m depth (Fig. 3b). However, the lower δ13C values of the deep equa-torial core imply that, unlike in the present-day Atlantic, nutrient-rich southern-sourced deep waters were present at 3500 m depth in the equatorial West Atlantic.
Therefore, both Pa / Th and δ13C data indicate that the ge-ometry and strength of the AMOC during the studied GI were different from those of the Holocene.
4.1.2 Comparison with the off-mode simulation
Pa / Th values simulated with the off-mode stream function exhibit a small vertical Pa / Th gradient between the two equatorial cores (Fig. 5). However, the sedimentary Pa / Th
values measured during interstadials are much lower than the simulated values at both equatorial sites and in the North Atlantic Ocean. These low measured Pa / Th values imply a significant export of Pa by oceanic circulation and there-fore exclude the possibility of an almost halted deep Atlantic circulation above 3500 m depth (Fig. 5b–d).
In addition, while in the off-mode stream function no sig-nificant deep convection occurs in the high-latitude North Atlantic, the high δ13C values of core SU90-03 and MD09-3257 and low δ13C values of core MD02-2594 (< 0.5 ‰, Ne-gre et al., 2010), indicate that northern-sourced waters were present at ∼ 2500 m in the North and equatorial Atlantic (Fig. 3).
Hence, it is highly unlikely that the off-mode stream func-tion depicts the deep Atlantic circulafunc-tion during the studied GI.
4.1.3 Comparison with the shallow overturning simulation
The shallow overturning stream function also induces a small vertical Pa / Th gradient between the equatorial records (Fig. 6). In contrast to the simulation obtained with the off-mode stream function, this small vertical Pa / Th gradi-ent is associated with significant lateral export of Pa at the depth of both the intermediate and deep equatorial cores, as well as at the Bermuda Rise and Southern Ocean cores, in agreement with Pa / Th data (Fig. 6b–d). Such a small ver-tical Pa / Th gradient is simulated in the case of two water masses overlying each other and flowing in opposite direc-tions (Fig. S6; Lippold et al., 2012). Indeed, in the shallow overturning stream function, northern-sourced waters affect
the depth of the intermediate equatorial core (above 2500 m). Below ∼ 4000 m, northward-flowing, southern-sourced wa-ters are active and can lead to a return flow (between 2500 and 4000 m depth) that influences the depth of the deep equatorial core (3500 m; Fig. 2e, f). This circulation scheme results in decreasing or invariant lateral export of Pa with depth, which in turns causes sedimentary Pa / Th to increase or to be constant with depth at the equator.
However, the agreement between simulated and measured Pa / Th in the Atlantic Ocean cores is lower (i.e., larger Eu-clidean distances, Table S4) with the shallow overturning stream function than with the Holocene stream function. The better model–data agreement obtained with the Holocene stream function is driven by the Pa / Th data of the inter-mediate and deep midlatitude North Atlantic cores (SU90-03 and V29-172), as the deep convection of NADW induces low modeled Pa / Th values south of 50◦N. In the shallow
over-turning stream function, the region of deep-water formation is shifted southward (Fig. 2). In the Pa / Th model, dissolved protactinium and thorium concentrations are therefore verti-cally homogenized between 40 and 60◦N (against 60–70◦N in the case of the Holocene stream function), preventing the presence of low sedimentary Pa / Th values north of ∼ 40◦N. A southward shift in the deep convection zone during the last glacial has been observed in earlier studies (e.g., Vidal et al., 1997), but the simulated southward shift in the present shallow overturning stream function could be overestimated. Assuming a more northerly position of the region of deep-water formation, the Pa / Th observed in the North Atlantic cores would agree with the shallow overturning stream func-tion. Indeed, if we remove both midlatitude North Atlantic cores from the computation of the sum of squared residuals, we find that the shallow overturning stream function best ex-plains the Pa / Th data observed during GIs (Table S5).
Interstadial benthic δ13C values at the equator indicate the presence of (1) a northern-sourced water mass at the interme-diate core site and (2) a southern-sourced water mass at the deep core site (Fig. 3b). Hence, benthic δ13C data support the existence of two water masses overlying each other and flowing in opposite directions as in the shallow overturning stream function. Moreover, the southern-sourced water mass likely affected core MD02-2594 on its way towards the deep equator site as reflected by its low benthic δ13C (< 0.5 ‰, Negre et al., 2010).
Based on our definition of the interstadial time slices, we assume that the GI-3 time slice reflects interstadial condi-tions. However, because GI-3 seen in Greenland ice cores is of relatively short duration, the Pa / Th signal of the stud-ied sediment cores might not reflect full interstadial circu-lation conditions. Nonetheless, we consider it unlikely that the Pa / Th of GI-3 reflects stadial conditions. Indeed, core MD09-3257 sedimentary Pa / Th values observed during GI-3 are similar to those recorded during the GI-8 and GI-10 time slices that correspond to strict interstadials (Fig. 3).
MD09-3257
MD09-3256Q
?
Southern sourced water, low δ13C
MD09-3257
MD09-3256Q
?
Southern sourced water,
low δ13C Northern sourced water,high δ13C
(a) (b) Greenland Interstadials Heinrich stadial 2 ODP1063 ODP1063 5-20 Sv 5-20 Sv 2300 m 3500 m 4500 m 2300 m 3500 m 4500 m MD02-2594 MD02-2594
Northern sourced water, high δ13C SU90-03 SU90-03 Weak overturning ?
Figure 7. Sketch of the possible states of the AMOC during (a) Greenland interstadials and (b) Heinrich stadial 2. Red and blue arrows depict the southern and northern-sourced water mass, re-spectively. The arrows’ thickness reflects the overturning rate. Core names are colored depending on which water mass influences them. In (b), cores MD09-3257 and MD02-2594 names are in black as we have no direct evidence of which water mass influences the South Atlantic Ocean during HS2. The exact position of the northward-flowing, southern-sourced water mass and its possible return flow (dashed red line) is also unknown.
There are several studies discussing a potential link be-tween Dansgaard–Oeschger events and Atlantic circulation changes (Gottschalk et al., 2015; see Boyle, 2000 for a review), but to our knowledge, there has been no study about the geometry of the AMOC water masses during these periods. Combining the information provided by sedimen-tary Pa / Th and benthic foraminiferal δ13C data, we reach the following conclusions concerning the Atlantic circula-tion below ∼ 1300 m during the studied GIs. A southward-flowing, northern-sourced water mass likely circulated above ∼2500 m, while southern-sourced deep water circulated northwards below ∼ 4000 m and southwards as a return flow between ∼ 2500 and 4000 m depth (Figs. 2f, 7a). Moreover, our data indicate that the geometry and state of the AMOC appear similar for GI-3, GI-8 and GI-10, despite the different ice sheet volumes characterizing the periods encompassing HS2 and HS4, respectively.
4.1.4 Estimation of the AMOC intensity over the interstadial time slices
Our Holocene equatorial Pa / Th values are in reasonable agreement with previously published data from the Brazilian margin (Lippold et al., 2011) and with Pa / Th values simu-lated with a 2- and 3-fold increased Holocene stream func-tion (Fig. S7). At present, increasing the Holocene stream function is indeed necessary to improve the agreement
be-tween simulated and measured equatorial Pa / Th values (Lippold et al., 2011). This increase was proposed to account for the absence of west–east difference in circulation strength in the 2-D Pa / Th model, which reflects a zonally averaged circulation. Moreover, the width of the Atlantic basin is the shortest at the equator, while it is assumed constant in the model. Both these effects could cause the flow speed at the equator to be underestimated and therefore the simulated Pa / Th ratio to be overestimated.
We performed sensitivity tests of the Pa / Th model to varying flow rates by multiplying the shallow overturning stream function by a factor of 1, 2 and 3. Our results indi-cate that factors of 1 and 2 best reproduce the sedimentary Pa / Th ratio in the Atlantic during GI time slices (Table S5). When using the shallow overturning stream function, the flow of both the northern and southern-sourced water masses at the equator is of 5–10 Sv. As this stream function amplified by a factor of 1 and 2 best agrees with our interstadial Pa / Th data, we assume that the water-mass flow rates provided by these shallow overturning stream functions (5–20 Sv) depict well the oceanic circulation strength during the studied inter-stadials. The modern flow rates of NADW (northern-sourced water mass) and AABW (southern-sourced water mass) are ∼27 ± 7 and ∼ 3 Sv at 4.5◦S, respectively (Lux et al., 2001). We conclude that during GI-3, GI-8 and GI-10, the flow rate of the southern-sourced deep water was likely larger than present-day AABW and that the flow rate of the northern-sourced deep water may have been smaller than present-day NADW.
4.2 Heinrich stadial 2
4.2.1 Comparison with the shallow overturning simulation
Pa / Th data from the HS2 time slice display a large vertical Pa / Th gradient between the depths of our equatorial cores (Figs. 4a, 5a or 6a). The gradient results from the high Pa / Th value at intermediate depth, which indicates that the core was likely overlain by sluggish waters. Pa / Th data in the equa-torial cores are therefore incompatible with the low vertical Pa / Th gradient simulated by the shallow overturning stream function (Fig. 6, Table S4).
Moreover, the decrease in benthic δ13C values in both equatorial cores during HS2 is incompatible with the active northern-sourced circulation cell simulated above 2500 m with the shallow overturning stream function (Fig. 3, b).
Hence, both circulation and ventilation proxies indicate that there was no intense northern-sourced water flow be-tween 1300 and 2300 m depth at the equator during HS2. 4.2.2 Comparison with the Holocene simulation
Large vertical Pa / Th gradients are simulated in the model when a single water mass affects both equatorial cores. Pa / Th values simulated with the Holocene stream function
therefore best fit Pa / Th data during HS2 (Fig. 4a, Table S4). However, the very low benthic δ13C values measured in both equatorial cores during HSs (Fig. 3b) exclude the presence of an active northern-sourced deep-water mass in the inter-mediate and deep equatorial Atlantic at that time.
Hence, it is unlikely that the Holocene stream function de-picts the geometry and strength of the AMOC during HS2.
4.2.3 Comparison with the off-mode simulation
In contrast, Pa / Th values simulated with the off-mode stream function could reconcile the large Pa / Th vertical gradient and the low δ13C of equatorial cores (Fig. 5a). In the current off-mode simulation by the iLOVECLIM model, the vertical extent of the southern-sourced water mass is not large enough to influence the equatorial core at 3500 m depth, resulting in an apparent low vertical Pa / Th gradient (Fig. 2c, d). However, the model was run for a short period of time, preventing a full response of the southern-sourced deep wa-ters to varying climatic and oceanographic conditions (Roche et al., 2014). Hence, the vertical extent of the southern-sourced water mass could be larger, thereby inducing a low sedimentary Pa / Th ratio in the deepest core of the Brazil-ian margin. Pa / Th data from the Bermuda Rise and South Atlantic cores are consistent with simulated Pa / Th values from the off-mode stream function. However, the Pa / Th data from the intermediate North Atlantic core are not in agreement with the modeled Pa / Th, as there is no deep-water formation in the high-latitude North Atlantic in the off-mode stream function.
The very low benthic δ13C values measured in the deep equatorial core during HS2 are consistent with the simulation using the off-mode stream function, which shows a strong influence of southern-sourced water masses in the deep At-lantic. This is further supported by the increased εNdin the
Bermuda Rise core which indicates an increased influence of southern-sourced water masses at 4500 m in the North At-lantic Ocean during HS2 (Gutjahr and Lippold, 2011).
The off-mode simulation could therefore explain both Pa / Th and δ13C values in the deep Atlantic and interme-diate equatorial Atlantic, but neither this stream function nor the others are able to explain the Pa / Th record of the North Atlantic core at ∼ 2500 m depth.
4.2.4 Geometry and strength of the AMOC during HS2 The low Pa / Th and high benthic δ13C observed in core SU90-03 indicates that deep convection was still active in the high-latitude North Atlantic during HS2. However, the resulting water mass was probably slow enough so that its nutrient content significantly raised on its way towards the equator either through turbulent and diffusive mixing with the underlying water mass or through the degradation of12 C-rich organic matter sinking from surface waters. This would explain the low δ13C values measured in the intermediate
equatorial core. Similarly, a long transit time of the water mass from the North Atlantic deep convection sites to the Brazilian margin could explain the high Pa / Th values mea-sured in the intermediate equatorial core, as dissolved Pa was allowed sufficient time to equilibrate through reversible ex-change with particulate matter. This progressive equilibration could have led to the sedimentary Pa / Th latitudinal gradient observed at ∼ 2500 m depth, from low sedimentary Pa / Th values in the midlatitude North Atlantic (SU90-03) to high values in the equatorial Atlantic (MD09-3257; Fig. 5a).
Considering that both Pa / Th and benthic δ13C values sug-gest an increased influence of southern-sourced waters at the equatorial and Bermuda Rise deep sites, the off-mode stream function best depicts the geometry of the AMOC dur-ing HS2 below 2500 m, i.e., southern-sourced deep waters likely filled the deep Atlantic Ocean (Fig. 7b). The influence of the southern-sourced water mass likely extended vertically above 3500 m depth, probably at least up to 2500 m depth, as indicated by the low Pa / Th value of the deep equato-rial core. However, given the discrepancy between the off-mode simulation and observed Pa / Th values in the North Atlantic intermediate core, it is difficult to assess the exact latitudinal and vertical extent of the southern-sourced waters. Above 2500 m, a weak water flow originating from northern deep convection sites probably influenced the Atlantic, per-haps down to equatorial latitudes (Fig. 7b).
The geometry of the Atlantic deep water masses inferred from our sedimentary Pa / Th and benthic δ13C records dur-ing HS2 is consistent with previous modeldur-ing experiments (e.g., Ganopolski and Rahmstorf, 2001) and with water mass ventilation (Elliot et al., 2002; Vidal et al., 1997; Zahn et al., 1997) and circulation intensity (Gherardi et al., 2005; Mc-Manus et al., 2004) proxies indicating that deep water cir-culation slowed down during Heinrich stadials. Furthermore, our data indicate that a northern-sourced water mass was ac-tive above 2500 m during HS2, as inferred for HS1 (Gherardi et al., 2009; Roche et al., 2014) and HS2 (Lynch-Stieglitz et al., 2014; Wary et al., 2015) in previous studies. However, quantifying the intensity of the AMOC upper circulation cell during this period remains difficult since there is at present no numerical simulation in reasonably good agreement with both the circulation and ventilation proxies measured in the Atlantic.
5 Conclusions
We have shown that both the geometry and strength of the AMOC during three interstadials of the last glacial period (i.e., the GI-3, GI-8 and GI-10 intervals) was markedly differ-ent from those of the modern AMOC. Our data suggest that a northern-sourced water mass circulated above 2500 m depth with a flow rate ranging between 5 and 20 Sv, which is lower than the intensity of present-day NADW. Below 4000 m, a southern-sourced deep water mass likely flowed northward
with an intensity of 5–20 Sv, which is larger than the mod-ern AABW flow rate. Between 2500 and 4000 m depth, the southern-sourced deep water likely circulated southwards as a return flow.
Our data also show that the geometry of the AMOC likely changed at the onset of HS2 and that the deep Atlantic below 2500 m was then probably dominated by a single southern-sourced water mass that can be traced up to 35◦N at 4500 m. This water mass probably affected the equatorial Atlantic be-tween 2500 and 3500 m depth. A slow, southward-flowing water likely circulated between 1500 and 2500 m in the North Atlantic, but its presence at the equator remains dif-ficult to assess.
6 Data availability
Data related to this article are available as a supplement file and on PANGAEA (doi:10.1594/PANGAEA.865401).
The Supplement related to this article is available online at doi:10.5194/cp-12-2061-2016-supplement.
Author contributions. Pierre Burckel, Claire Waelbroeck, Syl-vain Pichat, Jeanne Gherardi and Jörg Lippold designed the re-search; Pierre Burckel, Samuel L. Jaccard and François Thil per-formed the sedimentary Pa / Th measurements; Samuel L. Jaccard and Jörg Lippold performed the opal measurements; Aline Govin performed the XRF measurements; Yiming Luo generated the sim-ulated Pa / Th data; and Didier M. Roche generated the stream func-tions. Pierre Burckel and Claire Waelbroeck wrote the manuscript.
Acknowledgements. Pa / Th measurements were funded by the
CNRS/INSU LEFE project ACCENT. This work is a contribution to the RETRO project, a joint European Science Foundation (ESF)/EUROMARC, funded by Research Council of Norway (RCN), France (CNRS/INSU), Germany and the Netherlands, and to the ACCLIMATE ERC project. The research leading to these results has received funding from the European Re-search Council under the European Union’s Seventh Framework Programme (FP7/2007-2013)/ERC grant agreement no. 339108. Samuel L. Jaccard was funded by the Swiss National Foundation (grants PBEZ2-111588 and PP00P2_144811). Cores MD09-3256Q and MD09-3257 were collected on board R/V Marion Dufresne during RETRO Cruise III, supported by ESF EUROMARC project RETRO, IPEV and ANR project ANR-09-BLAN-0347. We thank the IPEV team, crew members of R/V Marion Dufresne and all scientists who participated in RETRO Cruise III. We are thankful to M. Roy-Barman for expert advice on Pa / Th measurements on LSCE MC-ICP-MS. We acknowledge C. Moreau, J.-P. Dumoulin
and the UMS ARTEMIS for AMS 14C dates, and G. Isguder,
L. Mauclair and F. Dewilde for invaluable technical assistance. We are thankful to Roger Francois and one anonymous reviewer
for their constructive comments which helped to clarify this manuscript. This is LSCE contribution 5757.
Edited by: L. Beaufort
Reviewed by: R. Francois and one anonymous referee
References
Anderson, R. F., Fleisher, M. Q., and Lao, Y.: Glacial-interglacial variability in the delivery of dust to the central equato-rial Pacific Ocean, Earth Planet. Sc. Lett., 242, 406–414, doi:10.1016/j.epsl.2005.11.061, 2006.
Böhm, E., Lippold, J., Gutjahr, M., Frank, M., Blaser, P., Antz, B., Fohlmeister, J., Frank, N., Andersen, M. B., and Deininger, M.: Strong and deep Atlantic meridional overturning cir-culation during the last glacial cycle, Nature, 517, 73–76, doi:10.1038/nature14059, 2015.
Bourillet, J.-F., Damy, G., Dussud, L., Sultan, N., Woerther, P., and Migeon, S.: Behaviour Of A Piston Corer From Accelerometers And New Insights On Quality Of The Recovery., Proc. 6th Int. Off shore Site Investig, Geotech. Conf., Confronting New Chal-lenges Shar, Knowledge, 11–13 Sept. 2007, London, UK, avail-able at: http://archimer.ifremer.fr/doc/00071/18198/ (last access: 3 November 2016), 2007.
Boyle, E. A.: Is ocean thermohaline circulation linked to abrupt sta-dial/interstadial transitions?, Quaternary Sci. Rev., 19, 255–272, doi:10.1016/S0277-3791(99)00065-7, 2000.
Bradtmiller, L. I., McManus, J. F., and Robinson, L. F.: 231Pa / 230Th evidence for a weakened but persistent Atlantic meridional overturning circulation during Heinrich Stadial 1, Nat. Commun., 5, 5817, doi:10.1038/ncomms6817, 2014. Broecker, W. S., Peteet, D. M., and Rind, D.: Does the
ocean-atmosphere system have more than one stable mode of opera-tion?, Nature, 315, 21–26, doi:10.1038/315021a0, 1985. Burckel, P., Waelbroeck, C., Gherardi, J. M., Pichat, S., Arz, H.,
Lippold, J., Dokken, T., and Thil, F.: Atlantic Ocean circula-tion changes preceded millennial tropical South America rainfall events during the last glacial, Geophys. Res. Lett., 42, 411–418, doi:10.1002/2014GL062512, 2015.
Burckel, P., Waelbroeck, C., Luo, Y., Roche, D. M., Pichat, S., Jac-card, S. L., Gherardi, J.-M., Govin, A., Lippold, J., and Thil, F.: The Atlantic Meridional Overturning Circulation during the last glacial, Dataset #865401, doi:10.1594/PANGAEA.865401, 2016.
Chapman, M. R., Shackleton, N. J., and Duplessy, J.-C.: Sea sur-face temperature variability during the last glacial–interglacial cycle: assessing the magnitude and pattern of climate change in the North Atlantic, Palaeogeogr. Palaeocl., 157, 1–25, doi:10.1016/S0031-0182(99)00168-6, 2000.
Chase, Z., Anderson, R. F., Fleisher, M. Q., and Kubik, P. W.: The influence of particle composition and particle flux on scavenging of Th, Pa and Be in the ocean, Earth Planet. Sc. Lett., 204, 215– 229, doi:10.1016/S0012-821X(02)00984-6, 2002.
Choi, M. S., Francois, R., Sims, K., Bacon, M. P., Brown-Leger, S., Fleer, a P., Ball, L., Schneider, D., and Pichat, S.: Rapid
deter-mination of230Th and231Pa in seawater by desolvated
micro-nebulization Inductively Coupled Plasma magnetic sector mass spectrometry, Mar. Chem., 76, 99–112, 2001.
Christl, M., Lippold, J., Hofmann, A., Wacker, L., Lahaye, Y., and Synal, H. A.: 231Pa / 230Th: A proxy for upwelling off the coast of West Africa, Nucl. Instrum. Meth. B, 268, 1159–1162, doi:10.1016/j.nimb.2009.10.123, 2010.
Coplen, T. B.: Normalization of oxygen and hydrogen isotope data, Chem. Geol. Isot. Geosci. Sect., 72, 293–297, doi:10.1016/0168-9622(88)90042-5, 1988.
Curry, W. B. and Oppo, D. W.: Glacial water mass
geom-etry and the distribution of delta 13C of Sigma CO2 in
the western Atlantic Ocean, Paleoceanography, 20, 1–12, doi:10.1029/2004PA001021, 2005.
Curry, W. B., Duplessy, J. C., Labeyrie, L. D., and Shackleton, N. J.: Changes in the distribution of δ13C of deep water 6CO2 be-tween the Last Glaciation and the Holocene, Paleoceanography, 3, 317–341, doi:10.1029/PA003i003p00317, 1988.
Duplessy, J. C., Shackleton, N. J., Fairbanks, R. G., Labeyrie, L., Oppo, D., and Kallel, N.: Deepwater source variations during the last climatic cycle and their impact on the global deepwater circulation, Paleoceanography, 3, 343–360, doi:10.1029/PA003i003p00343, 1988.
Duplessy, J.-C., Shackleton, N. J., Matthews, R. K., Prell, W., Rud-diman, W. F., Caralp, M., and Hendy, C. H.: 13C Record of benthic foraminifera in the last interglacial ocean: Implications for the carbon cycle and the global deep water circulation, Qua-ternary Res., 21, 225–243, doi:10.1016/0033-5894(84)90099-1, 1984.
Elliot, M., Labeyrie, L., and Duplessy, J. C.: Changes in North Atlantic deep-water formation associated with the Dansgaard – Oeschger temperature oscillations (60–10 ka), Quaternaary Sci. Rev., 21, 1153–1165, doi:10.1016/S0277-3791(01)00137-8, 2002.
Francois, R.: Paleoflux and Paleocirculation from Sediment 230Th
and231Pa /230Th, in Proxies in Late Cenozoic
Paleoceanogra-phy, Elsevier, 1, 681–716, 2007.
Ganopolski, A. and Rahmstorf, S.: Rapid changes of glacial cli-mate simulated in a coupled clicli-mate model, Nature, 409, 153– 158, doi:10.1038/35051500, 2001.
Gherardi, J. M., Labeyrie, L., McManus, J. F., Francois, R., Skin-ner, L. C., and Cortijo, E.: Evidence from the Northeastern At-lantic basin for variability in the rate of the meridional overturn-ing circulation through the last deglaciation, Earth Planet. Sc. Lett., 240, 710–723, doi:10.1016/j.epsl.2005.09.061, 2005. Gherardi, J.-M., Labeyrie, L., Nave, S., Francois, R.,
Mc-Manus, J. F., and Cortijo, E.: Glacial-interglacial
circula-tion changes inferred from 231Pa /230Th sedimentary record
in the North Atlantic region, Paleoceanography, 24, 1–14, doi:10.1029/2008PA001696, 2009.
Gottschalk, J., Skinner, L. C., Misra, S., Waelbroeck, C., Menviel, L., and Timmermann, A.: Abrupt changes in the southern ex-tent of North Atlantic Deep Water during Dansgaard-Oeschger events, Nat. Geosci, 8, 950–954, doi:10.1038/ngeo2558, 2015. Guihou, A., Pichat, S., Nave, S., Govin, A., Labeyrie, L., Michel, E.,
and Waelbroeck, C.: Late slowdown of the Atlantic Meridional Overturning Circulation during the Last Glacial Inception: New constraints from sedimentary (231Pa / 230Th), Earth Planet. Sc. Lett., 289, 520–529, doi:10.1016/j.epsl.2009.11.045, 2010. Guihou, A., Pichat, S., Govin, A., Nave, S., Michel, E.,
Du-plessy, J. C., Telouk, P., and Labeyrie, L.: Enhanced At-lantic Meridional Overturning Circulation supports the Last
Glacial Inception, Quaternary Sci. Rev., 30, 1576–1582, doi:10.1016/j.quascirev.2011.03.017, 2011.
Gutjahr, M. and Lippold, J.: Early arrival of Southern Source Wa-ter in the deep North Atlantic prior to Heinrich event 2, Paleo-ceanography, 26, 1–9, doi:10.1029/2011PA002114, 2011. Hall, I. R., Moran, S. B., Zahn, R., Knutz, P. C., Shen, C. C.,
and Edwards, R. L.: Accelerated drawdown of meridional over-turning in the late-glacial Atlantic triggered by transient pre-H event freshwater perturbation, Geophys. Res. Lett., 33, 1–5, doi:10.1029/2006GL026239, 2006.
Heinrich, H.: Origin and consequences of cyclic ice rafting in the Northeast Atlantic Ocean during the past 130,000 years, Qua-ternary Res., 29, 142–152, doi:10.1016/0033-5894(88)90057-9, 1988.
Jaeschke, A., Rühlemann, C., Arz, H., Heil, G., and Lohmann, G.: Coupling of millennial-scale changes in sea surface temperature and precipitation off northeastern Brazil with high-latitude cli-mate shifts during the last glacial period, Paleoceanography, 22, 1–10, doi:10.1029/2006PA001391, 2007.
Johnsen, S. J., Clausen, H. B., Dansgaard, W., Fuhrer, K., Gun-destrup, N., Hammer, C. U., Iversen, P., Jouzel, J., Stauf-fer, B., and Steffensen, J. P.: Irregular glacial interstadials recorded in a new Greenland ice core, Nature, 359, 311–313, doi:10.1038/359311a0, 1992.
Jonkers, L., Zahn, R., Thomas, A., Henderson, G., Abouchami, W., Francois, R., Masque, P., Hall, I. R., and Bickert, T.: Deep circu-lation changes in the central South Atlantic during the past 145 kyrs reflected in a combined Pa-231 / Th-230, Neodymium iso-tope and benthic delta C-13 record, Earth Planet. Sc. Lett., 419, 14–21, doi:10.1016/j.epsl.2015.03.004, 2015.
Kindler, P., Guillevic, M., Baumgartner, M., Schwander, J., Landais, A., and Leuenberger, M.: Temperature reconstruction from 10 to 120 kyr b2k from the NGRIP ice core, Clim. Past, 10, 887–902, doi:10.5194/cp-10-887-2014, 2014.
Lambeck, K. and Chappell, J.: Sea level change
through the last glacial cycle, Science, 292, 679–686, doi:10.1126/science.1059549, 2001.
Lippold, J., Gherardi, J. M., and Luo, Y.: Testing the 231Pa/230Th paleocirculation proxy: A data versus 2-D model comparison, Geophys. Res. Lett., 38, 1–7, doi:10.1029/2011GL049282, 2011. Lippold, J., Luo, Y., Francois, R., Allen, S. E., Gherardi, J., Pichat, S., Hickey, B., and Schulz, H.: Strength and geometry of the glacial Atlantic Meridional Overturning Circulation, Nat. Geosci., 5, 813–816, doi:10.1038/ngeo1608, 2012.
Luo, Y., Francois, R., and Allen, S. E.: Sediment231Pa /230Th as a
recorder of the rate of the Atlantic meridional overturning cir-culation: insights from a 2-D model, Ocean Sci., 6, 381–400, doi:10.5194/os-6-381-2010, 2010.
Lux, M., Mercier, H., and Arhan, M.: Interhemispheric exchanges of mass and heat in the Atlantic Ocean in January–March 1993, Deep-Sea Res. Pt. I, 48, 605–638, doi:10.1016/S0967-0637(00)00033-9, 2001.
Lynch-Stieglitz, J., Stocker, T. F., Broecker, W. S., and Fairbanks, R. G.: The influence of air-sea exchange on the isotopic com-position of oceanic carbon: Observations and modeling, Global Biogeochem. Cy., 9, 653–665, doi:10.1029/95GB02574, 1995. Lynch-Stieglitz, J., Schmidt, M. W., Gene Henry, L., Curry,
W. B., Skinner, L. C., Mulitza, S., Zhang, R., and Chang, P.: Muted change in Atlantic overturning circulation over
some glacial-aged Heinrich events, Nat. Geosci., 7, 1–7, doi:10.1038/ngeo2045, 2014.
McManus, J. F., Francois, R., Gherardi, J.-M., Keigwin, L. D., and Brown-Leger, S.: Collapse and rapid resumption of Atlantic meridional circulation linked to deglacial climate changes, Na-ture, 428, 834–837, doi:10.1038/nature02494, 2004.
Negre, C., Zahn, R., Thomas, A. L., Masqué, P., Henderson, G. M., Martínez-Méndez, G., Hall, I. R., and Mas, J. L.: Reversed flow of Atlantic deep water during the Last Glacial Maximum, Nature, 468, 84–88, doi:10.1038/nature09508, 2010.
Rasmussen, S. O., Bigler, M., Blockley, S. P., Blunier, T., Buchardt, S. L., Clausen, H. B., Cvijanovic, I., Dahl-Jensen, D., Johnsen, S. J., Fischer, H., Gkinis, V., Guillevic, M., Hoek, W. Z., Lowe, J. J., Pedro, J. B., Popp, T., Seierstad, I. K., Steffensen, J. P., Svensson, A. M., Vallelonga, P., Vinther, B. M., Walker, M. J. C., Wheatley, J. J., and Winstrup, M.: A stratigraphic framework for abrupt climatic changes during the Last Glacial period based on three synchronized Greenland ice-core records: refining and ex-tending the INTIMATE event stratigraphy, Quaternary Sci. Rev., 106, 14–28, doi:10.1016/j.quascirev.2014.09.007, 2014. Reimer, P. J., Bard, E., Bayliss, A., Beck, J. W., Blackwell, P. G.,
Ramsey, C. B., Buck, C. E., Cheng, H., Edwards, R. L., Friedrich, M., Grootes, P. M., Guilderson, T. P., Haflidason, H., Hajdas, I., Hatte, C., Heaton, T. J., Hoffmann, D. L., Hogg, A. G., Hughen, K. A., Kaiser, K. F., Kromer, B., Manning, S. W., Niu, M., Reimer, R. W., Richards, D. A., Scott, E. M., Southon, J. R., Staff, R. A., Turney, C. S. M., and van der Plicht, J.: IntCal13 and Marine13 Radiocarbon Age Calibration Curves 0–50 000 years Cal BP, Radiocarbon, 55, 1869–1887, 2013.
Rhein, M., Stramma, L., and Send, U.: The Atlantic Deep Western Boundary Current?, Water masses and transports near the equa-tor, 100, 2441–2457, 1995.
Roche, D. M., Dokken, T. M., Goosse, H., Renssen, H., and We-ber, S. L.: Climate of the Last Glacial Maximum: sensitivity studies and model-data comparison with the LOVECLIM cou-pled model, Clim. Past, 3, 205–224, doi:10.5194/cp-3-205-2007, 2007.
Roche, D. M., Wiersma, A. P., and Renssen, H.: A systematic study of the impact of freshwater pulses with respect to different geo-graphical locations., Clim. Dynam., 34, 997–1013, 2010. Roche, D. M., Paillard, D., Caley, T., and Waelbroeck, C.: LGM
hosing approach to Heinrich Event 1: results and perspectives from data–model integration using water isotopes, Quaternary Sci. Rev., 106, 247–261, doi:10.1016/j.quascirev.2014.07.020, 2014.
Rohling, E. and Cooke, S.: Stable oxygen and carbon iso-topes in foraminiferal carbonate shells, Mod. foraminifera,
239–258, available at: http://www.springerlink.com/index/
R519428618723716.pdf (last access: 3 November 2016), 2003. Schlitzer, R.: Electronic Atlas of WOCE Hydrographic and Tracer
Data Now Available, Eos Trans. AGU, 81, 45, 2000.
Schlitzer, R.: Ocean Data View, http://odv.awi.de (last access: 3 November 2016), 2015.
Schott, F. A.: The zonal currents and transports at 35◦W
in the tropical Atlantic, Geophys. Res. Lett., 30, 35–38, doi:10.1029/2002GL016849, 2003.
Skinner, L. C. and McCave, I. N.: Analysis and modelling of gravity- and piston coring based on soil mechanics, Mar. Geol., 199, 181–204, doi:10.1016/S0025-3227(03)00127-0, 2003.