Figure S1.
The stress predominantly affects the first phase of heart regeneration.
(A-K) Heart sections at 60 dpci after AFOG staining were analyzed in the same manner as described in Fig. 2. After
cryoinjury, zebrafish were subjected to daily stress either during the whole period of 60 days (crowding: C-E) or only
during the first 30 days (crowding: F-H; heat shock: I-L). (L-P) Heart sections at 30 dpci after AFOG staining. In this
case, zebrafish were exposed to daily crowding either during the first 2 weeks (L-N) or during the final 2 weeks (O,
P). (L-N) The cryoinjured hearts of fish that were stressed for the first 2 weeks followed by 2 weeks of recovery at
normal conditions display impaired regeneration. 78% of the animals displayed a partial or complete blockage of
heart regeneration. (O, P) The cryoinjured hearts of fish that were kept at normal conditions for the first 2 weeks
and then exposed to stress for the final 2 weeks, regenerated the hearts. The analysis of the regenerative process
in the different groups revealed that daily exposure to stress has a stronger impact on the initial phase of heart
regeneration. (Q) Analysis of the body weights before cryoinjuries and at 30 dpci revealed no significant weight
changes during this period in control and stressed animals. (R) Glucose measurements revealed higher levels of
blood glucose in the control animals as compared to stressed fish at 30 dpci.
N≥8. No difference was observed at
7 dpci. Data are represented as mean ± SEM. **P < 0.01; N=5.
Scale bar (A) = 100 μm.
Crowding
d 0
15
30
d 0
15
30
Crowding
L
M
N
O
P
2/9
5/9
2/9
8/9
1/9
H
H
MUSCLE
FIBRIN
COLLAGEN
A
Complete
Partial
Blocked
B
F
G
I
J
K
9/11
2/11
1/8
5/8
2/8
Control
d 0
30
60
d 0
30
60
C
6/10
D
3/10
E
1/10
4/9
2/9
3/9
d 0
30
60
Crowding
d 0
30
60
Heat shock
CrowdingCrowding
Empty
category
Empty
category
0.0
0.1
0.2
0.3
0.4
Ctrl
Crow
n.s.
n.s.
before cryo
30 dpci
Q
Glucose (mmol/l)
R
**
0
1
2
3
4
5
Ctrl
Crow
7 dpci
30 dpci
Body weight (g)
Figure S2.
Rapid cardiac growth is affected by daily acute stress exposure.
(
A, B) Sections of hearts of control and stressed zebrafish 10 days after the transfer to low density conditions (3 fish / 10
liters) stained with antibodies against Tropomyosin (TPM, red), MCM5, a G1/S-phase marker (green) and with DAPI
(blue). Juvenile zebrafish (2 months of age) were exposed 2 x per day to crowding (10 fish/ 250ml during 1h) during 10
days to investigate the effect of stress on cardiac homeostatic growth. (
A’, B’) Higher magnifications of the framed area
shown in (A, B). A higher number of proliferating cardiac cells (CMs and non CMs) were identified in the control fish when
compared to the stressed animals (arrows). (
C) Bar graphs show the percentage of proliferating cells (MCM5-positive
DAPI-positive / DAPI-positive in the tropomyosin-labeled myocardium) in the animals maintained at high density (5 fish
per liter) and in control and stressed animals transferred to low density conditions (3 fish in 10 liters). Ventricles exposed
to daily stress (10 fish/ 250 ml, 2 x 1h/day) showed a significantly lower proportion of proliferating cardiac cells than
control hearts. (
D) Bar graphs show the average weight of the animals at day 0, after 10 days in high density conditions
(3 fish in 1 liter), after 10 days in low density conditions (3 fish in 10 liters) and after 10 days in low density conditions with
daily exposure to crowding (10 fish/ 250 ml, 2 x 1h/day). Data are represented as mean ± SEM. *P < 0.05, **P < 0.01 ***P
< 0.001, ****P < 0.0001; N≥4.
C
Cellular proliferation in the whole heart
after 10 days
D
Weight of the animals after 10 days
weigth (mg)
0
50
100
150
200
250
High
density
3 fish/l
Low
density
3 fish/10 l
Low
density
3 fish/10 l
+ Crow
d 0
+ 10 days
**
n.s.
n.s.
% MCM5-positive cells / DAPI
+ 10 days
High
density
3 fish/l
Low
density
3 fish/10 l
Low
density
3 fish/10 l
+ Crow
0
1
2
3
4
*
***
****
L
O
R
T
N
O
C
Low density: control
7 dpci
Low density + crowding
A
B
MCM5
TPM
DAPI
B’
A’
A’
B’
MCM5
TPM
Figure S3.
The concomitant administration of dexamethasone and adrenaline after cryoinjury mimics the effect of stress
on heart regeneration.
(
A, B) Representative images of cryoinjured hearts at 30 dpci labeled with phalloidin (red, F-actin), dapi (blue) and
antibody against L-Plastin (green, leukocytes). (
A’, B’) Higher magnification of the frame areas shown in (A, B). (C)
Quantification of L-Plastin-positive area normalized to the total area of the ventricles revealed no significant effect of
daily acute dexamethasone (2 mg/l) treatment on cardiac inflammation. N > 4. (
D-M) Sections of hearts at 30 days post
cryoinjury (dpci) after Aninlin blue acid Fuchsin Orange-G (AFOG). (
F-M) The acute administration (1 hour per day) of
dexamethasone (Dex, 2 mg/l) alone (H-J) or concomitantly with adrenaline (adr, 1 mg/l) (K-M) resulted in cardiac
regen-erative impairment in 50% and 62.5% of the fish, respectively. In contrast, animals treated with adrenaline alone during
1 hour per day displayed similar regenerative scores as the control (D-G). (
N-P) Heart sections of cmlc2::dsRed2-Nuc
transgenic zebrafish at 7 dpci immunostained against MCM5 (green). (
N’-P’) Higher magnification of the framed areas
shown in (N-P). Proliferating CMs could be identified in all groups by the overlap between MCM5 and DsRed
(arrowheads). In contrast to adrenaline (1 mg/l, 1h /day), the treatment with glucocorticoid (hydrocortisone, 1 mg/l) lead
to a reduction in CM proliferation at 7 dpci. Cryoinjured parts are encircled with a dashed line. Scale bar (A, D, N) = 100
μm.
N
N’
O
B’)
O’
cmlc2::dsRed2-Nuc
MCM5
P
P’
N’
O’
Control 7 dpci
Adrenaline 7 dpci
Glucocorticoid 7 dpci
P’
Control
D
Complete
E
Partial
Adr
.+ Dex. 1 h/ day
Adr
. 1 h/ day
Dex. 1 h/ day
9/10
1/10
3/8
3/8
2/8
9/10
1/10
4/8
1/8
3/8
F
G
H
I
J
K
L
M
Blocked
MUSCLE
FIBRIN
COLLAGEN
30 dpci
Empty
category
Empty
category
L-Plastin
Phalloidin
Dapi
Control 30 dpci
Dex 1 h/ day 30 dpci
0.0
0.5
1.0
1.5
2.0
2.5
% of L-Plastin positive area
Ctrl Dex 1 h/ day
n.s.
C
A
A’
B
B’ A’B’
Figure S4.
Propranolol and fluoxetine hydrochloride administration have a beneficial effect on cardiac
regeneration in the stressed animals.
(
A-L) Heart sections at 30 dpci after AFOG staining. (E-L) The treatment of the stressed animals
with propranolol (1 mg/l, 1 h/day, 3 days pretreatment, H, I) and fluoxetine hydrochloride (100 μg
/l, continuous, 2 weeks pretreatment, J-L) had a significant rescue effect on the stress-induced
regenerative impairment whereas the administration of diazepam (1 mg/l, continuous, 3 days
pretreatment, E-G) did not rescue the negative effect of stress on heart regeneration. Scale bar (A)
= 100 μm.
MUSCLE
FIBRIN
COLLAGEN
30 dpci
Complete
Partial
Blocked
Control
A
8/9
B
1/9
Crow + Prop
6/8
2/8
H
I
Crow + Flx. H.
J
6/13
K
5/13
L
2/13
3/10
7/10
Crow
C
D
Empty
category
Empty
category
Empty
category
Crow + Dzp
1/8
2/8
E
F
G
5/8
TOXIC
Diazepam
(Valium®, potentiates GABAa
receptor)
RU486
(glucocorticoid antagonist)
Fluoxetine hydrochloride
(Prozac®, serotonin re-uptake
inhibitor)
Propranolol
(Non-selective β-adrenoreceptor
antagonist)
HYPOTHALAMUS
CRH
ACTH
CRH-R1
ANTERIOR PITUITARY
-NOR-/ADRENALINE
HEAD KIDNEY
CORTISOL
Stress perception
SYMPATHETHIC FIBERSCENTRAL NERVOUS SYSTEM
AUTONOMIC NERVOUS SYSTEM
PERIPHERY
β-adrenorec
.
glucocorticoid rec.
INTERRENAL
CELLS
CHROMAFFIN
CELLS
Figure S5.
Modulation of the stress response: effect on cardiac regeneration.
In zebrafish, exposure to different stressors activates two main axes: (1) the hypothalamus-pituitary interrenal (HPI) axis
(green) and (2) the sympathetic-chromaffin cell axis (purple).
The treatment of the stressed animals after cryoinjury with fluoxetine hydrochloride (serotonin re-uptake inhibitor) and
propranolol (non-selective β-adrenoreceptor antagonist) had a significant rescue effect on the stress-induced regenerative
impairment. The administration of diazepam (GABAa receptor enhancer) did not show any beneficial effect on scar
resorp-tion. The intermittent adminsitration of RU486 (glucocorticoid antagonist) did not rescue cardiomyocyte proliferation in the
stressed animals and the prolonged treatment with this drug was toxic and resulted in a high lethality.
G
Control
Crowding
Entire
Myocardium
Post-infarcted
area
% of
TUNEL-positive cells
0
10
20
30
n.s.
n.s.
Control 7 dpci
cmlc2::dsRED2-Nuc
TUNEL DAPI
E
E’
F
F’
Crowding 7 dpci
cmlc2::dsRED2-Nuc
TUNEL
E’
F’
Control 14 dpci
A’
B’
A’
B’
cmlc2::dsRed2-Nuc
Raldh2
C’
D’
D’
C’
cmlc2::dsRed2-Nuc
TNC
Crowding 14 dpci
B
D
A
C
Figure S6.
Epi/endocardium activation, Tenascin C expression and cellular apoptosis are not affected by daily
expo-sure to stress.
(
A-D) Sections of cmlc2::dsRed2-Nuc hearts of control and stressed zebrafish at 14 dpci immunostained against the
retinoic acid synthetizing enzyme (Raldh2, green), which is a marker of the activated epi-endocardium (A, B) or
against Tenascin C (TNC, green), which is an ECM protein involved in tissue remodeling (C, D). (
A’-D’) Higher
magnifications of the framed areas shown in (A-D). Expression of the Raldh2 enzyme and Tenascin C could be
detected at the injured site and in the epicardium both in control (A’, C’) and stressed (B’, D’) fish. This indicates no
major impact of daily stress on epicardial/endocardial activation or on Tenascin C regulation. Scale bar (D, D’) = 100
μm.
(
E, F) Sections of cmlc2::dsRed2-Nuc hearts at 7 dpci after TUNEL assay and DAPI staining. (E’, F’) Apoptotic cells
were detected by signal overlap between TUNEL and DAPI in the cryoinjured parts but also in the rest of the
ventricle. (
G) Quantification of TUNEL and DAPI positive cells allowed to estimate the level of cellular apoptosis in
the ventricle of the control and crowded zebrafish. No significant difference in apoptosis was observed between
control and stressed fish at 7 dpci. Cryoinjured parts are encircled with a dashed line. Data are represented as mean
± SEM. Scale bar (F, F ’) = 100 μm.
Figure S7.
Experimental setup for the RNA-seq1 & 2 experiments and principal components analysis of
both experiments.
(
A) Experimental setup for the RNA sequencing 1 performed at 14 dpci with the RNA extracted from the
cryoinjured parts of the stressed and control hearts. (
B, C) The use of cmlc2::EGFP-PM transgenic
zebrafish, expressing GFP in the plasma membrane of CMs, enabled to identify and isolate the
cryoin-jured parts of the ventricle used for the RNA-sequencing experiment (15 cryoincryoin-jured parts were pulled
together for each group in order to get sufficient amount of RNA). (
D) Experimental setup for the RNA
sequencing 2 performed at 14 dpci with the RNA extracted from the wholes ventricles of the stressed
and control hearts. (
E) Principal component analysis plot performed with RNA-seq1 and RNA-seq2. The
Principal Compenent Analysis (PCA) is a classical method of statistical analysis. By transforming the set
of observations into linearly uncorrelated variables called “principal component”. By definition the PCs
are ordered by the variance they can explain in the data. PC1 explains the largest variance, then PC2,
then PC3 etc. In our experiment, PC1 allows discriminating the two independant RNAseq experiments,
and PC2 discriminates the stress and the control samples in both RNAseq experiments. Scale bar (B)=
100 μm.
C
B
cryoinjured
part
cmlc2::EGFP-PM
rest of
ventricle
Cryo
day 0
day 2
Collection
day 14
cmlc2::EGFP-PM
RNA sequencing
15x
cryoinjured
parts
CROWDING
1 h/day
CONTROL
15x
cryoinjured
parts
A
RNA-seq 1
Cryo
day 0
day 2
Collection
day 14
cmlc2::EGFP-PM
RNA sequencing
2 x 10
whole
ventricles
2 x 10
whole
ventricles
CROWDING
1 h/day
CONTROL
RNA-seq 2
D
counts: Stress
counts: Control
PC1
PC2
−5
0
5
−20
−10
0
10
20
30
RNA-seq2
RNA-seq1
E
Principal component analysis
B
Complete Regeneration
Partial Regeneration
Igf-1r inh. (5μM
ADW )
Control: DMSO
Blocked Regeneration
F
E
C
4/6
1/6
1/6
3/8
3/8
2/8
MUSCLE
FIBRIN
COLLAGEN
A
D
30 dpci
G
100
50
% of hearts
Complete
Partial
Blocked
Regeneration:
ctrl
Igf-1r inh.
Figure S8.
Inhibition of IGF-1 receptor impairs heart regeneration.
(
A-F) Heart sections at 30 dpci after AFOG staining. (A-C) In the control group treated with
0.05% DMSO, 66% of the zebrafish completely regenerated the heart at 30 dpci. (
D-F) In the
group treated with NVP-ADW742 (5 μM), a specific inhibitor of the Igf1r kinase activity, 62.5%
of the fish showed impaired cardiac regeneration at 30 dpci. (
G) Histograms represent the
percentage of zebrafish hearts with complete (white), partial (gray) or blocked (black)
regen-eration at distinct experimental settings (regenerative scores). Scale bar (A) = 100 μm.
Name # of Entities Expanded # of Entities # of Measured Entities Median change p-value Hit type Proteins Involved in Pathogenesis of Melanoma 245 262 180 1.121233899 5.5849E-06 Disease Collections
Built Pathway_IGFBP1b_downstream cell processes 178 763 238 1.086427761 2.7121E-05 Private pathways
Proteins Involved in Pathogenesis of Glioma 304 340 207 1.083054452 2.8003E-05 Disease Collections Defective Clearance of Apoptotic Keratinocytes in Systemic Lupus Erythematosus 79 245 89 1.071944531 2.9092E-05 Disease Collections
BMP7-ACVR2 Expression Targets 27 29 21 1.610822919 0.00026135 Expression Targets Pathways
TGFB1-ACVRL1 Expression Targets 221 233 138 1.175402723 0.00028927 Expression Targets Pathways
EGF/CTNN Expression Targets 143 156 96 1.279815128 0.00032076 Expression Targets Pathways
B Cell Activation 62 841 506 1.181790244 0.00032227 Cell Signaling
TLR4/NF-kB/IRF Expression Targets 70 76 37 1.07553905 0.00034869 Expression Targets Pathways
Pathway_Genes_Imp 954 954 628 1.033202234 0.00037041 Private pathways
B-cell Chronic Lymphocytic Leukemia Overview 122 430 273 1.258365961 0.0003856 Disease Collections
Extracellular Matrix Turnover 36 166 76 1.228851937 0.00039486 Cell Process Pathways
Melanoma Overview 176 627 429 1.131958925 0.00043896 Disease Collections
EphrinR -> actin signaling 15 216 141 -1.020568772 0.00051062 Receptor Signaling Dystrophin Glycoprotein Complex Signaling in Duchenne Muscular Dystrophy 67 792 490 1.151354255 0.00054743 Disease Collections OXIDATIVE(ROS)Dystrophin Glycoprotein Complex Signaling in Duchenne Muscular Dystrophy67 792 490 1.151354255 0.00054743 Private pathways Proteins Involved in Pathogenesis of Glioblastoma 188 210 138 -1.044766759 0.00055643 Disease Collections
Hodgkin Lymphoma Overview 146 614 285 1.254934272 0.00062251 Disease Collections
TLR4 -> IRF signaling 14 14 10 1.837768696 0.0007392 Receptor Signaling
TGFB1-TGFBR1 Expression Targets 89 91 47 1.269441599 0.00076762 Expression Targets Pathways
Proteins Involved in Pathogenesis of Cataract 95 95 53 1.106356331 0.00099064 Disease Collections Role of Hexosamine Pathway in Diabetic Microangiopathy 26 145 71 1.1450458 0.0009942 Disease Collections
T Cell Activation 80 948 471 1.033202234 0.00101336 Cell Signaling
PDGF/STAT Expression Targets 80 89 57 1.164725658 0.00102698 Expression Targets Pathways
Proposed Mechanisms of Antiepileptic Effects of a Ketogenic Diet 56 365 219 1.285492956 0.00108017 Disease Collections
Atlas of Signaling 381 6035 3424 1.083054452 0.00113812 Cell Signaling
Insulin/CEBPA/CTNNB/FOXA/FOXO Expression Targets 145 171 109 -1.019580018 0.00129622 Private pathways
Insulin/CEBPA/CTNNB/FOXA/FOXO Expression Targets 145 171 109 -1.019580018 0.00129622 Expression Targets Pathways
Notch_Insulin/CEBPA/CTNNB/FOXA/FOXO Expression Targets 145 171 109 -1.019580018 0.00129622 Private pathways
Cell Cycle Regulation 135 2176 1436 1.13136165 0.00135125 Cell Signaling
Common Non-genomic Effects of Thyroid Hormones 60 338 195 -1.020568772 0.00140719 Disease Collections BMP2 Activates WNT Signaling in Pulmonary Artery Smooth Muscle Cells 26 253 163 -1.028555619 0.00154104 Disease Collections
TGFB1-TGFBR2 Expression Targets 116 125 77 1.205982884 0.00157163 Expression Targets Pathways
Actomyosin-Based Movement 25 85 31 -1.305557659 0.00160695 Cell Process Pathways
Actin Cytoskeleton Regulation 51 546 369 1.030942621 0.00179848 Cell Signaling
Ca2+ Overload in Duchenne Muscular Dystrophy 59 256 150 1.033202234 0.00184601 Disease Collections Role of HMGB1 and IL1B in Neuroinflammation in Epilepsy 25 29 19 -1.115450282 0.00186536 Disease Collections
TNF/NF-kB Expression Targets 127 135 68 1.164725658 0.00192162 Expression Targets Pathways
INHBA-ACVR2/ACVR1 Expression Targets 25 27 20 1.610822919 0.00193913 Expression Targets Pathways
T-cell Receptor Signaling 71 371 203 -1.00209964 0.00194978 Immunological Pathways
Onset of Atopic Dermatitis 72 343 203 -1.00209964 0.00194978 Disease Collections
IL1B Expression Targets 169 195 109 1.0215013 0.00196439 Expression Targets Pathways
Vascularization in Hepatocellular Carcinoma 25 101 52 1.077367242 0.00203218 Disease Collections
Secondary Glioblastoma 66 343 237 1.258365961 0.00204329 Disease Collections
ROS metabolism 45 108 16 1.888036854 0.00217801 Metabolic Pathways
EGF/MEF/MYOD/NFATC Expression Targets 145 231 138 1.03973094 0.00222991 Expression Targets Pathways Leptin/STAT Expression Targets 96 107 63 1.194807312 0.00239132 Expression Targets Pathways AGT/CREB Expression Targets 116 193 110 1.094417435 0.00244381 Expression Targets Pathways Vitamin A (retinol) metabolism and visual cycle 93 165 19 1.22335471 0.00261586 Metabolic Pathways
Sister Chromatid Cohesion 27 174 113 1.317461315 0.00276692 Cell Process Pathways
Table S1.
Gene set enrichment analysis for the the fused RNA seq experiment (RNA-seq1&2) to highlight changes in gene expression between control and stressed zebrafish hearts. The table shows the 50 most significant pathway gene sets for the fused RNA-seq experiment: RNA-seq1 & RNA-seq2. The analysis was performed with Pathway Studio.
Name # of Entities Expanded # of Entities # of Measured Entities Median changep-value Hit type SRP-dependent cotranslational protein targeting to membrane 108 108 74 1.77234506 3.0145E-10 biological_process viral transcription 82 82 56 1.84158913 4.4373E-10 biological_process translational termination 89 89 62 1.7790759 1.112E-08 biological_process
viral life cycle 93 93 63 1.77234506 4.2407E-08 biological_process
translational elongation 149 149 74 1.76277199 3.1223E-07 biological_process
cell adhesion 658 658 342 1.03973094 1.4525E-06 biological_process
response to virus 145 145 68 1.37681504 1.67E-06 biological_process
cytosolic large ribosomal subunit 68 68 33 1.7790759 1.7438E-06 cellular_component
actin binding 395 395 223 -1.0781643 1.789E-06 molecular_function
Z disc 124 124 71 1.0368129 4.4501E-06 cellular_component
extracellular region 2319 2319 793 1.10562778 1.0497E-05 cellular_component
cytosol 2752 2752 1886 1.1016447 1.3491E-05 cellular_component
homophilic cell adhesion 160 160 47 -1.1749899 1.451E-05 biological_process nuclear-transcribed mRNA catabolic process, nonsense-mediated decay122 122 86 1.64589637 1.7059E-05 biological_process
extracellular matrix 250 250 154 1.1450458 4.0576E-05 cellular_component
cytosolic small ribosomal subunit 59 59 28 1.78686236 5.2213E-05 cellular_component proteinaceous extracellular matrix 318 318 167 1.12703243 8.9256E-05 cellular_component DNA strand elongation involved in DNA replication 31 31 21 1.87578021 0.00011666 biological_process
cytokine binding 22 22 11 1.66175581 0.00011674 molecular_function
structural constituent of muscle 52 52 28 -1.22291476 0.00013793 molecular_function
innate immune response 669 669 341 1.09441743 0.0001406 biological_process structural constituent of ribosome 416 416 112 1.5427905 0.00014143 molecular_function cellular response to exogenous dsRNA 14 14 6 2.831489 0.00014868 biological_process
myosin complex 59 59 35 -1.37424361 0.00019363 cellular_component
heparin binding 166 166 75 1.10667467 0.0001945 molecular_function
collagen binding 61 61 42 1.36796593 0.00020382 molecular_function
inositol phosphate-mediated signaling 12 12 6 -2.02442083 0.00022145 biological_process transmembrane signaling receptor activity 178 178 71 -1.02278562 0.00022579 molecular_function muscle filament sliding 39 39 24 1.15324394 0.00022622 biological_process positive regulation of neutrophil chemotaxis 19 19 11 2.51787823 0.00022765 biological_process translational initiation 149 149 100 1.58878194 0.00024611 biological_process actin filament binding 97 97 70 -1.08544637 0.00025982 molecular_function response to vitamin D 27 27 19 -1.46988038 0.00031118 biological_process protein homodimerization activity 765 765 434 1.03320223 0.00031824 molecular_function RNA metabolic process 250 250 195 1.49149742 0.00042772 biological_process cellular response to mechanical stimulus 86 86 52 -1.04631187 0.00050118 biological_process mRNA metabolic process 227 227 180 1.52096928 0.0005202 biological_process
mitotic cell cycle 394 394 300 1.27847668 0.00060125 biological_process
cardiac muscle cell action potential involved in contraction 10 10 7 -1.96299321 0.00063621 biological_process
positive regulation of potassium ion transport 16 16 9 -1.66351809 0.00075449 biological_process
myoblast migration 5 5 5 2.45266796 0.00081209 biological_process
superoxide anion generation 15 15 8 3.21042632 0.00085169 biological_process
immune response 449 450 119 1.15294089 0.00099846 biological_process
regulation of stress fiber assembly 7 7 6 -1.99257912 0.00100537 biological_process
cellular amino acid metabolic process 50 50 32 1.12440149 0.00108476 biological_process
viral process 320 320 243 1.42239843 0.00110895 biological_process
cell periphery 48 48 28 1.09441743 0.00116032 cellular_component
regulation of small GTPase mediated signal transduction 174 174 108 -1.11122585 0.0012402 biological_process small ribosomal subunit 48 48 18 1.72612426 0.00128253 cellular_component energy reserve metabolic process 103 103 68 -1.11351284 0.00129081 biological_process
Table S2. Gene set enrichment analysis for the fused RNA seq experiment (RNA-seq1&2) to highlight changes in gene expression between control and stressed zebrafish hearts. The table shows the 50 most significant GO-term gene sets for the fused RNA-seq experiment: RNA-seq1 & RNA-seq2. The analysis was performed with Pathway Studio.
geneID log2FC_fused padj_fused type of RNA
IFITM1 3.742286001 1.14E-30
ENSDARG00000084533 3.881034115 1.21E-28 miRNA ENSDARG00000081938 8.047716049 1.79E-24 Mt-tRNA
SLC25A4 -2.760180063 1.18E-21
ENSDARG00000088865 3.443302383 1.18E-21 miRNA
LGALS3BP 3.113514297 1.69E-21
CORO2A -5.652379587 3.78E-21
ENSDARG00000088976 3.582835203 3.15E-20 miRNA ENSDARG00000086686 3.47104141 4.73E-20 miRNA
FHL2 2.929914201 1.73E-19
ENSDARG00000089384 4.183491967 1.96E-19 miRNA
ENSDARG00000070212 3.256322883 1.13E-18
ENSDARG00000090280 3.435020079 4.47E-18 miRNA ENSDARG00000091738 3.373336585 6.97E-18 miRNA
PARP6 -2.569819142 1.76E-17
MYBPH -2.572453077 8.25E-17
ENSDARG00000093902 7.612314957 3.87E-16 pseudogene
PCOLCE 2.707511492 1.34E-15
GRIN3A -4.873753905 1.85E-15
ENSDARG00000087783 3.665121865 1.85E-15 miRNA ENSDARG00000088564 3.429343718 1.85E-15 miRNA
IFI27 2.641037412 3.49E-14
ADCY6 -2.924964698 3.70E-14
CPAMD8 3.645294968 1.08E-13
ENSDARG00000089068 7.09582739 2.01E-13 pseudogene
MIH7B -2.872828154 3.78E-13
ENSDARG00000090619 2.873602128 3.78E-13 miRNA
ENSDARG00000086606 7.03980247 3.78E-13 pseudogene
ENSDARG00000086256 -2.733709962 4.41E-13 protein_coding
CRIP1 2.06748148 4.84E-13
GNB3 -5.560717107 5.66E-13
ENSDARG00000086396 2.928302686 8.23E-13 miRNA
SEC61G 2.213266624 8.24E-13
ENSDARG00000086085 3.124629975 9.25E-13 miRNA
IFI27L1 2.450376839 1.06E-12
ENSDARG00000088436 2.770051212 1.22E-12 protein_coding
ENSDARG00000078859 4.727957055 1.46E-12 protein_coding
MYRFL -2.53518149 1.89E-12
ENSDARG00000087953 3.056798055 1.97E-12 miRNA
ENSDARG00000089382 2.864534502 3.65E-12 protein_coding
PDZRN3 -2.361487556 5.04E-12
SLC16A1 -2.31344781 6.27E-12
BMP10 -2.566374785 7.56E-12
ENSDARG00000096403 2.7441639 7.94E-12 lincRNA
ENSDARG00000070873 2.558192575 1.05E-11 protein_coding
ENSDARG00000090733 2.774640053 1.83E-11 miRNA ENSDARG00000087337 2.801632112 1.98E-11 miRNA
HEPACAM2 6.641683192 1.98E-11
ENSDARG00000017246 -2.401867587 3.29E-11 protein_coding
ENSDARG00000090146 2.984329301 4.74E-11 miRNA
RBP4 2.002717065 6.27E-11
ENSDARG00000090175 2.882947206 6.63E-11 miRNA ENSDARG00000082789 2.100222947 8.53E-11 Mt_tRNA ENSDARG00000086192 3.098469469 1.09E-10 miRNA
KCNMB2 -2.581176089 1.79E-10
ENSDARG00000015815 -1.809270076 2.43E-10 protein_coding
NR4A1 -2.146381259 3.12E-10
EPHB3 -2.249748285 3.19E-10
SULT2B1 2.547289475 3.56E-10
ENSDARG00000058348 2.976849528 3.92E-10 protein_coding
ENSDARG00000088311 2.795463059 4.35E-10 miRNA
ETV4 2.433975283 5.45E-10
ENSDARG00000088838 2.703044112 5.80E-10 miRNA ENSDARG00000085168 6.285124238 6.35E-10 miRNA
ENSDARG00000097100 -2.044045148 6.70E-10 protein_coding
ENSDARG00000087747 6.227650516 1.08E-09 pseudogene
ENSDARG00000088582 6.225175014 1.09E-09 pseudogene
LGR4 -2.076095077 1.14E-09
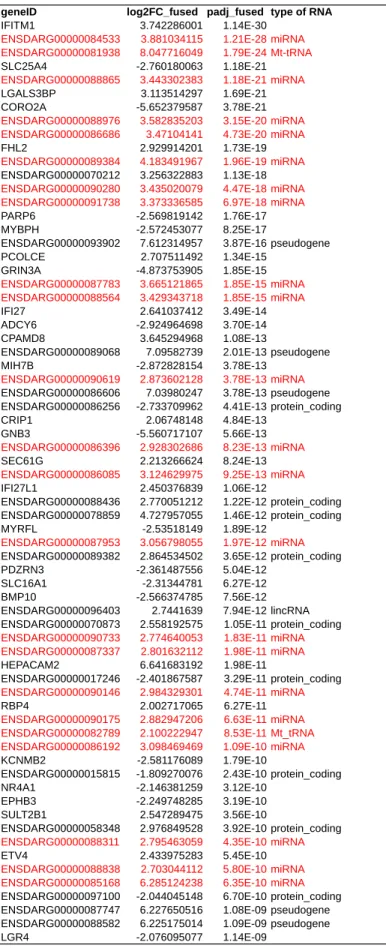
Table S3. Table showing the 50 most significant DE non-coding
RNAs(miRNAs are highlighted in red) for the fused seq experiment: RNA-seq1 & RNA-seq2. The analysis was performed with Pathway Studio.