HAL Id: hal-02354936
https://hal.archives-ouvertes.fr/hal-02354936
Submitted on 8 Nov 2019
HAL is a multi-disciplinary open access
archive for the deposit and dissemination of
sci-entific research documents, whether they are
pub-lished or not. The documents may come from
teaching and research institutions in France or
abroad, or from public or private research centers.
L’archive ouverte pluridisciplinaire HAL, est
destinée au dépôt et à la diffusion de documents
scientifiques de niveau recherche, publiés ou non,
émanant des établissements d’enseignement et de
recherche français ou étrangers, des laboratoires
publics ou privés.
Distributed under a Creative Commons Attribution - NonCommercial| 4.0 International
A stable microtubule array drives fission yeast polarity
reestablishment upon quiescence exit
Damien Laporte, Fabien Courtout, Benoit Pinson, Jim Dompierre, Bénédicte
Salin, Lysiane Brocard, Isabelle Sagot
To cite this version:
Damien Laporte, Fabien Courtout, Benoit Pinson, Jim Dompierre, Bénédicte Salin, et al.. A
sta-ble microtubule array drives fission yeast polarity reestablishment upon quiescence exit. Journal of
Cell Biology, Rockefeller University Press, 2015, 210 (1), pp.99-113. �10.1083/jcb.201502025�.
�hal-02354936�
The Rockefeller University Press $30.00
Introduction
Microtubules (MT) are hollow cylindrical polymers that are
es-sential in all eukaryotic cells. They are formed by the
non-co-valent interaction of
α- and β-tubulin heterodimers. MTs are
nucleated at MT organizing centers (MTOCs) by a
γ-tubulin–
containing complex that acts as a MT template. As a MTOC
stays attached to MT, it stabilizes the so-called MT minus end
(Kollman et al., 2011). At the opposite end, the plus end, MTs
elongate by the addition of GTP tubulin. During assembly, the
β-tubulin–bound GTP is hydrolyzed and a stable GDP+Pi
tubu-lin intermediate is generated. The eventual Pi release causes a
change in tubulin–tubulin interaction that favors MT
depolym-erization (catastrophe) that can be rescued by de novo GTP
tu-bulin addition (Carlier and Pantaloni, 1981; Nogales and Wang,
2006; Alushin et al., 2014; Mitchison, 2014). In fact, MT plus
ends are thought to be protected from catastrophe by a
stabiliz-ing GTP tubulin “cap” (Mitchison and Kirschner, 1984; Horio
and Murata, 2014). Thus, MTs alternate periods of growth
and shrinkage, a behavior called dynamic instability
(Mitchi-son and Kirschner, 1984). In vivo, this dynamic is regulated
by plethora of MT-associated proteins (MAPs) that modulate
MT length by influencing the polymerization or
depolymeriza-tion rates and/or the catastrophe or rescue frequencies (Wade,
2009; van der Vaart et al., 2009; Horio and Murata, 2014).
Fi-nally, other MAPs are involved in MT organization into diverse
structures such as asters, spindles, or bundles, each of which is
required for a particular cellular process. One of the key
ques-tions is therefore how cells can spatially and temporally
con-trol the assembly of distinct MT-containing structures to elicit
specific cellular functions.
Fission yeast has proven to be a powerful model to study
how different MT structures are constructed all along the
cell cycle (Hagan, 1998). Depending on the cell cycle stage,
Schizosaccharomyces pombe
displays three different classes
of MTOCs. In mitosis, the spindle pole body (SPB), a yeast
MTOC equivalent to the centrosome, nucleates MTs that form
the mitotic spindle required for chromosome segregation. After
mitosis completion, an equatorial MTOC appears as a ring in
the cell center and nucleates a post-anaphase array of MTs
in-volved in cell septation during cytokinesis. After cell division,
the equatorial MTOC breaks down to form multiple interphase
MTOCs that localize all around the nuclear membrane. The
SPB stays linked to the cytoplasmic face of the nuclear
enve-lope and can possibly nucleate interphase MT. Thus, in
inter-phase, fission yeast cells display three to five long MT bundles
that extend along the long axis of the cell (Hagan and Petersen,
2000; Sawin and Tran, 2006).
Interphase MT bundles are composed of about four
dy-namic antiparallel MTs (Drummond and Cross, 2000). The
for-mation of these structures relies on the Mto1/2 complex that
recruits and activates the
γ-tubulin–containing complex on the
Cells perpetually face the decision to proliferate or to stay quiescent. Here we show that upon quiescence establishment,
Schizosaccharomyces pombe cells drastically rearrange both their actin and microtubule (MT) cytoskeletons and lose
their polarity. Indeed, while polarity markers are lost from cell extremities, actin patches and cables are reorganized into
actin bodies, which are stable actin filament–containing structures. Astonishingly, MTs are also stabilized and
rear-ranged into a novel antiparallel bundle associated with the spindle pole body, named Q-MT bundle. We have identified
proteins involved in this process and propose a molecular model for Q-MT bundle formation. Finally and importantly,
we reveal that Q-MT bundle elongation is involved in polarity reestablishment upon quiescence exit and thereby the
efficient return to the proliferative state. Our work demonstrates that quiescent
S. pombe cells assemble specific
cytoskel-eton structures that improve the swiftness of the transition back to proliferation.
A stable microtubule array drives fission yeast
polarity reestablishment upon quiescence exit
Damien Laporte,
1,2Fabien Courtout,
1,2Benoît Pinson,
1,2Jim Dompierre,
1,2Bénédicte Salin,
1,2Lysiane Brocard,
3and Isabelle Sagot
1,21Université de Bordeaux, Institut de Biochimie et Génétique Cellulaires, 33000 Bordeaux, France 2Centre National de la Recherche Scientifique, UMR5095 Bordeaux, 33077 Bordeaux, France
3Bordeaux Imaging Center, Pôle d'imagerie du végétal, Institut National de la Recherche Agronomique, 33140 Villenave d'Ornon, France
© 2015 Laporte et al. This article is distributed under the terms of an Attribution– Noncommercial–Share Alike–No Mirror Sites license for the first six months after the pub-lication date (see http://www.rupress.org/terms). After six months it is available under a Creative Commons License (Attribution–Noncommercial–Share Alike 3.0 Unported license, as described at http://creativecommons.org/licenses/by-nc-sa/3.0/).
Correspondence to Isabelle Sagot: [email protected]
Abbreviations used in this paper: CHX, cycloheximide; MAP, MT-associated protein; MBC, benzimidazol-2-yl-carbamate; MPA, mycophenolic acid; MT, microtubule; MTOC, MT organizing center; SPB, spindle pole body; TBZ, thia-bendazole; WT, wild type.
THE
JOURNAL
OF
CELL
BIOLOGY
on July 6, 2015
jcb.rupress.org
Downloaded from
http://jcb.rupress.org/content/suppl/2015/06/26/jcb.201502025.DC1.html Supplemental Material can be found at:on July 6, 2015
jcb.rupress.org
Downloaded from
on July 6, 2015
jcb.rupress.org
Downloaded from
on July 6, 2015
jcb.rupress.org
Downloaded from
on July 6, 2015
jcb.rupress.org
Downloaded from
on July 6, 2015
jcb.rupress.org
Downloaded from
on July 6, 2015
jcb.rupress.org
Downloaded from
on July 6, 2015
jcb.rupress.org
Downloaded from
on July 6, 2015
jcb.rupress.org
Downloaded from
cytoplasmic face of the SPB, at nuclear membrane–associated
interphase MTOCs, and onto preexisting MTs, thus allowing
the nucleation of new MTs (Venkatram et al., 2004, 2005;
Jan-son et al., 2005; Samejima et al., 2005, 2010; Zimmerman and
Chang, 2005; Lynch et al., 2014). In the latter case, the newly
nucleated MT is pulled toward the minus end of the underneath
MT template via the motor activity of the kinesin-14 Klp2, until
Ase1, a homodimeric MT bundling protein, acts as a brake
(Carazo-Salas et al., 2005; Carazo-Salas and Nurse, 2007;
Jan-son et al., 2007; Braun et al., 2009, 2011). The MT length is
reg-ulated by several MT plus end tracking proteins including Mal3
(the EB1 homologue) and Tip1 (the Clip170 homologue), two
proteins that favor MT rescue (Beinhauer et al., 1997;
Brun-ner and Nurse, 2000; Busch and BrunBrun-ner, 2004; Höög et al.,
2013), Alp14 (a TOG orthologue) that has a MT polymerase
activity (Al-Bassam et al., 2012), and the kinesins-8 Klp5 and
Klp6 that promote catastrophe (Unsworth et al., 2008; Tischer
et al., 2009; Erent et al., 2012). This complex interplay between
diverse MAPs results in a typical interphase MT bundle
orga-nization, such as within the bundle the overlapping stable MT
minus ends are found near the nucleus whereas the dynamic
plus ends are extending toward the cell tips (see model in Fig. 8
A; Drummond and Cross, 2000; Piel and Tran, 2009; Hachet et
al., 2012). This dynamic arrangement enables the MT plus ends
to produce a balance of pushing forces that position the nucleus
at the center of the cell (Tran et al., 2001) and will ultimately
lead to a symmetrical cell division (Daga and Chang, 2005).
Interphase MT bundles have an additional physiological
function. Just after division, cells initiate growth at the
preex-isting cell end, the old end. Dynamic interphase MTs play an
active role in this process. Indeed, by touching the cell cortex,
growing MT plus ends deliver polarity factors to cell extremity.
One of these factors, the Kelch repeat–containing protein Tea1,
docks onto its membrane-associated receptor, the prenylated
protein Mod5 (Snaith and Sawin, 2003). Once at the cell tip,
Tea1 recruits the Formin For3 and its associated partners, such
as Bud6, enabling the nucleation of actin filaments that will be
subsequently assembled into actin cables. Actin cables will then
serve as tracks for the myosin V–dependent polarized transport
of all the building blocks required for cell growth. Hence, in
interphase, MTs establish the site of polarized growth and
mu-tations that impinge on interphase MT bundle organization or
dynamics consequently affect cell shape (Chang and Martin,
2009; Martin, 2009; Hachet et al., 2012).
Like other eukaryotes, upon nutrient exhaustion, S. pombe
cells stop growth and proliferation and enter a temporary
non-di-viding state called quiescence (Sajiki et al., 2009). While
qui-escence may encompass very different physiological situations
depending on the nature of the exhausted nutrient (Costello et
al., 1986), it is clear that fission yeast quiescence establishment
is accompanied by profound modifications of the cell
transcrip-tome, proteome (Marguerat et al., 2012), and metabolome
(Sa-jiki et al., 2013) and by the acquisition of a variety of features
including an enhanced resistance to harmful external conditions
or the accumulation of storage molecules (Wei et al., 1993; Su
et al., 1996). We have previously shown that upon carbon source
exhaustion, the fission yeast proteasome exits the nucleus and
forms a specific cytoplasmic structure called proteasome
stor-age granule (Laporte et al., 2008). Such relocalization has also
been reported in budding yeast (Laporte et al., 2008). In
addi-tion, in Saccharomyces cerevisiae, actin filaments collapse into
actin bodies (Sagot et al., 2006), and various chaperones (Tapia
and Morano, 2010; Liu et al., 2012), enzymes (Narayanaswamy
et al., 2009; Noree et al., 2010), or kinases (Shah et al., 2014)
are relocalized upon quiescence entry. Some of these
reorgani-zations have been observed in metazoans (Noree et al., 2010),
suggesting that they may be conserved among eukaryotes.
In this study, we show that fission yeast cytoskeletons
are completely reorganized upon quiescence entry. Indeed, we
primarily observed that the MT cytoskeleton is drastically
re-shaped as quiescent cells assemble a large SPB-associated MT
bundle composed of astonishingly stable antiparallel MTs.
Im-portantly, we also report that quiescence establishment comes
along with a massive rearrangement of the actin cytoskeleton
and the loss of cell polarity. We finally demonstrate that
qui-escent cell MT elongation is strictly required for cell polarity
reestablishment upon quiescence exit.
Results
Upon quiescence entry, S. pombe
reorganizes its MT cytoskeleton as a single bundle linked to the SPB
Upon carbon source exhaustion, fission yeast cells leave the
cell cycle and enter quiescence from interphase (Bostock, 1970;
Costello et al., 1986). In these conditions, we have analyzed MT
organization in wild-type (WT) cells expressing the
α-tubulin 2
(Atb2) fused to GFP. As expected, proliferating interphase cells
displayed two to five long cytoplasmic bundles composed of
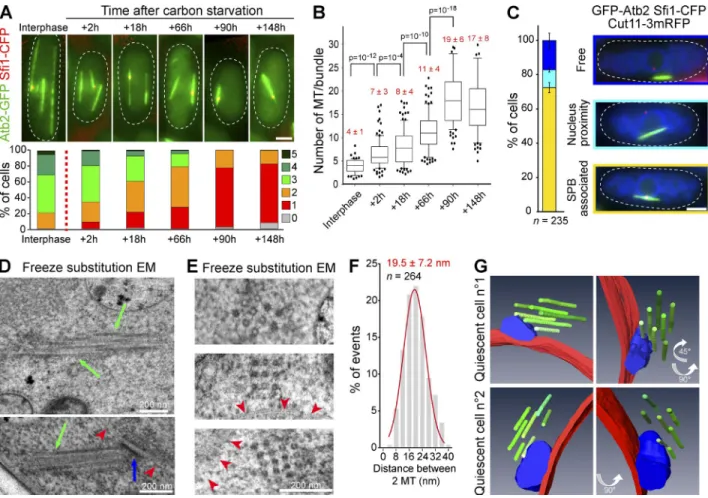
4 ± 1 MTs (Fig. 1, A and B; Höög et al., 2007). Strikingly,
we observed that after carbon exhaustion, the number of MT
bundles progressively decreased (Fig. 1 A). Four days after
car-bon exhaustion, the majority of the cells displayed a single MT
bundle (Fig. 1 A and Fig. S1 A) that we named Q-MT bundle,
standing for quiescent cell MT bundle. This unique MT
bun-dle was composed of more than 15 MTs (Fig. 1 B) that were
not necessarily of the same length, as exemplified by the arrow
shape of the bundle extremities (Fig. S1 B). In fact, in
∼15%
of the cells, the Q-MT bundle could display internal thickness
variations (Fig. S1 C). Importantly, by imaging cells
coexpress-ing GFP-Atb2 with the SPB-associated protein Sfi1 fused to
CFP and the nuclear membrane protein Cut11 fused to RFP, we
observed that the Q-MT bundle was generally associated with
the SPB (>70% of the cells; Fig. 1, C, D, and G), even when
quiescence was prolonged (Fig. S1 D). Yet, MT bundles not
as-sociated with the SPB displayed the same length and intensity
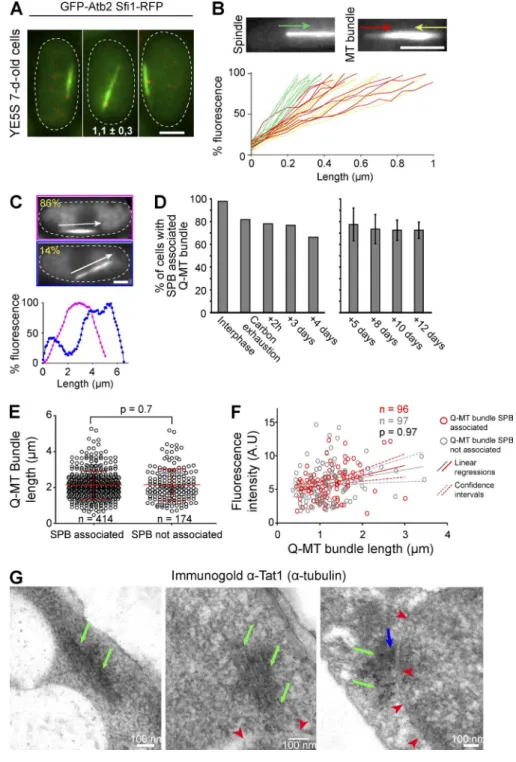
than the SBP-associated ones (Fig. S1, E and F). EM analysis of
quiescent WT cells showed that within the Q-MT bundle MTs
were regularly spaced (Fig. 1, D–G; and Fig. S1 G). Finally,
the Q-MT bundle organization and localization within the cell
were confirmed by 3D models constructed using serial section
electron tomograms (Fig. 1 G).
The Q-MT bundle is composed of stable MTs
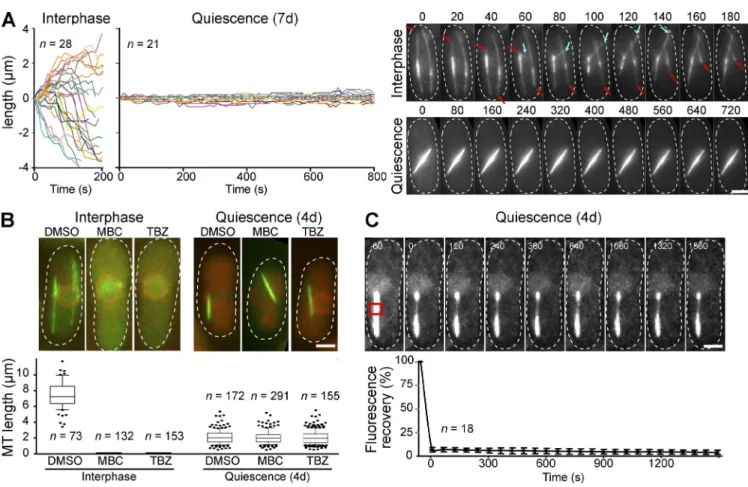
In interphase cells, cytoplasmic MTs are known to be extremely
dynamic as they rapidly alternate periods of growth and
shrink-age (Fig. 2 A; Drummond and Cross, 2000). They are
there-fore very sensitive to drugs that inhibit MT polymerization
and cause dynamic MT disassembly, such as methyl
benzim-idazol-2-yl-carbamate (MBC) or thiabendazole (TBZ; Fig. 2 B;
Sawin and Nurse, 1998; Sawin and Snaith, 2004). In contrast, we
showed that in quiescent cells, the Q-MT bundle had a constant
on July 6, 2015
jcb.rupress.org
Downloaded from
length (Fig. 2 A) and resisted against massive amounts of drugs
(Fig. 2 B) or a cold treatment known to cause the disassembly of
dynamic MTs (Fig. S2, A and B). Importantly, no fluorescence
was recovered after GFP-Atb2 photobleaching, demonstrating
that within the Q-MT bundle, not only MTs were stable but also
there was no MT sliding (Fig. 2 C). Of note, like cells entering
quiescence upon carbon source exhaustion, upon nitrogen
star-vation, cells also stabilized a unique MT bundle (Fig. S2 C).
MT stabilization is not primarily caused by GTP depletion but rather involves the SPB
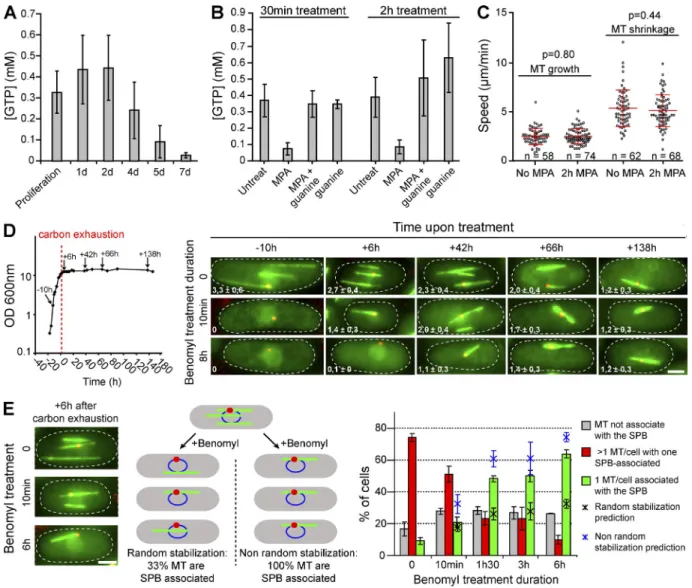
Tubulin binds GTP and can hydrolyze this nucleotide. The
in-fluence of the tubulin nucleotide status on MT dynamics in vivo
is still a mater of debate (Kueh and Mitchison, 2009). We have
analyzed the GTP concentration variation upon entry into
qui-escence after carbon exhaustion using high pressure ionic
chro-matography and observed a drastic decrease of the intracellular
pool of this nucleotide (Fig. 3 A). Mycophenolic acid (MPA)
is a drug that specifically inhibits inosine-5
′-monophosphate
dehydrogenase, the enzyme that catalyzes the conversion of
inosine-5
′-monophosphate into guanosine-5′-monophosphate
(Allison and Eugui, 2000), the GTP precursor. As in other
or-ganisms (Qiu et al., 2000), MPA treatment of proliferating S.
pombe
cells caused GTP depletion (Fig. 3 B). The GTP drop
was reversed by addition of guanine in the medium,
demon-strating the specificity of MPA treatment (Escobar-Henriques
et al., 2001). Interestingly, MPA treatment did not significantly
affect MT growth or shrinkage rates (Fig. 3 C) nor the MT
ca-tastrophe and rescue frequencies (not depicted), excluding the
possibility that MT stabilization would be an immediate
conse-quence of GTP depletion upon quiescence entry.
Kinetic analysis of MT stabilization upon entry into
quies-cence after carbon exhaustion revealed that as early as 6 h after
glucose depletion the MT bundle linked to the SPB was more
stable, i.e., resistant to the MT-destabilizing drug benomyl, than
other MT bundles present in the cell (Fig. 3 D). The stabilization
of the SPB-associated MT bundle fit with a non-random
stabi-lization prediction for both early (Fig. 3 E) and late quiescence
time points (Fig. S2 D). Collectively, these results indicated that
the SPB, rather than the GTP intracellular concentration, played
a major role in MT stabilization in quiescence.
A variety of MAPs colocalizes with the Q-MT bundle and influences its length or thickness
To get insights into the mechanism of Q-MT bundle formation,
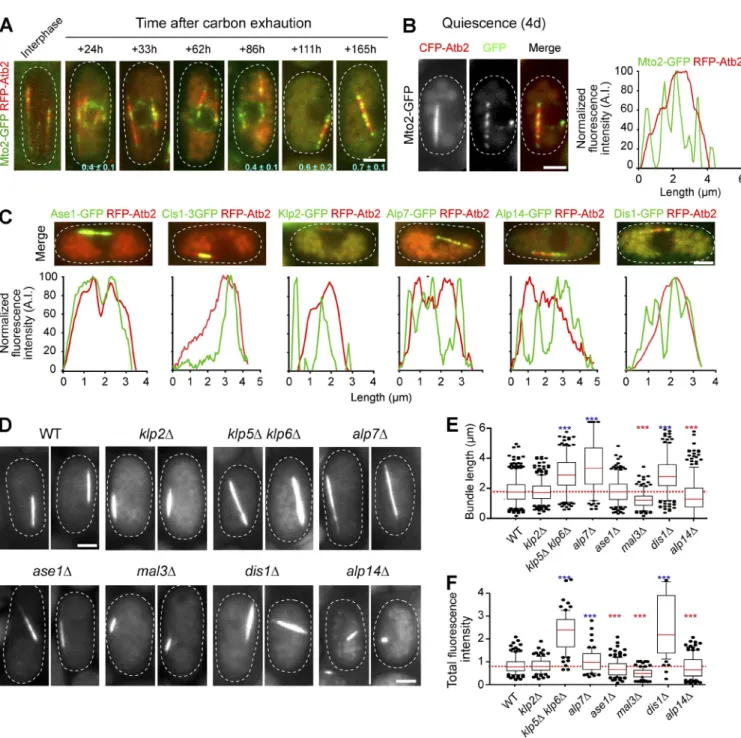
we looked for MAPs colocalizing with this structure. First, we
found that astonishingly, in quiescent cells, Mto1 and Mto2
Figure 1. In quiescence, S. pombe assemble a unique MT bundle associated with the SPB. (A) Cells expressing GFP-Atb2 (green) and Sfi1-CFP (red) are shown (top). The variation of the number of MT bundles per cell is presented as a function of time (bottom; glucose exhaustion is marked by a red dashed line; n > 200 cells per time point). (B) The number of MTs per bundle increases upon quiescence entry (p-values are indicated; n > 100 cells per time point). (C) The Q-MT bundle is associated with the SPB (N = 2 experiments and n > 100 cells). Examples of quiescent cells (5 d) expressing GFP-Atb2 (green), Sfi1-CFP (red), and Cut11-RFP (blue). Bars, 2 µm. (D and E) The Q-MT bundle visualized longitudinally (D) and transversally (E) by freeze substitution EM in WT cells (7 d). Green arrows point at MTs, red arrowheads point at the nuclear membrane, and a blue arrow indicates the SPB. (F) Distance distribution between two MTs measured using images in E. (G) Using serial section electron tomograms, 3D models of Q-MT bundles were designed. MTs are in green, the nuclear membrane is in red, and the SPB is in blue. Two cells are shown using different view angles.
on July 6, 2015
jcb.rupress.org
were no longer found as dots around the nuclear envelope but
rather localized exclusively onto the Q-MT bundle (Fig. 4 A
and Fig. S3 A). Line scan analyses revealed that Mto1/2
lo-calized as dots that most likely mark the MT ends (Fig. 4 B
and Fig. S3 A), in agreement with Mto1/2 being a MT minus
end binding complex (Sawin et al., 2004; Venkatram et al.,
2004, 2005; Samejima et al., 2005; Janson et al., 2007).
Sec-ond, the regular spacing between MTs within the Q-MT bundle
observed by EM (Fig. 1 E) strongly suggested the presence of
a MT bundling protein, and, accordingly, we found that Ase1
localized all along the Q-MT bundle (Fig. 4 C). In S. pombe, the
CLASP family member Cls1 (Peg1) has been involved in MT
stabilization and is known to localize to the overlapping zone of
interphase MT bundle (Bratman and Chang, 2007). Similarly,
in quiescent cells, we found that Cls1 localized with the denser
region of the Q-MT bundle (Fig. 4 C). Finally, the MT plus
end tracking proteins Alp7 (the TACC protein orthologue) and
Alp14 and Dis1 (two TOG-related proteins) localized as dots
that probably correspond to MT extremities within the Q-MT
bundle (Fig. 4 C), just like the MT minus end–directed
kine-sin-14 Klp2, although fewer and fainter Klp2 dots were
de-tected (Fig. 4 C). Of note, Mal3, the EB1 homologue, could not
be detected in quiescent cells (unpublished data).
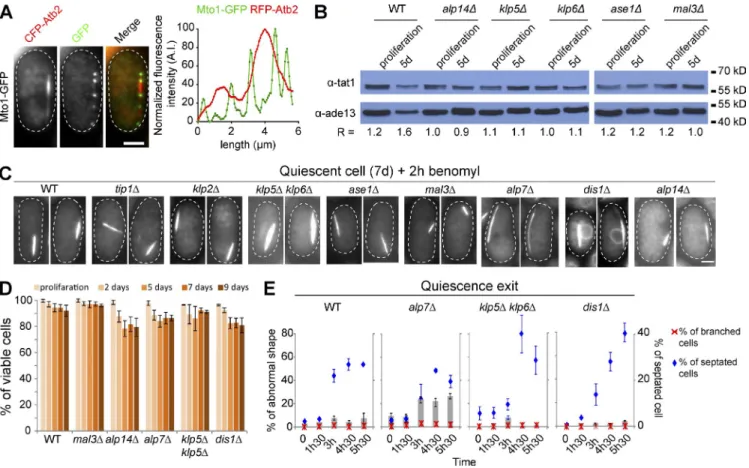
We then analyzed the effect of MAP encoding gene deletion
on the Q-MT bundle shape, stability, and formation. None of the
deletions tested resulted in the absence of MT bundle (Fig. 4 D)
or its destabilization (Fig. S3 C). However, in some mutants,
whereas the steady-state level of total
α-tubulin remained
con-stant (Fig. S3 B), the Q-MT bundle was either both thicker and
longer (klp5
Δklp6Δ, alp7Δ, and dis1Δ), just thinner (ase1Δ), or
both shorter and thinner (mal3
Δ and alp14Δ; Fig. 4, E and F).
These results indicated that MAPs involved in interphase MT
length regulation are also involved in shaping the Q-MT bundle
in quiescence. Besides, mutants with an altered Q-MT shape
did not display mortality in quiescence (Fig. S3 D) nor a cell
shape defect upon quiescence exit (Fig. S3 E), with the
excep-tion of alp14
Δ cells (see the following paragraph and Fig. 7 C).
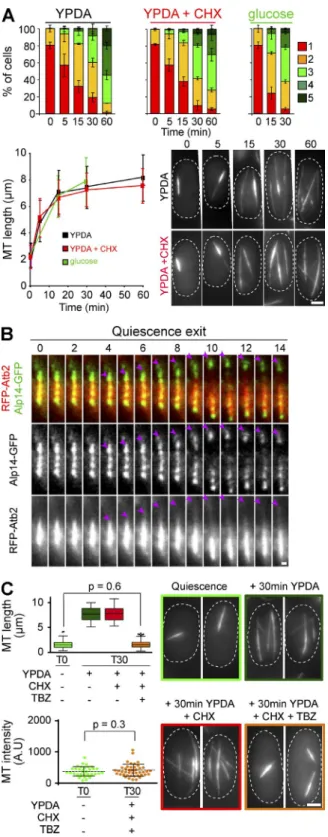
The Q-MT bundle rapidly elongates upon quiescence exit
In our experimental conditions, glucose exhaustion is
responsi-ble for cell entry into quiescence (Fig. S4 A). When quiescent
cells were refed with rich medium, the Q-MT bundle rapidly
elongated from both extremities, a proof of the MT
antipar-allel arrangement within the Q-MT bundle (Fig. 5 A and Fig.
S4, B and C). In
∼5 min, dynamic MTs polymerizing from the
Q-MT bundle touched the cell poles. Of note, tracking SPB
movement upon quiescence exit clearly demonstrated that the
Q-MT bundle was attached to the SPB (Fig. S4 E). The MT plus
end–tracking protein Alp14, although immobile onto the Q-MT
bundle in quiescence (Fig. S4 F), was found at the tip of
elon-gating MTs upon quiescence exit (Figs. 5 B and S4 F). In
con-Figure 2. The Q-MT bundle is composed of stable MTs. (A) Q-MT bundles do not display detectable length variation. Variation of MT bundle length as a function of time in interphase and quiescent cells. Representative time-lapse movies are shown. Red and blue arrows point, respectively, at shrinking and growing MTs. (B) Q-MT bundles are insensitive to treatments that destabilize dynamic MTs. The graph displays MT bundle length measured in interphase and in quiescent cells (4 d) incubated 30 min with the indicated drugs. Representative cells are shown. (C) FRAP of GFP-Atb2 within a Q-MT bundle mea-sured in quiescent cells (4 d). Error bars are SEM. Time is in seconds. The red box indicates the photobleached area. In all panels, cells are WT cells ex-pressing GFP-Atb2, Sfi1-CFP, and Cut11-RFP. In A and C, only the GFP channel is shown, and in B GFP-Atb2 is in green and Cut11-RFP is in red. Bars, 2 µm.
on July 6, 2015
jcb.rupress.org
Downloaded from
trast, the minus end–associated protein Mto2 stayed immobile
on the elongating Q-MT bundle (Fig. S4 G). Later (>15 min),
new MT bundles were assembled de novo at the nuclear
periph-ery. Interestingly, as for other quiescent cell-specific structures
(Laporte et al., 2011, 2013), the sole addition of glucose onto
quiescent cells trigged both Q-MT bundle elongation and
as-sembly of new interphase MT bundles at the nuclear periphery
(Fig. 5 A). Importantly, these two MT rearrangements occurred
even if de novo protein synthesis was inhibited by
cyclohexim-ide (CHX; Fig. 5 A). Yet, as expected, cells treated with CHX
did not elongate upon refeeding (Fig. S4 D). This experiment
demonstrated that the MT cytoskeleton remodeling upon
quies-cence exit did not need de novo tubulin synthesis.
We then wonder whether, upon quiescence exit, Q-MT
bundle elongation was caused by the polymerization of free
cy-toplasmic tubulin or if it required the depolymerization of the
MTs embedded into the Q-MT bundle. Cell treatment with both
CHX and TBZ revealed that within the first 30 min after cell
re-feeding neither the fluorescence nor the length of the quiescent
cell Q-MT bundle was affected (Fig. 5 C), indicating that within
this time frame the Q-MT bundle did not depolymerized. This
was confirmed by the absence of variation of the Q-MT bundle
fluorescence intensity for at least 20 min after cell refeeding in
the presence of CHX alone (Fig. S4 H). Obviously, a TBZ
treat-ment prevented de novo interphase MT bundle formation at the
nuclear membrane. As a control, we showed that inhibiting MT
Figure 3. Q-MT bundle formation does not depend on GTP depletion but rather involves the SPB. (A) GTP concentration decreases upon quiescence entry. (B) In proliferating cells, a MPA treatment (100 µg/ml) causes a massive GTP concentration drop. Proliferating cells were incubated 30 min or 2 h with either MPA, MPA + guanine (0.3 mM) to reverse the MPA effect, or guanine alone as a control. In A and B, N = 4 experiments with two samples per ex-periment. (C) MPA-induced GTP droop does not affect MT dynamics in proliferating cells. MT growth and shrinkage speed were determined in proliferating WT cells expressing GFP-Atb2 treated (2 h) or not with MPA. (D and E) MT stabilization involves the SPB. (D) At various times after carbon exhaustion (left, red dashed line), cell expressing GFP-Atb2 (green) and Sfi1-CFP (red) were treated for 10 min or 8 h with benomyl and then imaged. Numbers indicate the mean number of MT bundle per cell (N = 2 experiments and n > 200 cells for each time point). (E) WT cells were grown 6 h after carbon starvation and incubated with benomyl for the indicated times (left). A cartoon (middle) representing either a MT bundle random stabilization model or model biased toward the stabilization of the SPB-associated MT bundle. Red, SPB; blue, nuclear membrane; green, MT bundle. Cells displaying multiple MT bundles (red bars) or only a single MT bundle associated with the SPB (green bars) or not (gray bars) were scored for cells incubated with benomyl for the indicated times. N = 3 experiments and n > 200 cells per time point. Error bars are SD. The percentage of cells displaying a unique MT bundle associated with the SPB calculated theoretically using a random stabilization prediction (black asterisks) or SPB-biased stabilization (blue askterisks) are indicated (see Materi-als and methods for details). For all graphs, means and SD are indicated. Bars, 2 µm.
on July 6, 2015
jcb.rupress.org
polymerization upon quiescence exit did not influence Q-MT
bundle stability. Indeed when quiescent cells were refed with
new medium in the presence of CHX, and afterward incubated
10 min with MBC (Fig. S4 I), Q-MT bundle length and
fluores-cence intensity stayed constant for at least 20 min, whereas MT
dynamic was clearly recovered. In fact, Q-MT bundles start to
disassemble only 1 h after cells refeeding (Fig. S4 I).
Collec-tively these data demonstrated that a free tubulin pool was
pres-ent in quiescpres-ent cell cytoplasm and that MT elongation upon
quiescence exit was caused by free tubulin polymerization at
the Q-MT bundle extremities.
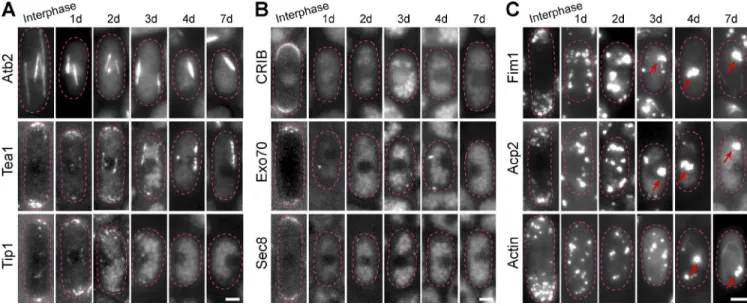
S. pombe cells lose their polarity and assemble actin bodies in quiescence
In actively dividing S.pombe, MTs deposit polarity factors, such
as Tea1, to the cell tip to allow polarized growth (Chang and
Martin, 2009; Martin, 2009; Piel and Tran, 2009; Hachet et al.,
2012). In quiescent S. pombe cells, Tea1 was no longer detected
Figure 4. Various MAPs are associated with the Q-MT bundle and influence its shape. (A and B) Mto2 relocalizes from the nuclear membrane onto the Q-MT bundle. (A) Cells expressing Mto2-GFP (green) and RFP-Atb2 (red) are shown. Colocalization coefficient between Mto2-GFP and RFP-Atb2 are indicated (see Materials and methods for details). (B) Line-scan analyses (right) indicate that Mto2 localizes at MT extremities within the Q-MT bundle. (C) Numerous MAPs colocalize with the Q-MT bundle. Cells expressing RFP-Atb2 and the indicated MAP fused to GFP were grown 5 d and imaged. Graphs are line scan analyses of the red and green fluorescence. In B and C, data are representative of the fluorescence intensity variations measured out of four experimental repeats. (D–F) The Q-MT bundle shape is influenced by the deletion of specific MAPs. (D) Q-MT bundle was imaged in 7-d-old cells expressing GFP-Atb2 and deleted for the indicated MAP. (E and F) Q-MT bundle length (n > 200; E) and Q-MT bundle intensity (n > 100; F) were measured in the indicated mutants. ***, P < 10−4. Blue and red asterisks shows positive and negative difference, respectively. Bars, 2 µm.
on July 6, 2015
jcb.rupress.org
Downloaded from
at the cell tips but was rather localized onto the Q-MT bundle
(Fig. 6 A). Tip1, a MT plus end tracking protein of the CLIP170
family, was also lost from cell extremities but couldn’t be
de-tected in quiescent cells (Fig. 6 A). We made a similar
observa-tion for active Cdc42 (CRIB domain), the exocyst components
Exo70 and Sec8 (Fig. 6 B), the myosin V myo52, the polarity
factor Pob1 (Fig. S5 A), and the formin For3 (not depicted).
In-terestingly, in quiescent S. pombe, no actin cable or patch were
found. Instead, we observed a big cytoplasmic
F-actin–contain-ing structure (Fig. 6 C). This structure displayed all the
char-acteristics described for actin bodies in quiescent S. cerevisiae
(Sagot et al., 2006): they do not have a particular size or shape
(Fig. 6 C), they are resistant to Latrunculin A (not depicted),
and they contain a specific set of actin binding proteins such as
fimbrin (Fim1; Fig. 6 C), capping protein (Acp2; Fig. 6 C), and
drebrin (Aap1; Fig. S5 A), but not Bud6, Vrp1, Crn1, Arp5, or
End4 (Fig. S5 A). These observations indicated that upon
glu-cose exhaustion–induced quiescence entry, S. pombe cells lose
their polarity and entirely reorganize their actin cytoskeleton.
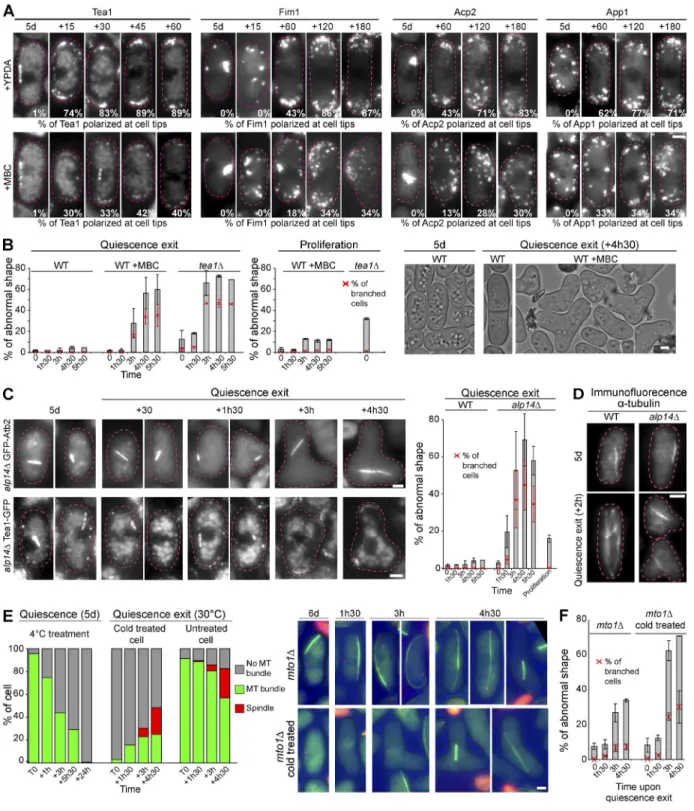
Q-MT bundle elongation is required for polarity reestablishment upon quiescence exit
Upon quiescence exit, we found that cells rapidly repolarized.
Indeed, within minutes, Tea1 returned to the cell tips (Fig. 7 A)
as did Tip1 and Pob1 (Fig. S5 B). In parallel, actin bodies quickly
disassembled and actin patches reassembled at the cells
extrem-ities (Fig. 7 A, Fim1, Acp2, and App1; and Fig. S5 B, Bud6).
Of note, Tea1 repolarization could occur even if de novo protein
synthesis was inhibited (Fig. S5 C) but, as expected, it was
im-paired in a mod5
Δ mutant (Snaith and Sawin, 2003; Fig. S5 D).
To decipher the potential role of the Q-MT bundle in cell
repolarization upon quiescence exit, cells exiting quiescence
were treated with MBC, a drug that prevents MT bundle
elonga-tion and de novo interphase MT bundle formaelonga-tion at the nuclear
periphery (Figs. 5 C and S5 C). In these conditions, we found
that repolarization of Tea1 and the actin components Fim1,
Acp2, and App1 was impaired in >60% of the cells and
dras-tically delayed in the remaining 40% (Fig. 7 A). At later time
points, these polarity defects translated into major cell shape
defects (Fig. 7 B) that were not observed in the control
exper-iments done with proliferating cells. This strongly suggested
that Q-MT bundle elongation and the return to dynamic MT
was required for polarity reestablishment upon quiescence exit.
Interestingly, we found that quiescent alp14
Δ cells were
incapable of Q-MT elongation and interphase bundle
reassem-bly upon refeeding (Fig. 7, C and D). This later defect was
not the result of an impaired relocalization of Mto1/2 onto
the nuclear membrane (Fig. S5 E). This demonstrated that
Alp14 was required for Q-MT bundle elongation. Further, as
MBC treated cells, alp14
Δ cells displayed a strong cell shape
defect upon quiescence exit (Fig. 7 C), another proof of the
involvement of the Q-MT bundle elongation in cell
repolar-ization upon quiescence exit.
To definitively address this point, we used mto1
Δ, a
mu-tant known to be unable to nucleate cytoplamic MTs (Sawin et
al., 2004). Interestingly, after 5 d, mto1
Δ cells do not assemble
a bona fide Q-MT bundle but instead display a unique long and
thin MT-containing structure composed of MTs that are
sen-sitive to a cold treatment (Fig. 7, E and F). As mto1
Δ cells are
unable to nucleate cytoplasmic MTs, a shift back to 30°C after
a cold treatment did not allow de novo MT polymerization (Fig.
Figure 5. The Q-MT bundle rapidly elongates upon quiescence exit. (A) MT cytoskeleton organization before and upon quiescence exit. Quiescent cells (7 d) were refed with YPDA ± CHX or with water containing 2% glucose. The number of MT bundles per cell (top) and the length of the MT bundles (bottom) were then measured (N = 2 experiments and n > 200). Representa-tive cells expressing GFP-Atb2 are shown. Means and SDs are indicated. (B) Time-lapse movies of cell coexpressing RFP-Atb2 and Alp14-GFP upon quies-cence exit. Alp14 dots (pink arrowhead) follow MT growing tips. Quiescent cells (5 d) were refed with YPDA. The time after cell refeeding is indicated in minutes. (C) The Q-MT bundle stays stable upon quiescence exit. Quiescent cells (7 d) were incubated 30 min in YPDA ± CHX ± TBZ. MT bundle length (top) and fluorescence intensity (bottom) were measured; p-values are indi-cated. Representative cells are shown. Bars: (A and C) 2 µm; (B) 0.5 µm.
on July 6, 2015
jcb.rupress.org
7 E and not depicted). Using this mutant, we were able to get rid
of MTs in quiescence and address the phenotype of cells exiting
quiescence in the absence of MTs. As shown in Fig. 7 (E and F),
the vast majority of the cold-treated mto1
Δ cells exiting
quies-cence without MT exhibit strong polarity and shape defects (see
also Fig. S5 F). Collectively, these results demonstrated that the
Q-MT bundle elongation and the recovery of dynamic MTs are
involved in polarity reestablishment upon quiescence exit.
Discussion
In this study we have shown that when fission yeast cells enter
quiescence after carbon source exhaustion, they remodel their
MT cytoskeleton into a unique MT bundle (Q-MT bundle). This
Q-MT bundle is composed of more than 15 stable and regularly
spaced antiparallel MTs. Importantly, this structure is
associ-ated with the SPB, a MTOC that seems to be involved in Q-MT
bundle MT stabilization (Figs. 1, 2, and 3). We have also
ob-served that the actin cytoskeleton is drastically reshaped as cells
disassemble actin patches and cables and assemble actin bodies
(Fig. 6), stable F-actin–containing structures (Sagot et al., 2006).
In parallel, polarity markers, such as Cdc42, the exocyst
com-ponents, and Tea1, are lost from cell tips (Fig. 6). All these
rear-rangements result in a loss of cell polarity in quiescence. When
cells exit quiescence, the Q-MT bundle immediately elongates
from both extremities and actin bodies dissociate (Figs. 5 and
7). Within an hour, a typical interphase organization is restored,
i.e., three to four thin and dynamic MT bundles extend along the
long axis of the cell, actin patches and cables assemble at cell
tips, and cells start to grow in a polarized manner.
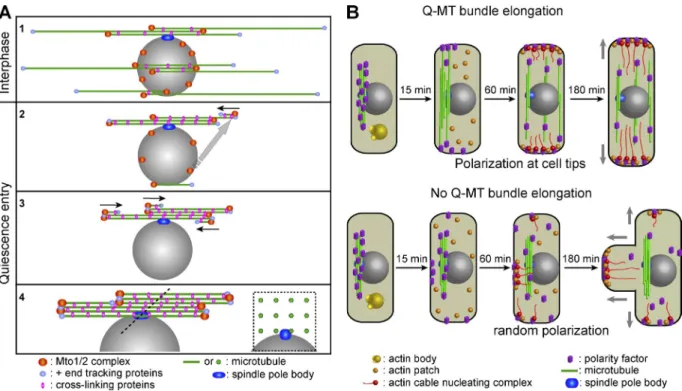
What are the molecular mechanisms involved in Q-MT bundle formation?
Upon quiescence establishment, the SBP-associated MT
dle rapidly becomes more stable compared with other MT
bun-dles present in the cell cytoplasm (Fig. 3 D, t + 6 h). Within
<2 d after carbon exhaustion, the SPB-associated MT bundle is
fully resistant to treatments that destabilize dynamic MTs. This
stabilization will be discussed below. As a second step toward
Q-MT bundle formation, we propose that the binding of Mto1/2
onto the SPB-associated MTs allows the nucleation of new MTs
(Fig. 8 A, step 2). The displacement of the equilibrium toward
de novo MT nucleation by Mto1/2-activated
γ-tubulin onto the
stable SPB-associated MT bundle may be favored by the
con-comitant loss of Mto1/2 affinity for the nuclear envelope (Fig. 4
A). As a result, new MTs would pile up onto the SPB-associated
MT bundle that progressively thicken, helped by MT bundling
activities, including the one of Ase1 (Loïodice et al., 2005;
Ya-mashita et al., 2005) and Clasp (Bratman and Chang, 2007; Fig.
8 A, steps 3 and 4). Interestingly, MAPs that regulate the
thick-ness and the length of interphase MT bundles also influence
the Q-MT bundle shape (Fig. 4). Indeed, both in interphase and
in quiescence, MT bundles are shorter in a mal3
Δ mutant
(Be-inhauer et al., 1997; Fig. 4, D to F) or longer in a klp5
Δklp6Δ
mutant (West et al., 2001; Fig. 4, D to F), in agreement with the
molecular activities of these proteins that, respectively, promote
MT rescue or catastrophe (Unsworth et al., 2008; Tischer et al.,
2009; Erent et al., 2012). Alp14 has a MT polymerase activity
in vitro (Al-Bassam et al., 2012) and, accordingly, alp14
Δ cells
display both shorter interphase MT bundles (Al-Bassam et al.,
2012) and shorter Q-MT bundles (Fig. 4, D–F). Furthermore,
just like interphase MT bundles in proliferating alp7
Δ cells
(Zheng et al., 2006), the Q-MT bundle is longer in quiescent
alp7Δ cells (Fig. 4, D–F). Finally, consistent with Ase1
bun-dling activity (Loïodice et al., 2005), we found that the Q-MT
bundle is thinner in quiescent ase1
Δ cells (Fig. 4, D–F). The
Q-MT bundle formation may therefore hypothetically rely on
a self-assembling mechanisms similar to the one proposed for
interphase MT bundles (Carazo-Salas and Nurse, 2006; Daga
et al., 2006; Carazo-Salas and Nurse, 2007; Janson et al., 2007;
Subramanian and Kapoor, 2012).
How to explain MT stability in quiescence?
During proliferation, nearly 100% of the cells display
SPB-as-sociated MTs. In quiescence,
∼75% of the Q-MT bundles are
associated with the SPB (Figs. 1 C and S1 D). We have never
directly observed a Q-MT bundle “detaching” from the SBP.
Figure 6. Quiescent S. pombe cells have lost their polarity and reorganized their actin cytoskeleton into actin bodies. Cells expressing either Atb2-GFP or the polarity markers Tea1-GFP or Tip1-GFP (A), GFP-CRIB or the exocyst component Exo70-GFP or Sec8-GFP (B), or Fim1-GFP or Acp2-GFP (C) are shown upon entry into quiescence. F-actin filaments were detected by Alexa-Phalloidin staining (C, bottom). Red arrows point at actin bodies. Bars, 2 µm.
on July 6, 2015
jcb.rupress.org
Downloaded from
Figure 7. Q-MT bundle elongation allows cell polarity reestablishment upon quiescence exit. (A) Quiescence exit of cells expressing the indicated polarity markers was triggered in the absence or presence of MBC. Numbers indicate the percentage of cells with polarized markers at the cell tips (N = 2 experi-ments and n > 200). Time is in minutes. (B–F) Cell shape is drastically impaired when the Q-MT bundle elongation is inhibited. (B) Cell shape was analyzed before and after refeeding of 5-d-old WT cells in the absence or presence of MBC. Control experiments were done in proliferating cells. Representative cells are shown. (C) Upon quiescence exit, the alp14Δ mutant is unable to elongate the Q-MT bundle and display massive cell shape defects associated
with Tea1-GFP mislocalization. Alp14Δ cells expressing either GFP-Atb2 or Tea1-GFP are shown before and after cell refeeding. Cell shape was analyzed
before and after refeeding or as a control in proliferation. (D) Control experiment in which tubulin is revealed by immunofluorescence using Tat1 antibodies in both WT and alp14Δ mutant cells in quiescence (5 d) and 2 h after quiescence exit. (E) After 5 d in YPD, mto1Δ-expressing GFP-Atb2 cells display a
long and dynamic MT structure that is destabilized by a cold treatment (4°C for 24 h). When mto1Δ cold-treated cells are shifted back to 30°C and then
refed, they do not assemble cytoplasmic MT until cells undergo mitosis. Graphs illustrate the number of MT bundles per cell. Data shown are from a single representative experiment out of four repeats (with n > 200 for each time point). The corresponding images are shown. (F) Cell shape of cold-treated mto1Δ
cells was monitored upon quiescence exit. For all graphs, means and SDs are indicated. Bars, 2 µm.
on July 6, 2015
jcb.rupress.org
Therefore, whether free Q-MT bundles result from SPB
detach-ment events or if their stabilization occurred independently of
the SPB remain an open question. Yet, whether they are SPB
as-sociated or not, Q-MT bundles have an apparent constant length
and contain MTs that are insensitive to treatments that
destabi-lize dynamic MTs (Figs. 2, S1 [E and F], and S2 [A and B]).
The molecular events leading to MT stabilization within
the Q-MT bundle are still unknown. We can speculate that an
enhanced MT cross-linking activity specifically associated with
the Q-MT bundle may prevent its depolymerization. Upon
quiescence entry, the SPB-associated bundle may recruit
pro-teins that will either modify the bundling activity of known MT
cross-linkers, such as Ase1, or load quiescence-specific MT
bundling proteins that remain to be identified.
However, an increased MT bundling activity does not
ex-plain why MTs apparently do not elongate. We cannot rule out
that residual polymerization/depolymerization cycles occur at
the MT plus ends. In this scenario, MT elongation would be
undetectable using classic fluorescence microscopy because the
equilibrium between growth and shrinkage would be displaced
toward depolymerization, for example, through the activation of
a MT depolymerase. An alternative possibility could be that upon
quiescence entry, a MT plus end “capper” would be recruited
specifically onto the SPB-associated Q-MT bundle. Although
no MT-capping activity has been identified to date, we can
en-vision that a MT plus end tracker, such as a TOG
domain–con-taining protein, for example, could lock MT plus ends, thereby
preventing tubulin addition. Finally, the absence of detectable
MT elongation in quiescent cells could result from the lack of
free polymerizable tubulin. However, we have clearly shown
that a free tubulin pool is present in the quiescent cell cytoplasm.
Indeed, upon cell refeeding, the Q-MT bundle elongates, even
if the de novo protein synthesis is inhibited (Fig. 5, A and C).
This elongation occurs without any detectable Q-MT bundle
de-polymerization (Figs. 5 C and S4, H and I). Could the quiescent
cell–free tubulin pool be unable to polymerize? We have shown
that quiescence entry is associated with a drastic decrease of the
GTP intracellular pool. Yet, an artificial GTP concentration drop
does not influence MT dynamic (Fig. 3, A–C), at least within
early time points. Further, in vitro experiments have
demon-strated that GDP tubulin can polymerize given that few GTP
tubulin dimers are present (Valiron et al., 2010). As GTP seems
not to be involved, we can speculate that in quiescent cells, free
tubulin cannot add on MT ends either because of a
posttrans-lational modification or a tubulin dimer sequestering protein.
Q-MT bundle elongation upon quiescence exit
Whatever the mechanism responsible for the absence of MT
dynamics in quiescence, Q-MT bundle elongation is rapidly
triggered by glucose upon quiescence exit. This swift event,
which does not depend on de novo protein synthesis,
proba-bly relies on signaling cascades involving nutrient catabolism
(Laporte et al., 2011). Interestingly, we have shown that Q-MT
bundle elongation requires Alp14 (Fig. 7, C and D), a protein
displaying MT polymerase activity (Al-Bassam et al., 2012).
In interphase, Alp14 is not strictly required for MT elongation,
probably because its absence is compensated by a protein with
a similar activity. In quiescence, this compensating activity may
be inhibited or absent. Consequently, Alp14 would be needed
for feeding the elongating Q-MT bundle plus ends upon
quies-cence exit. This is in agreement with the observation that Alp14
stays poised onto the Q-MT bundle plus ends in quiescence and
follows MT elongation upon quiescence exit (Fig. 5 B).
Importantly, we have demonstrated that Q-MT bundle
elongation and the recovery of MT dynamics is necessary for an
Figure 8. Schematization of Q-MT bundle assembly and reestablishment of cell polarity upon quiescence exit. MTs are in green, the nucleus is in gray, and the SPB is in dark blue. (A) The MT minus ends and the Mto1/2 complexes are indicated using orange spheres, the MT plus ends and the associated plus tip tracking proteins are indicated by small light blue spheres, and the bundling proteins are indicated by pink ovals. (B) Polarity factors are in violet, actin bodies are in yellow, actin patches are in orange, and actin cable nucleating complexes containing formins are in red. See Discussion for details.
on July 6, 2015
jcb.rupress.org
Downloaded from
efficient quiescence exit (Figs. 7 and 8 B). Indeed, cells in which
the Q-MT bundle elongation is inhibited either
pharmacologi-cally or by the deletion of Alp14 exhibit profound cell shape
defects. In these cells, polarity markers relocalize to unspecific
cortical regions, leading to a random actin repolarization and
ultimately to a branched or triangular cell shape (Fig. 8 B).
This abnormal cell repolarization upon quiescence exit is a
functional proof of the cell polarity loss in quiescence. Further,
it explains the long standing observation that mutants impaired
for MT dynamic or polarity factors, such as tea1
Δ mutant,
ex-hibit more T-shaped cells after a starvation period than during
proliferation (Browning et al., 2000; Snaith and Sawin, 2003;
Sawin and Snaith, 2004; Fig. 7).
Why would cells need to reorganize their cytoskeletons upon quiescence establishment?
We have previously shown that when budding yeast cells enter
quiescence after glucose exhaustion, they assemble a stable MT
bundle emanating from the SPB (Laporte et al., 2013). Yet, in
contrast to the fission yeast cytoplasmic Q-MT bundle, the S.
cerevisiae
stable MT array is nuclear and composed of parallel
MTs (Laporte et al., 2013; Laporte and Sagot, 2014). We do not
know what the rationales for these structural differences are,
and a wide range of speculations based on various physiological
differences between these two species can be drawn. It is
in-triguing that in both yeasts SPB-associated MTs are stabilized.
Could the SPB be a platform that integrates nutritional signals
and translates them into MT cytoskeleton reorganizations?
All quiescent cells need to preserve their ability to
pro-liferate and must produce a healthy progeny (Coller, 2011;
O’Farrell, 2011). For microorganisms competing for an
envi-ronmental niche, quiescence exit must be efficient to guarantee
the prevalence of the species. Upon quiescence entry, we have
shown that S. pombe and S. cerevisiae cells reorganize both
their MT and their actin cytoskeletons to form stable structures
(Sagot et al., 2006; Laporte et al., 2013; this study). Whether
these reorganizations are just a passive consequence or actively
participate in the process of quiescence establishment is a
crit-ical question (Daignan-Fornier and Sagot, 2011a,b). Actin and
tubulin are very abundant proteins required for cell growth and
division. The degradation or the damaging of these proteins in
quiescence would require their resynthesis to allow
prolifera-tion resumpprolifera-tion. This step would need a large amount of amino
acids and energy and would require some time that may
nega-tively impinge on the swift reentry into the proliferation cycle.
Protein damage might to be a major cause of cell death during
a long-term nonproliferative state. Might actin and tubulin be
better protected from external damages when packed up into
stable polymers rather than as free monomers in the cytoplasm?
To definitively address the requirement for actin bodies and
sta-ble MT-containing bundles for yeast cell survival in quiescence,
conditional mutants or experimental procedures to transiently
disassemble these structures in quiescence need to be found.
Nevertheless, here, we have uncovered a physiological
function for a quiescent cell–specific structure, as we have
shown that fission yeast Q-MT bundle elongation is mandatory
for an efficient quiescence exit. As such, this structure clearly
participates in the fitness of S. pombe, a single-celled
eukary-ote in competition with numerous other species. Moreover, our
study sheds light on the conservation of the reorganization and
stabilization of both the actin and the MT cytoskeletons upon
quiescence establishment in two phylogenetically distant
unicel-lular eukaryote species. One obvious direction for future studies
is to address this conservation in multicellular organisms.
Materials and methods
Strains and growth conditions
Table S1 lists the S. pombe strains used in this study. Strains were pro-vided by F. Chang (Columbia University College of Physicians and Sur-geons, New York, NY), J.P. Javerzat (Centre National de la Recherche Scientifique, Bordeaux, France), P. Nurse (The Francis Crick Institute, London, UK), A. Paoletti (Institut Curie, Paris, France), P. Perez (Uni-versidad de Salamanca, Salamanca, Spain), K. Sawin (University of Edinburgh, Edinburgh, UK), V. Sirotkin (State University of New York Upstate Medical University, Syracuse, NY), T. Toda (London Research Institute, London, UK), P. Tran (Institut Curie, Paris, France), and J.Q Wu (The Ohio State University, Columbus, OH). All tagged genes are under the control of their endogenous promoters. For all experiments, yeast cells were grown in liquid YPDA medium at 30°C as described previously (Laporte et al., 2008) except for Fig. S1 A and Fig. 3 B for which strains were grown in YE5S+A or in synthetic dextrose medium (2% [wt/vol] glucose, 0.17% [wt/vol]) nitrogen base, and 0.5% [wt/vol] ammonium sulfate] with 0.2% (wt/vol) casamino acids (Difco Labora-tories) supplemented with tryptophan and uracil (SD casa WU), respec-tively. For nitrogen starvation (Fig. S2 C), proliferating cells in EMM2 were washed five times with water, and then transferred in EMM2-N medium at the same cell concentration. For cold treatment, cells were shifted at 4°C for the indicated time, and then shifted back to 30°C and imaged. For drug treatments, cells were incubated with 0.5 mg/ml MBC (Sigma-Aldrich), 0.2 mg/ml benomyl (Sigma-Aldrich), 1 mg/ml TBZ (Sigma-Aldrich), or 180 µM CHX (Sigma-Aldrich) for the indi-cated time. These concentrations are 10 times higher than the one com-monly used with proliferating cells. For quiescence exit in the presence of drugs, cells were preincubated 1 h in the presence of the drug before quiescence exit. For quiescence exit in the sole presence of glucose,
cells were washed twice with water, inoculated at OD600nm = 2 in a
solu-tion containing 2% glucose, and incubated at 30°C. Cell viability was addressed after cell incubation for 5 min in a solution containing 0.2% of methylene blue (Sigma-Aldrich) and 2% sodium citrate (Sigma-Al-drich), pH 7. In this study, all experiments were at least duplicated and for each time point, unless specified, >200 cells were scored.
Metabolomics
High pressure ionic chromatography experiments were done as de-scribed previously (Hürlimann et al., 2011). In brief, cellular extracts were prepared by an ethanol extraction. Cells were harvested by rapid filtration, immediately dropped into 5 ml ethanol/10 mM Hepes, pH 7.2 (4/1 vol/vol), and incubated at 80°C for 3 min. Samples were evaporated using a rotavapor apparatus. Residues were resuspended in water and insoluble particles were eliminated by centrifugation. Separation of metabolites was performed on a CarboPac PA1 column, linked to a chromatography workstation (ICS3000; Dionex), using a sodium hydroxide/sodium acetate (50–800 mM) gradient. Nucleotide derivatives were detected with a UV diode array detector (Ultimate 3000RS; Dionex). MPA (Sigma-Aldrich) was used at the final concen-tration of 100 µg/ml. Guanine was used at the final concenconcen-tration of 0.3 mM in 0.1 M sodium hydroxide.
Cell staining
For immunofluorescence experiments, cells were harvested by rapid
filtration and fixed by washing the filter with methanol at −20°C. Cells
on July 6, 2015
jcb.rupress.org
were further processed for immunofluorescence as described previ-ously (Mata and Nurse, 1997). Anti-tubulin staining used the TAT1 monoclonal tissue culture supernatant (gift of K. Gull, Sir William Dunn School of Pathology, Oxford, UK; Woods et al., 1989) at 1:15 followed by Alexa Fluor 488–goat anti–mouse secondary antibody (Molecular Probes) at 1:500.
For actin phalloidin staining, cells were fixed 1 h with freshly made paraformaldehyde (3.8% final [Sigma-Aldrich] in PEM [0.1 M
Pipes, 1 mM EGTA, and 1 mM MgSO4, pH 6.9, with 5 N sodium
hy-droxide]), vortexed every 10 min for 1 h at 70°C, and then centrifuged 5 min at 3,000 rpm. Cells were then washed twice with PEM and resus-pended in 1.5 ml PEM + 1% Triton X-100. Proliferating and quiescent cells were incubated for 30 s and 3 min, respectively. Samples were then washed twice in 1.5 ml PEM and resuspended for 24 h at 4°C in PEM containing 1/10 V of Alexa Fluor Phalloidin (Invitrogen). Finally, cells were washed twice, resuspended in a mounting solution contain-ing 70% glycerol and 5 mg/l paraphenylenediamine, and imaged at room temperature as described previously (Sagot et al., 2006).
For MT behavior after cold experiment (Fig. S2 A), samples were fixed 1 min with formaldehyde (3.8% final; Sigma-Aldrich), washed, resuspended in a mounting solution as above, and imaged.
Fluorescence microscopy
Cells were observed in a fully automated inverted microscope (Ax-iovert 200M; Carl Zeiss) equipped with a stage (MS-2000; Applied Scientific Instrumentation), a 300-W xenon light source (Lambda LS; Sutter Instrument), a 100× 1.4 NA Plan-Apochromat objective, and a five-position filter turret. For GFP imaging, we used a FITC filter (excitation, HQ487/25; emission, HQ535/40; beam splitter, Q505lp). For RFP imaging, we used a Cy3 filter (excitation, HQ535/50; emis-sion, HQ610/75; beam splitter, Q565lp). For CFP imaging, we used a CFP filter (excitation, HQ436/20; emission, HQ480/40; beam split-ter, 455dclp). For YFP imaging, we used a YFP filter (excitation, HQ500/20; emission, HQ535/30; beam splitter, Q515lp). All the filters were purchased from Chroma Technology Corp. Images were acquired using a CoolSnap HQ camera (Roper Scientific). The microscope, camera, and shutters (Uniblitz) were controlled by SlideBook software 5.0 (Intelligent Imaging Innovations). Images are, unless specified, 2D maximal projection of Z-stacks performed using a 0.3-µm step. For live cell imaging, 2 µl of the cell culture were spotted onto a glass slide and immediately imaged at room temperature.
For fluorescence intensity measurement (Figs. 1 B, 4 F, S1 F, and S4 I), a line scan (i1) of n pixel width (three to eight, depending on the binning acquisitions parameters) containing both GFP signal and back-ground was drawn along MTs using ImageJ software. A line of 2n pixel width at the same location was drawn to calculate the intensity of the surrounding background (i2). The real intensity (ir) was calculated as
follow: ib = (i2 × Area i2) − (i1 × Area i1) and ir = i1 − [ib/(Area i2 −
Area i)]. To calculate the number of MTs per structure, individual MT fluorescence was determined by three methods: the fluorescence inten-sity was measured in proliferation cell on either one MT growing or on the nonoverlapping or overlapping region of the spindle, described to contain 11 MTs (Ding et al., 1993). According to these measurements for a single MT, fluorescence intensity measured upon quiescence entry was converted in MT numbers.
To measure MT length (Figs. 4 E and S1 E), positions of the MT-containing structure extremities were followed over time and com-pared with a fixed point in the cell using MTrackJ plugin (ImageJ). Eu-clidian distances (D) between two positions over time were calculated
as D = √[(x2 − x1)2 + (y2 − y1)2]. In time-lapse series (Fig. 2 A), the
first measured length was set to zero. The same protocol was applied to measure MT dynamics (Fig. 3 C) and SPB movement in quiescence
and upon exit (Fig. S4 E). To measure MT dynamics, four z-frames were acquired every 4 s on proliferating cells treated or not with MPA (2 h). After using a rolling average filter (i.e, the MT extremity
fix-point length [w] is the mean of w − 1, w, and w + 1 values), the length
was plotted over time and growth/shrinkage speed was calculated over a 300-s observation period.
FRAP experiment (Fig. 3 C) was done as previously described (Laporte et al., 2013). Experiments were done on an inverted micro-scope (DMI 6000; Leica) equipped with a spinning disk confocal head (CSU-X1; Yokogawa Electric Corporation), a QuantEM camera (Photometrics), and a scanner FRAP system (Roper Scientific). The diode lasers used were at 408 and 491 nm. The objective used was an HCX PL APO CS 100× oil with 1.4 NA. The Z-stacks were done with an objective scanner (Piezo P721.LLQ; Physik Instrumente). This system was controlled by MetaMorph software (Molecular De-vices). Recovery from photobleaching was monitored in time-lapse mode. Fluorescence recovery was corrected for background noise and continuous photobleaching using the ImageJ software. Fluores-cence was then normalized using a rolling average filter (i.e, the
flu-orescence intensity y is the mean intensity of y − 1, y, and y + 1).
The fluorescence was then normalized to the one measured before bleach (Vavylonis et al., 2008).
For line scan analysis (Fig. 4, B and C; and Fig. S3 A), the real measured intensities (ir) were set to percent, with 100% being the max-imum calculated along the line. Slopes were manually aligned to zero, with zero being when ir > 0. The same protocol was applied to compare the different slopes after line scan analysis (Fig. S1, B and C).
Mander’s colocalization coefficients (Fig. 4 A) were calculated using ImageJ software as described in Jimenez et al. (2014). In brief, Z-stacks were first maximum projected and cells were individually se-lected in both GFP and RFP channels. The same threshold was applied for each channel and signals were binarized (i.e., pixel < threshold = 0 and pixel > threshold = 255). The percentages of GFP pixel (Mto2-GFP signal) that colocalize with RFP pixel (RFP-Atb2 signal) were deter-mined using the JACoP plugin (Bolte and Cordelières, 2006).
For Q-MT bundle fluorescence measurements upon quiescence exit (Fig. S4 H), a line scan of 8-pixel width was drawn along Q-MT bundle using ImageJ software. The fluorescence intensities were mea-sured in function of time and were corrected for photobleaching. Pho-tobleaching was measured on Q-MT bundles in quiescence images with the same acquisitions conditions.
To calculate the theoretical stabilization of MT upon quiescence entry, we started with the mean number (N) of MT bundles observed for cells before treatment (i.e., for 6 h after carbon exhaustion [Fig. 3 E] the mean number of MT bundle per cell N was 2.7 and for 42 h [Fig. S2
D] N was 3.3). We noted ni-single, the initial percentage of cells with only
a single MT bundle. We noted nmulti-before and nmulti-after, the percentage of
cells with more than one MT bundle observed before and after benomyl
treatment, respectively. For each time point, Δn-multi is equal to nmulti-before
− nmulti-after. For the random stabilization model, we considered that 1/N
of the MT bundle is stabilized, regardless of the association with the SPB. Thus, for each time point, the prediction of the percentage of cells that should display a single MT bundle associated for the SPB is (1/N × Δn-multi) + ni-single. For the nonrandom stabilization, we considered that
only the MT bundle associated with the SPB is stabilized. Thus, for each time point, the prediction of the percentage of cells that should
display a single MT bundle associated for the SPB is (Δn-multi) + ni-single.
EM
Freezing, freeze substitution (Fig. 1, D and E), and immunostaining (Fig. S1 G) were performed as described previously (Laporte et al., 2013). In brief, cells were washed with glycine, and then with fetal
on July 6, 2015
jcb.rupress.org
Downloaded from
calf serum, and incubated with polyclonal rabbit anti-Tat1 (the
Try-panosoma bruceiα-tubulin) antibodies diluted 1:250 (a gift of K. Gull; Woods et al., 1989). After a wash with Tris-buffered saline containing 0.1% bovine serum albumin, cells were incubated for 45 min at room temperature with anti–mouse IgG conjugated to 10-nm gold particles (BioCell Laboratories, Inc.). For freeze substitution, yeast were depos-ited on a copper grid (400 mesh) coated with Formvar. Grids were
im-mersed in liquid propane held at −180°C by liquid nitrogen and then
transferred in a 4% osmium tetroxide solution in dry acetone at −82°C
for 72 h. Grids were then shifted to room temperature and washed three times with dry acetone. Cell were stained with 1% uranyl acetate and then washed once with dry acetone. Samples were gradually unfiltered with araldite (Fluka). Ultra-thin sections were contrasted with lead ci-trate and observed in an electron microscope (80 kV; 7650; Hitachi) at the EM facility of the Bordeaux Imaging Center.
For tomography analysis (Fig. 1 G), 150-nm-thick sections were placed on formvar-coated 150-mesh copper grids and poststained 1 min with lead citrate 2% in water. Images were acquired using a Spirit Twin (FEI Tecnai) operated at 120 kV. Images were recorded with a 4k Eagle charge coupled device camera system (FEI Tecnai) at a nominal mag-nification of 30,000 (sample D7) or 26,000 (sample C10) using a –65 to
65 tilt for Cell 1 or a −65 to 39 for Cell 2 with 2° increments.
Tomog-raphy tilt series were taken using the batch tomogTomog-raphy software (FEI Tecnai). They were then aligned, cropped, and binned using the ETomo program from the IMOD suite. The 3D tomography reconstructed vi-sualization was done using Amira Resolve RT 5.2.0.
For MT distance measurements between two MTs (Fig. 1 F), the centroid of each MT was determined and the Euclidian distance was
determined as D = {√[(x2 − x1)2 + (y2 − y1)2]}. This distance was then
subtracted for the two MTs’ radiuses (∼22 nm). Gaussian fit on these
val-ues was then determined using GraphPad Prism (GraphPad Software). Miscellaneous
Glucose concentration was measured using the d-Glucose/d-Fructose UV test kit (Roche). Ade13 polyclonal antibodies were raised in rabbit using the purified full-length S. cerevisiae protein (Takara Bio Inc.). Online supplemental material
Fig. S1 describes the shape of the Q-MT bundle and its detection by EM using immunogold labeling with anti-tubulin antibodies. Fig. S2 analyzes the Q-MT bundle resistance to a cold treatment and its sta-bilization with time in quiescence after carbon or nitrogen exhaustion. Fig. S3 provides the localization of Mto1-GFP onto the Q-MT bundle. It shows Western blot quantifying the tubulin steady-state amounts, the Q-MT bundle resistance to benomyl, and the viability of MAP mutants in quiescence. Fig. S4 shows MT elongation at Q-MT bundle extrem-ities and Q-MT bundle stability upon quiescence exit. It also shows Q-MT bundle anchoring at the SPB and Alp14-GFP localization during the quiescence exit process. Fig. S5 displays polarity marker localiza-tion upon quiescence entry and exit in WT and mutant backgrounds or in the presence of drugs. Table S1 lists the S. pombe strains used in this study. Online supplemental material is available at http://www.jcb.org/ cgi/content/full/jcb.201502025/DC1.
Acknowledgments
We express our profound gratitude to J.P. Javerzat for precious com-ments and great discussions about our work and his help in writing this manuscript. We are grateful to M. Gupta, A. Paoletti, D. Pellman, and P. Tran for helpful discussions. We are thankful to F. Chang, J.P. Javerzat, P. Nurse, A. Paoletti, P. Perez, K. Sawin, V. Sirotkin, T. Toda, P. Tran, and J.-Q. Wu for providing yeast strains. We thank A. Lebaudy and M.
Re-villa Guarinos for their help in preliminary experiments. FRAP was done at the Bordeaux Imaging Center facility with the help of Christel Poujol. This work was supported by the Université Bordeaux and a Young In-vestigator grant from the Agence Nationale pour la Recherche (JC08 310804 to I. Sagot).
The authors declare no competing financial interests. Submitted: 6 February 2015
Accepted: 1 June 2015
References
Al-Bassam, J., H. Kim, I. Flor-Parra, N. Lal, H. Velji, and F. Chang. 2012. Fission yeast Alp14 is a dose-dependent plus end–tracking microtubule polymerase. Mol. Biol. Cell. 23:2878–2890. http://dx.doi.org/10.1091/ mbc.E12-03-0205
Allison, A.C., and E.M. Eugui. 2000. Mycophenolate mofetil and its mechanisms of action. Immunopharmacology. 47:85–118. http://dx.doi.org/10.1016/ S0162-3109(00)00188-0
Alushin, G.M., G.C. Lander, E.H. Kellogg, R. Zhang, D. Baker, and E. Nogales. 2014. High-resolution microtubule structures reveal the structural tran-sitions in αβ-tubulin upon GTP hydrolysis. Cell. 157:1117–1129. http:// dx.doi.org/10.1016/j.cell.2014.03.053
Beinhauer, J.D., I.M. Hagan, J.H. Hegemann, and U. Fleig. 1997. Mal3, the fis-sion yeast homologue of the human APC-interacting protein EB-1 is re-quired for microtubule integrity and the maintenance of cell form. J. Cell
Biol. 139:717–728. http://dx.doi.org/10.1083/jcb.139.3.717
Bolte, S., and F.P. Cordelières. 2006. A guided tour into subcellular colocaliza-tion analysis in light microscopy. J. Microsc. 224:213–232. http://dx.doi. org/10.1111/j.1365-2818.2006.01706.x
Bostock, C.J. 1970. DNA synthesis in the fission yeast
Schizosaccharomyces pombe. Exp. Cell Res. 60:16–26. http://dx.doi. org/10.1016/0014-4827(70)90484-2
Bratman, S.V., and F. Chang. 2007. Stabilization of overlapping microtubules by fission yeast CLASP. Dev. Cell. 13:812–827. http://dx.doi.org/10.1016/j. devcel.2007.10.015
Braun, M., D.R. Drummond, R.A. Cross, and A.D. McAinsh. 2009. The kine-sin-14 Klp2 organizes microtubules into parallel bundles by an ATP-dependent sorting mechanism. Nat. Cell Biol. 11:724–730. http://dx.doi. org/10.1038/ncb1878
Braun, M., Z. Lansky, G. Fink, F. Ruhnow, S. Diez, and M.E. Janson. 2011. Adaptive braking by Ase1 prevents overlapping microtubules from sliding completely apart. Nat. Cell Biol. 13:1259–1264. http://dx.doi. org/10.1038/ncb2323
Browning, H., J. Hayles, J. Mata, L. Aveline, P. Nurse, and J.R. McIntosh. 2000. Tea2p is a kinesin-like protein required to generate polarized growth in fission yeast. J. Cell Biol. 151:15–28. http://dx.doi.org/10.1083/ jcb.151.1.15
Brunner, D., and P. Nurse. 2000. CLIP170-like tip1p spatially organizes mi-crotubular dynamics in fission yeast. Cell. 102:695–704. http://dx.doi. org/10.1016/S0092-8674(00)00091-X
Busch, K.E., and D. Brunner. 2004. The microtubule plus end-tracking pro-teins mal3p and tip1p cooperate for cell-end targeting of interphase microtubules. Curr. Biol. 14:548–559. http://dx.doi.org/10.1016/j. cub.2004.03.029
Carazo-Salas, R.E., and P. Nurse. 2006. Self-organization of interphase micro-tubule arrays in fission yeast. Nat. Cell Biol. 8:1102–1107. http://dx.doi. org/10.1038/ncb1479
Carazo-Salas, R., and P. Nurse. 2007. Sorting out interphase microtubules. Mol.
Syst. Biol. 3:95. http://dx.doi.org/10.1038/msb4100136
Carazo-Salas, R.E., C. Antony, and P. Nurse. 2005. The kinesin Klp2 medi-ates polarization of interphase microtubules in fission yeast. Science. 309:297–300. http://dx.doi.org/10.1126/science.1113465
Carlier, M.F., and D. Pantaloni. 1981. Kinetic analysis of guanosine 5 ′-triphos-phate hydrolysis associated with tubulin polymerization. Biochemistry. 20:1918–1924. http://dx.doi.org/10.1021/bi00510a030
Chang, F., and S.G. Martin. 2009. Shaping fission yeast with microtubules.
Cold Spring Harb. Perspect. Biol. 1:a001347. http://dx.doi.org/10.1101/ cshperspect.a001347
Coller, H.A. 2011. Cell biology. The essence of quiescence. Science. 334:1074– 1075. http://dx.doi.org/10.1126/science.1216242