HAL Id: hal-02358399
https://hal.archives-ouvertes.fr/hal-02358399
Submitted on 16 Nov 2019HAL is a multi-disciplinary open access archive for the deposit and dissemination of sci-entific research documents, whether they are pub-lished or not. The documents may come from teaching and research institutions in France or abroad, or from public or private research centers.
L’archive ouverte pluridisciplinaire HAL, est destinée au dépôt et à la diffusion de documents scientifiques de niveau recherche, publiés ou non, émanant des établissements d’enseignement et de recherche français ou étrangers, des laboratoires publics ou privés.
Dip coating with colloids and evaporation
Guillaume Berteloot, Adrian Daerr, François Lequeux, Laurent Limat
To cite this version:
Guillaume Berteloot, Adrian Daerr, François Lequeux, Laurent Limat. Dip coating with colloids and evaporation. Chemical Engineering and Processing: Process Intensification, Elsevier, 2013, 68, pp.69-73. �10.1016/j.cep.2012.09.001�. �hal-02358399�
1 2 3 4 5 6 7 8 9 10 11 12 13 14 15 16 17 18 19 20 21 22 23 24 25 26 27 28 29 30 31 32 33 34 35 36 37 38 39 40 41 42 43 44 45 46 47 48 49 50 51 52 53 54 55 56 57 58 59 60 61 62
Dip coating with colloids and evaporation.
Guillaume Berteloot1, Adrian Daerr1, François Lequeux2 and Laurent Limat1
1
Laboratory MSC, Matière et Systèmes Complexes, UMR 7057 of CNRS and University Paris Diderot, 10 rue Alice Domon et Léonie Duquet, F-75013 Paris, France.
2
Laboratory SIMM, Science et Ingéniérie de la Matière Molle (formerly PPMD), UMR 7615 of CNRS and ESPCI, 10 rue Vauquelin, F-75005 Paris, France
Corresponding author: [email protected]
Abstract: We investigate the coating of a glass plate with silica colloids by a dip coating method in pres-ence of evaporation. We show experimentally that the deposed quantity plotted versus plate velocity V ex-hibit a minimum, in agreement with a simple argument developed by us in a previous, theoretical paper. This minimum corresponds to a crossover between the well-known Landau-Levich regime observed at higher plate velocity and a less well-known regime at lower plate velocity where the deposit is formed directly at the contact line. This very general result is consistent with experiments and calculations made by other teams with different compounds or under different wetting geometries. Modifying our initial argument by taking into account the particle density gradient, we show that a simple modelling of each regime in terms of scal-ing laws is possible, the deposed mean thickness scalscal-ing respectively as V -1 and V 2/3 in the lower and higher velocity limits, which is consistent with our data and with available literature.
Keywords: coating, colloids, moving contact line, wetting and evaporation, drying. *Manuscript
1 2 3 4 5 6 7 8 9 10 11 12 13 14 15 16 17 18 19 20 21 22 23 24 25 26 27 28 29 30 31 32 33 34 35 36 37 38 39 40 41 42 43 44 45 46 47 48 49 50 51 52 53 54 55 56 57 58 59 60 61 62 1 – Introduction
There is a growing interest in coating hard and soft substrates with colloids, because of numerous applications to optics and microelectronics [1-2]. A possibility to realize these substrates is to use dip coating under evaporation [3], i.e. to remove at constant speed a plate from a bath of colloidal suspension while dry-ing occurs. This leads to several undesired effects: defects, heterogeneous deposition, cracks and delamina-tion [1,4]. The problem is also difficult to model as three singularities may coexist at the contact line (CL) receding on the substrate [5-6] (and even in a advancing case [6]) : (1) divergence of viscous stresses, (2) di-vergence of evaporation as in the well known “coffee stain” effect [8-10], (3) and didi-vergence of colloid con-centration.
In a recent paper we modelled the hydrodynamics in the vicinity of a moving, evaporating, contact line [5], and we found that there should exist two different regimes at respectively low and high plate veloc-ity, in which the deposed mean thickness e should respectively decrease and increase with the plate velocity
V. This should lead to a minimum of the deposit thickness for a critical intermediate velocity. If we except a
very recent study performed with complex compounds on silicium substrates [11], this effect has been scarcely evidenced in a dip coating experiment with colloids, though similar behaviours were found for deposition of phospholipids [12], and in a rather specific two-plate geometry (meniscus receding in a Hele-Shaw cell) [13-14].
We present here evidences in favour of this effect in the case of silica colloids deposited on glass from water solutions with dip coating [6]. Our experimental conditions are described in section 2, and the re-sults presented in section 3. To summarize, we found that the deposition is perturbed by complex behaviours (stick-slip and instability) that strongly alter the uniformity of the deposit, but despite this additional com-plexity the two predicted regimes indeed appear with this minimum of deposed thickness at their crossover. In section 4, we reconsider our qualitative modelling of ref. [5], including the effect initially neglected of the particle concentration gradient. We show that this additional term modifies the predictions in the limit of low plate velocity, for which the deposed thickness scales as e~V -1 instead of e~V -2 (as initially suggested in [5-6]), while in the limit of high velocity one finds e~V 2/3 as expected from the classical Landau-Levich film entrainment description. These predictions are in good agreement with our data and with others obtained on different systems [11-16]. Let us note here that the V -1 law has been proposed very early by Dimitrov and Nagayama [15] and rediscovered later independently by Diao and Xia [16], and by Jing et al. [14] who inter-preted it on the basis of a balance of solvent at the scale of the meniscus. As we shall see both arguments (our’s and the solvent balance at the meniscus level) are equivalent, the interest of our approach being that scaling laws are also provided for the spatial dependency of particle concentration during deposition. This could allow one to build future extensions to situations involving several independent length scales, or to prepare further experimental investigations of these spatial effects with - for instance - fluorescent micros-copy.
1 2 3 4 5 6 7 8 9 10 11 12 13 14 15 16 17 18 19 20 21 22 23 24 25 26 27 28 29 30 31 32 33 34 35 36 37 38 39 40 41 42 43 44 45 46 47 48 49 50 51 52 53 54 55 56 57 58 59 60 61 62
(a)
(b)
(c)
(d)
(e)
Fig. 1: (a) Experimental set up. (b) A typical AFM visualization of the deposit. (c-e): deposit left on the plate after dry-ing, observed by optical profilometry, for increasing plate velocity: (a) V=50 μm/s, (b) V=1 mm/s, (c) V=5 cm/s. The motion of the plate took place along the horizontal direction. The suspension concentration was equal to 10%, and the particle size (not visible here) was equal to 50 nm. The horizontal scale of these pictures is respectively equal to 1.5 mm, 8 mm and 1.5 mm (total extent of the pictures).
2 – Experimental conditions.
A sketch of the experimental set-up is suggested on Fig.(1-a). A clean glass plate is plunged inside a colloi-dal suspension and removed from this bath at constant speed (V ranging between 50 m/s and 5 cm/s), while
deposition and evaporation takes place on the glass. We used silica suspensions (Klebosol silica slurries 50R50, 30R25 and 30R12) with three different particle diameters (12 nm, 25 nm and 50 nm), and two differ-ent volume concdiffer-entrations (0=5% and 10%). The glass plate is cleaned and prepared before each experi-ment by the following protocol. First the glass surface is rub with an abrasive cerium oxide suspension (con-centration 20%), cleaned with pure water, ethanol, and again pure water, and then let to dry. A plasma treat-ment is then imposed to the glass. After drying completion, the deposit has been observed with an atomic force microscopy (AFM), and by optical profilometry.
1 2 3 4 5 6 7 8 9 10 11 12 13 14 15 16 17 18 19 20 21 22 23 24 25 26 27 28 29 30 31 32 33 34 35 36 37 38 39 40 41 42 43 44 45 46 47 48 49 50 51 52 53 54 55 56 57 58 59 60 61 62
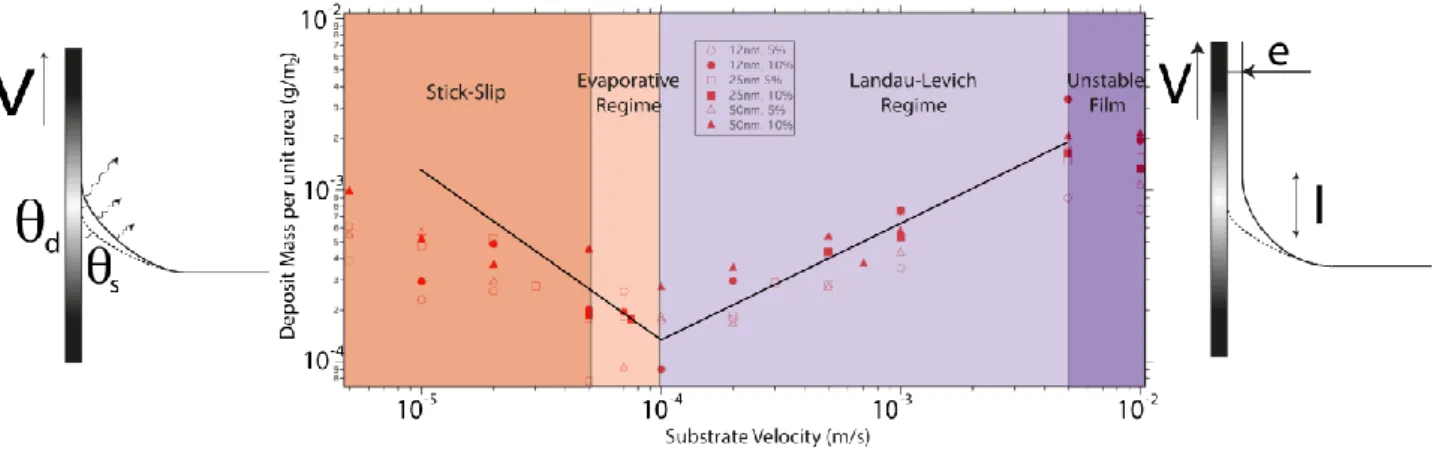
Fig. 2: Mean thickness of silica colloids deposed on a glass plate by dip coating. Roughly, two regimes of deposition appear, the one on the right being linked to the entrainment of a landau-Levich film at high plate velocity, the other on the left with deposition and evaporation directly at the contact line (the continuous lines, of respective slope -1 and 2/3 are guides for the eyes).
A typical example of an AFM visualisation is reproduced on Fig. (1-b), and several views with optical pro-filometry on Figs.(1-c) to (1-e). The particles are deposed in a random way, with many defects at small scale, and the spatial distribution at large scale is also scarcely uniform, perturbed by a disordered patterning linked to stick-slip and instabilities of the contact line.
3 – Experimental results.
Most of our investigations were performed with optical profilometry, which has the advantage to provide a deposit cartography at large scale. Typical “maps” obtained with this method, are reproduced on Figs. (1-c) to (1-e) for increasing plate velocities. At low velocity (Fig. 1-c), the deposit is perturbed by a stick-slip ef-fect, similar to the one observed by Rio et al [7] or Ghosh et al. [17] respectively for advancing and receding contact lines of colloidal suspensions, or to the one identified between two plates by Bodiguel et al. [13]. At intermediate velocities (Fig. 1-d), the deposit is reasonably uniform, before to be again perturbed by film flow instabilities at high plate velocity (Fig. 1-e) of unknown origin. We have measured the mean thickness of the deposit, using these profilometry records, versus plate velocity for the different particle sizes and con-centrations. While this methods gives us a first idea of the shape of the deposit it has two significant draw-backs: a reference point is needed (i.e. we need to have naked glass on the image to have a reliable meas-urement) and the field of view is limited to a few millimetres (while the coated surface of the substrates were 15cm x 8cm). These two combined constraints leads to measurements in the vicinity of the initial contact line, where transitional regimes are most likely to happen. We then relied on a more averaged methods con-sisting on weighing the substrates before and after the experiment. The results are displayed too on Fig. 2, where two distinct regimes separated by a minimum of the thickness are clearly visible, in good agreement with our theory [5-6].
1 2 3 4 5 6 7 8 9 10 11 12 13 14 15 16 17 18 19 20 21 22 23 24 25 26 27 28 29 30 31 32 33 34 35 36 37 38 39 40 41 42 43 44 45 46 47 48 49 50 51 52 53 54 55 56 57 58 59 60 61 62
(a)
(b)
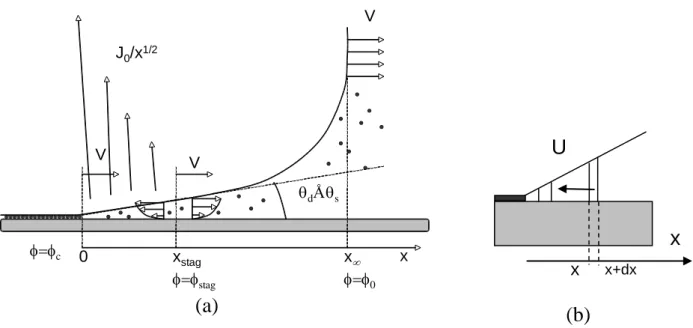
Fig. 3: (a) Sketch of the low velocity problem in the framework of the plate, treated here as static, the liquid receding to the right. (b) During its motion towards contact line, the volume of a slide of liquid is changing because of evaporation, which introduces a change of particle concentration.
The continuous lines on the same figures are guide for the eyes of slope -1 and 2/3. Clearly, the behaviour at high velocity is in agreement with the exponent 2/3 deduced in [5] from Landau-Levich result, while things are less obvious at low velocity, but clearly indicate a continuous decrease of thickness with V. Note also the existence in each of the two domains of two more specific zones : just between the stick-slip region and the minimum of thickness there seems to exist a narrow region of deposition (“Evaporative regime”), in which the mean deposit thickness still decreases but without spatial modulations, and at large substrate velocity the thick film entrained by the plate undergoes complex instabilities which perturb the deposit distribution (“Un-stable film”).
3 – Theoretical discussion.
We now remind the physical origin of the two very different behaviours, suggested by the two sketches on the same figure, and provide the reader with a qualitative modelling of both regimes. In the higher velocity range, the plate entrains a continuous film of liquid out of the bath, that dries later on the whole extent of the plate. As well known from available literature [3], the thickness of the liquid film e is equal to that calculated long ago by Landau, Levich and Derjaguin, and should scale as
e
l
cC
a2 / 3 where
Ca
V
designates the Capillary Number built upon liquid viscosity , plate velocity V, surface tension , and wherel
c
/
g
is the capillary length (g acceleration of gravity, mass density of the liquid). During drying, the volume fraction occupied by the particles in the liquid increases from the initial volume fraction 0 to aV V V dÅ s x x xstag 0 c stag 0 J0/x1/2
x
U
x
x+dx1 2 3 4 5 6 7 8 9 10 11 12 13 14 15 16 17 18 19 20 21 22 23 24 25 26 27 28 29 30 31 32 33 34 35 36 37 38 39 40 41 42 43 44 45 46 47 48 49 50 51 52 53 54 55 56 57 58 59 60 61 62
critical value close to the maximal packing concentration c, which implies that the deposit thickness should scale as eHV
0
clc
V
2 / 3 (1)in the limit of high velocities. As said above, a line of slope 2/3 has been indicated on the Log-Log plot of Fig. 2. As one can check, this slope is consistent with the obtained data. At low velocity (see the sketch on Fig. 3-a), the situation is very different. There is now a contact line, from which the deposit directly emerges, evaporation being now mainly localized at the contact line itself. Following Deegan et al. [8-9], the evapo-rating flux diverges there, following a law of the kind (see Fig. 3-a):
JJ0/ x1/ 2
(2) where J0 can be estimated here by noting that at the scale of the meniscus size x, the mean evaporating ve-locity should be given by:
J0 x D x csat
w (3)where D is the diffusivity of water in air, csat the saturation mass concentration of water vapour in air,
supposed to be reached at the free surface of the liquid (and to vanish at infinity), and w the mass density of water. In the framework attached to the plate, the liquid motion should obey the following mass conservation equation: V h x x
hux
J0 x (4)where <ux> designates the mean velocity averaged on the liquid thickness h(x), given in the lubrication
approximation by:
u
x
(h
23
)(
P
x)
, with
P
P
atm
2h
x
2
, Patm being the reference
atmospheric pressure. Integrating one time this equation leads to a mean velocity
uxV J0
2h(x) x (5)
that exhibits a stagnation surface located at a distance of the contact line equal to:
xstag J0 2
dV 2 (6)where d is the dynamic contact angle, supposed to be rather close to the static angle S in this low velocity
limit. The structure of the flow is suggested on Fig. 3-a. For scales x<xstag evaporation drives everything to
the contact line, and in particular all the colloids trapped in this region. We thus guess that xstag will play the role of a capture length ruling the thickness deposited on the plate in the low velocity limit eLV . To estimate
1 2 3 4 5 6 7 8 9 10 11 12 13 14 15 16 17 18 19 20 21 22 23 24 25 26 27 28 29 30 31 32 33 34 35 36 37 38 39 40 41 42 43 44 45 46 47 48 49 50 51 52 53 54 55 56 57 58 59 60 61 62
it, a balance of solute can be written as follows: the plate is withdrawing from the liquid a volume per unit of length and unit of time of solute equal to VeLVc, while the stagnation surface crosses a volume of solute equal to VSxstagstag where stag is the colloid concentration that holds at the stagnation line. If, as in ref. [5] one identifies stag to the colloid concentration that holds in the bulk of the liquid, this balance leads finally to a deposit thickness that reads [5]:
eLV
cJ02
4
SV2 (7)As anounced at the begining of the present paper, unlike eHV this thickness decreases with the plate velocity, which, combined to (1) leeds indead to a minimum of the deposed thickness. This description is enough to explain our results, but if one looks more carefully to the data at low velocity on Fig.2, the exponent predicted by this model (equal here to 2) overestimates the observed decrease of eLV upon V, an exponent close to 1 (suggested by the line added to the graph) would be more reasonable. This observation is consistent with results obtained with other compounds by Faustini [11], Le Berre [12] and Jing et al. [13], the three groups reporting an exponent close to 1. This presumably results from the too rough nature of the approximate stag≈used above. Obviously, the concentration of solute increases as the liquid becomes closer and closer to the contact line. A simple scaling argument can be built on a slide of liquid, of thickness dx (see Fig. 3-b), moving inside a wedge of angle S , at a velocity U towards the contact line, and whose variation of volume per unit length of contact line reads:
hdx
U
t
x
U
x
t
t
(xU)
x
(8)After combining this with the estimated velocity of the liquid close to contact line,
U
J
0/(2
x)
, one is led to the conclusion that the slide volume scales as
x(t)
, and thus that the particle concentration near contact line should in turn scale as:
(x)
0x
x
(9)where the concentration holds at the scale of the meniscus (matching with the bulk of the reservoir). Using
this expression in the estimate of stag≈0(x/xstag)
1/2 leads finally to the following law ruling the ”true” eLV:
eLV
0
c J0 x x V (10)in which the new exponent -1 , smaller than the previous value -2 is in better agreement with all available data [6-16]. Note that this expression, as noticed by Doumenc [13], can be reached independently by a balance of solute at the level of the whole meniscus: while the meniscus deposits on the plate of volume of the coated film equal to VeLVcdt, there is, at the scale of the whole meniscus, a volume of solvant that
1 2 3 4 5 6 7 8 9 10 11 12 13 14 15 16 17 18 19 20 21 22 23 24 25 26 27 28 29 30 31 32 33 34 35 36 37 38 39 40 41 42 43 44 45 46 47 48 49 50 51 52 53 54 55 56 57 58 59 60 61 62 evaporates equal to
x
J0/ x
dt, and which creates an excess of solute of quantity
0x
J0/ x
dt. Balancing this excess of particles with the quantity deposited on the plate leads directly to (10).4 – Conclusion.
In summary, we have checked experimentaly with silica particles deposed on glass our prediction proposed in [5] of the existence of a minimal thickness of colloids deposited on a plate by dip coating, and corrected our model by including the increase of colloid concentration when the liquid reaches the vicinity of the contact line in the low velocity limit. We insist on the fact that this simple approach avoids any use of complicated partial differential equations, and allows one to get a simple understanding of the mechanisms at play here. The behavior that we found, experimentally as well as by a simple modeling, is in agreement with the observations of other groups on different systems [11-13], and with their own interpretations. It would be interesting to explore experimentally in more details the spatial distribution of colloid concentration in the liquid near the deposition front, to see to what extent a scaling law of the kind (9) could hold. To our knowledge, this has never been done and we are perhaps the first to propose this law. Also, it would be interesting to relate the present transition with the classical Landau-Levich threshold of film entrainment [18], and to see if evaporation and deposition introduces a completely different phenomenon, or simply shifts this threshold, for instance via modifications of the reference contact angle due to evaporation [5].
Aknowledgments: We are indebted to discussions with C.-T. Pham, H. Bodiguel, F. Doumenc and B. Guerrier. One of us (G.B.) has benefited from a DGA grant, and this work has been supported by the ANR funding DEPSEC.
References
[1] N. R. Thomson, C. L. Bower, and D. W. Mc Comb, “Identification of mechanisms, competing with self-assembly during directed colloidal deposition”, Jour. of Mater. Chem. 18, 2500-2505 (2008).
[2] Y. K. Koh and C. C. Wong, “In situ monitoring of structural changes during colloidal self-assembly”, Langmuir, 22, 897–900 (2006).
[3] D. Qu, E. Ramé and S. Garoff, “Dip-coated films of volatile liquids“, Phys. Fluids 14, 1154-1166 (2002).
[4] L. Pauchard, M. Adda-Bedia, C. Allain, Y. Couder, “On the morphologies resulting from the directional propagation of fractures”, Phys. Rev. E 103, 123-139 (2002); L. Pauchard, “Patterns caused by buckle-driven delamination in desiccated colloidal gels”, Europhys. Lett. 74, 188 (2006).
[5] G. Berteloot, C.-T. Pham, A. Daerr, F. Lequeux and L. Limat, “Evaporation-induced flow near a contact line: Con-sequences on coating and contact angle”, Europhys. Lett. 83,14003-14009 (2008).
[6] G. Berteloot, Déposition de particules sous évaporation : Application au dip-coating, Thesis Univ. Perre et Marie Curie, defended in ESPCI on the 16th November 2009 (2009).
[7] E. Rio E., A. Daerr A, F. Lequeux and L. Limat, “Moving contact lines of colloidal suspension in presence of dry-ing“, Langmuir 22, 3186-3191 (2006).
1 2 3 4 5 6 7 8 9 10 11 12 13 14 15 16 17 18 19 20 21 22 23 24 25 26 27 28 29 30 31 32 33 34 35 36 37 38 39 40 41 42 43 44 45 46 47 48 49 50 51 52 53 54 55 56 57 58 59 60 61 62
[8] R. D. Deegan, O. Bakajin, T. F. Dupont, G. Huber, S.R. Nagel, and T.A. Witten, “Capillary Flow as the Cause of Ring Stains from Dried Liquids”, Nature 389, 827-828 (1997).
[9] R. D. Deegan, O. Bakajin, T. F. Dupont, G. Huber, S. R. Nagel and T. A. Witten, “Contact line deposits in an evaporating drop”, Phys. Rev. E 62, 756 (2000).
[10] G. Berteloot, A. Hoang, A. Daerr, H. Pirouz Kavehpour, F. Lequeux and L. Limat, Evaporation of a sessile
drop-let : inside the coffee stain, to appear in JCIS (2011).
[11] M. Faustini, B. Louis, P. A. Albouy, M. Kuemmel and D. Grosso, “Preparation of Sol-Gel Films by Dip-Coating in Extreme Conditions”, J. Phys. Chem. C 114, 7637–7645 (2010).
[12] M. Le Berre, Y. Chen, D. Baigl, “From Convective Assembly to Landau-Levich Deposition of Multilayered Phos-pholipid Films of Controlled Thickness”, Langmuir 25, 2554-2557 (2009).
[13] H. Bodiguel, F. Doumenc and B. Guerrier, “Stick-Slip Patterning at Low Capillary Numbers for an Evaporating Colloidal Suspension”, Langmuir 26, 10758–10763 (2010).
[14] G. Jing, H. Bodiguel, F. Doumenc, E. Sultan, B. Guerrier, “Drying of colloidal and polymer solutions near the con-tact line: deposit thickness at low capillary number”, Langmuir 26, 2288-2293 (2010).
[15] A. S. Dimitrov and K. Nagayama, “Continuous Convective Assembling of Fine Particles into Two-Dimensional Arrays on Solid Surfaces”, Langmuir 12, 1303-1311 (1996).
[16] J. J. Diao and M. G. Xia, ”A particle transport study of vertical evaporation-driven colloidal deposition by the cof-fee-ring theory”, Coll and Surf. A 338 , 167–170 (2009).
[17] M. Ghosh, F. Fan and K. J. Stebe, “Spontaneous Pattern Formation by Dip Coating of Colloidal Suspensions on Homogeneous Surfaces”, Langmuir 23, 2180–2183 (2007).
[18] see for instance D. Bonn, J. Eggers, J. Indekeu, J. Meunier and E. Rolley, “Wetting and spreading”, Rev. Mod.
Figure 1-a
Figure 1-b
Figure 1-c
Figure 1-d
Figure 1-e
Figure 2
Figure 3-a
Figure 3-b