HAL Id: hal-01491987
https://hal.archives-ouvertes.fr/hal-01491987
Submitted on 17 Mar 2017
HAL is a multi-disciplinary open access archive for the deposit and dissemination of sci-entific research documents, whether they are pub-lished or not. The documents may come from teaching and research institutions in France or abroad, or from public or private research centers.
L’archive ouverte pluridisciplinaire HAL, est destinée au dépôt et à la diffusion de documents scientifiques de niveau recherche, publiés ou non, émanant des établissements d’enseignement et de recherche français ou étrangers, des laboratoires publics ou privés.
Does Commercial Microfinance Belong to the Financial
Sector? Lessons from the Stock Market
Marie Brière, Ariane Szafarz
To cite this version:
Marie Brière, Ariane Szafarz. Does Commercial Microfinance Belong to the Financial Sector? Lessons from the Stock Market. World Development, Elsevier, 2015, 67, �10.1016/j.worlddev.2014.10.007�. �hal-01491987�
Does Commercial Microfinance Belong to the
Financial Sector? Lessons from the Stock
Market
Marie Brière and Ariane Szafarz
This paper is the first to draw a global picture of worldwide microfinance equity by taking full advantage of daily quoted prices. We revisit previous findings showing that investors should consider microfinance as a self-standing sector. Our results are threefold. First, microfinance has become less risky and more closely correlated with the financial sector. This convergence is associated with a decline in the proportion of women borrowers. Second, microfinance and finance shares have equivalent currency exposure. Last, introducing a self-standing microfinance sector presents few diversification benefits. This paper confirms that microfinance has changed dramatically during the last decade.
Keywords: Microfinance; South Africa; Kenya; Indonesia; Bangladesh; Mexico. JEL Classifications: G11, G15, O16, C58, G21.
CEB Working Paper N° 14/024
October 2014
Université Libre de Bruxelles - Solvay Brussels School of Economics and Management Centre Emile Bernheim
ULB CP114/03 50, avenue F.D. Roosevelt 1050 Brussels BELGIUM e-mail: [email protected] Tel. : +32 (0)2/650.48.64 Fax: +32 (0)2/650.41.88
Does Commercial Microfinance Belong to the
Financial Sector? Lessons from the Stock Market
Marie Brière
Amundi, Paris Dauphine University, Université Libre de Bruxelles (ULB), SBS-EM, CEB
Ariane Szafarz*
Université Libre de Bruxelles (ULB), SBS-EM, CEB, and CERMi
This version: October 2014 Forthcoming in World Development
Keywords: Microfinance; South Africa; Kenya; Indonesia; Bangladesh; Mexico. JEL codes: G11, G15, O16, C58, G21
* Corresponding Author: Address: ULB, 50, Avenue F.D. Roosevelt, CP 114/03, 1050 Brussels, Belgium, Email: [email protected], Phone: +32.2.650.48.65, Fax: +32.2.650.41.88
Abstract
This paper is the first to draw a global picture of worldwide microfinance equity by taking full advantage of daily quoted prices. We revisit previous findings showing that investors should consider microfinance as a self-standing sector. Our results are threefold. First, microfinance has become less risky and more closely correlated with the financial sector. This convergence is associated with a decline in the proportion of women borrowers. Second, microfinance and finance shares have equivalent currency exposure. Last, introducing a self-standing microfinance sector presents few diversification benefits. This paper confirms that microfinance has changed dramatically during the last decade.
1. Introduction
The microfinance industry offers attractive opportunities to investors who want to help alleviate poverty in developing countries. Furthermore, microfinance is often perceived as different from conventional finance. It is thought to be riskier because borrowers generally have no collateral and little or no credit history to underpin a precise assessment of their credit risk. Despite this, investing in microfinance is also viewed as a way of diversifying from international markets in general and the conventional financial sector in particular (Gonzalez, 2007; Krauss & Walter, 2009; Di Bella, 2011; Galema, Lensink, & Spierdijk, 2011). This diversification effect stems from the special nature of microfinance institutions, which are driven by a double bottom-line (social and financial), and from the fact that they are less leveraged than traditional financial institutions. By scrutinizing the most recent trends of this rapidly evolving industry, this paper aims to check whether investors still need to consider microfinance as a self-standing sector. To this end, it examines both the risk factors associated with microfinance and the diversification benefits of microfinance investment.
Microfinance has changed dramatically during the last decade, moving from a universe of donor-financed NGOs towards a widely disparate industry (Mersland, 2009), including a growing number of commercial banks. Simultaneously, socially responsible investments have gained momentum on financial markets. We assess the impact of microfinance equity on globally diversified portfolios by using the classical tools of portfolio analysis. For that purpose, we construct original microfinance country indices, analyze their movements, and assess them in reference to comparable indices for the financial sector and to national indices. We also take international equity indices into consideration.1 Our findings show that although
1 In 2003 J.P. Morgan and CGAP created the Low-Income Finance Institutions (LIFIs) index, including not only
the microfinance sector has definitely moved closer to conventional finance, the risk-return trade-off has also changed.2 Microfinance equity is now less risky than before, but it is also much more closely correlated with the financial sector, and yields fewer diversification benefits. We conclude that microfinance can reasonably be considered as part of the financial sector.
Two types of public investments in microfinance are currently available: Microfinance Investment Vehicles (MIVs)3 and listed equity of Microfinance Institutions (MFIs). For reasons of data availability, this paper concentrates on listed MFIs. Arguably, microfinance equity is not representative of the whole sector.4 However, while confined to a relatively small number of assets, microfinance equity has the considerable advantage over MIVs of being publicly priced daily on stock exchanges. This makes it more transparent and allows for deeper financial analysis. Conversely, MIVs invest in several MFIs mainly through loans, but the content of their portfolios is often opaque,5 making it difficult for outsiders to assess the actual level of risk.
The microfinance sector has experienced successful initial public offerings (IPOs) such as the highly publicized flotation of Banco Compartamos in Mexico in 2007. These IPOs have nevertheless been criticized by influential players, including Nobel Prize winner Muhammad
Kneiding, 2009). Wall’s Street Advisor Services (WSAS) has also released a set of benchmarks for investments in MFIs, the WSAS MFI Shareholder Value Indices, computed from book values (see http://www.wallsstreetadvisorservices.com/). By contrast, our indices are based on market prices only.
2
Our paper examines whether this assertion holds true for investors who are seeking financial returns only. Alternatively, financial and social returns can be combined (see Drut, 2010; Dorfleitner, Leidl, & Reeder, 2012).
3
See e.g. Matthäus-Maier and von Pischke (2006).
4 In particular, many MFIs still rely on subsidies for reaching financial sustainability (Hudon, 2010; Nawaz,
2010; Hudon & Traca, 2011).
5 The authors - and colleagues from other universities - have tried for years to obtain data on MIVs with little
Yunus, who views the Compartamos IPO as mission drift6 that compromises the sector’s reputation (see Ashta & Hudon, 2012, for a detailed discussion). Leaving ethical and mission-based considerations aside, this paper is the first, to our knowledge, to start from observable returns of publicly traded MFIs. From a portfolio perspective, these returns are to be judged not only on a case-by-case basis but also in regard to their correlation with other assets.
Previous work has already investigated the financial properties of microfinance investment. However, because of data availability issues, authors are bound to use figures extracted from annual accounting statements provided by the Microfinance Information Exchange (MixMarket) rather than high frequency market data. This significantly limits the relevance of their results for mainstream investors. From this perspective, Krauss and Walter (2009) present evidence that, over the period 1998-2006, including microfinance in global portfolios reduced overall portfolio volatility, but that the same result did not hold for domestic investors. Using MixMarket data for the period 1997-2007, Galema et al. (2011) apply the spanning test methodology proposed by De Roon, Nijman and Werker (2001), and confirm that investment in microfinance is beneficial in terms of portfolio diversification. O'Donohoe et al. (2009) were the first to compare the performances of listed MFIs with those of financial indices. Their results are twofold. First, over the 2003-2008 period, the listed MFIs outperformed banks worldwide. Second, the financial ratios of Mexican listed MFIs did converge toward those of their domestic banks. In this paper, we construct microfinance country equity indices and an international Global Microfinance Index (GMI). We analyze the changes in these indices, assessing them in reference to comparable indices for the financial sector and also to national indices. Our findings show that microfinance has been closely
6 Microfinance mission drift stems from the double bottom-line (social and financial) embodied by the MFIs. An
MFI is said to be mission-drifted when it sacrifices its social mission (typically, poverty alleviation and/or women’s empowerment) for financial purposes (see, e.g., McIntosh & Wydick, 2005; Copestake, 2007; Ghosh & Van Tassel, 2008; Mersland & Strøm, 2010; Armendariz & Szafarz, 2011).
correlated with the financial sector since 2003. Evidence suggests that the gradual integration of microfinance stocks into mainstream finance coincides with a decline in the proportion of female borrowers. In terms of risk exposure, estimates of the Capital Asset Pricing Model (CAPM) demonstrate that microfinance shares exhibit higher market beta than those of conventional financial institutions and have equivalent currency exposure. We then turn to spanning tests and show that introducing a self-standing microfinance sector presents little interest regarding banking sector diversification in emerging countries.
The remainder of the paper is structured as follows. Section 2 describes the database and methodology. In section 3, we study the joint movements of the finance and microfinance indices. In section 4, we analyze microfinance risk exposures by estimating both a local CAPM including the foreign-exchange factor and an international four-factor model. Section 5 assesses the diversification benefits of microfinance stocks. Section 6 concludes.
2. Data and Methodology
We consider the complete universe of listed MFIs.7 This exhaustive approach is a real advance over the existing literature because the securities in question are the only assets that allow investors attracted by the microfinance sector to gain direct access to the capital of MFIs. The alternative, MIVs, concentrates primarily on loans to MFIs (Reille, Glisovic-Mezieres, Berthouzoz, & Milverton, 2009), and the choice of institutions benefiting from them is often unclear.
7 We follow De Mariz, Reille and Rozas (2011) and consider listed institutions with daily liquidity of at least
USD 0.2 million. This ensures that prices are not distorted by supply/demand imbalances. Actually, we only exclude SKS, the Indian quoted MFI, because its IPO is too recent (August 2010).
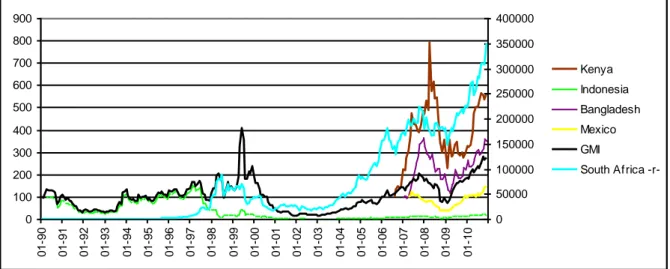
Three MFIs are quoted in South Africa: African Bank (the oldest quoted MFI, since January 1990), Blue Financial Services (BFS), and Capitec; one in Kenya: Equity; two in Indonesia: Danamon (also one of pioneering quoted MFI, since April 1990) and Bank Rakyat Indonesia (BRI); one in Bangladesh: Brac; and two in Mexico: Compartamos and Financiera Independencia (FI).
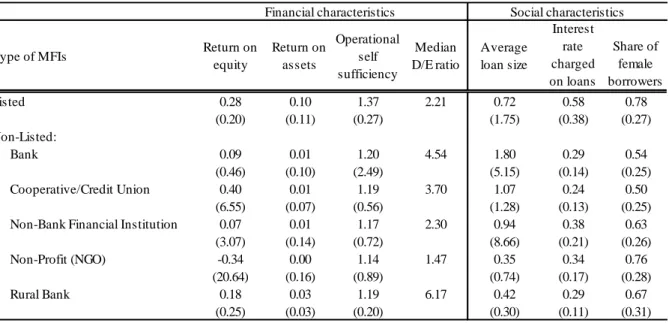
Given the small number of listed MFIs, it is important to understand how they compare to the universe of MFIs in the developing world. MFIs are hybrid institutions driven by both financial and social motives. Acknowledging this double-bottom-line specificity, Table I successively reports not only financial characteristics (return on equity, return on assets, operational self-sufficiency (OSS),8 and debt-to-equity ratio), but also social ones (average loan size, interest rates charged on loans, and share of female borrowers). The non-listed MFIs are broken down into statutory categories according to the classification proposed by the Microfinance Information Exchange, Inc. (MixMarket).9
Regarding financial characteristics, Table I shows that listed MFIs are among the most profitable MFIs, although most differences are not statistically different because the microfinance industry is highly heterogeneous, which implies significant dispersion of financial indicators. The relatively higher profitability of listed MFIs is especially apparent in OSS values. Two factors concur to explain this outcome. First, IPOs impose changes in firms’
8 OSS is equal to the total financial revenue divided by (financial expenses plus loan loss provision plus
operating expenses). An MFI with an OSS value above 100% is said “operationally sustainable,” meaning that its revenue from lending is sufficient to cover its costs, including the cost of capital, accounting for bad loans, and paying operating expenses (see Ahlin & Lin, 2006).
9 The MixMarket is the leading business information provider dedicated to microfinance sector. The organization
provides detailed financial and social performance information from MFIs. MixMarket data is self-reported. In addition, a diamond-based ranking system gauges the MFIs’ level of transparency. Our sample is restricted to MFIs having at least three diamonds (1,355 observations out of a total of 1,407 MFIs).
capital structure. As pointed out by Cull, Demirgüç-Kunt and Morduch (2011), complying with regulations affects the characteristics of microfinance institutions. Second, many non-listed MFIs still rely on subsidies, which may hinder financial performance. Bogan (2012) points out that long-term use of grants perpetuates inefficiencies by insulating MFIs from competitive pressure. In contrast, listed firms are exposed to competition, as they need to attract market funding.10
< Insert Table I here >
The social performances reported in Table I are summarized by three indicators widely used in microfinance: average loan size, measured by the average loan balance per borrower scaled by GNI per capita; the interest rate charged on loans, proxied by the nominal yield on gross portfolio; and the share of female borrowers.11
Listed MFIs exhibit average loan sizes in a range comparable to those of their non-listed counterparts. In contrast, the interest rates charged by listed MFIs (above 50% a year on average) are higher, although not significantly so, than those charged by non-listed MFIs (between 24% and 38% a year on average). The high level of interest rates charged to poor borrowers is a controversial issue in microfinance, especially from an ethical standpoint
10 In microfinance this basic capitalistic principle is somewhat mitigated by the fact that the shareholders of
listed MFIs include charitable institutions and socially responsible investors who are ready to tolerate some financial sacrifices in exchange for fulfilling a social mission.
11
Despite being widely used in practice, these indicators are not free from criticisms. For instance, average loan size is a poor indicator for at least two reasons. First, it is abusively penalizing for cross-subsidization and progressive lending (Armendariz & Szafarz, 2011). Second, its use can create a perverse incentive to offer disadvantageous credit conditions to some client segments, such as women and discriminated-against minorities (Agier & Szafarz, 2013).
(Hudon, 2007). Practitioners argue that high interest rates are inevitable without subsidization, mainly because the operational costs associated with managing small loans are high (Fernando, 2006). Strikingly, listed MFIs serve 78% of female borrowers on average, which places them slightly above their non-listed counterparts (from 50% to 76%). Again, the differences are hardly significant. Overall, the social performances of listed MFIs do not depart from those of the rest of the industry. IPOs per se do not seem to entail mission drift. This is a promising sign for the future of microfinance, as commercialization currently represents a strong trend in the industry (Bogan, 2012) and new IPOs are to be expected in the near future.
Listed MFIs represent less than 0.1% of world market capitalization. Relative to their domestic market, however, most microfinance stocks are far from negligible. To get a clear picture, Table II reports data on market capitalizations for all finance and microfinance stocks in our dataset, as well as the shares of their countries in the world’s emerging stock markets. All market capitalizations are computed from Morgan Stanley Capital International (MSCI) indices. In the countries where microfinance has listed stocks, we give the capitalization of these stocks with respect to both their domestic finance-plus-microfinance (F+MF) sector (Table II, column 5), and their domestic equity market (Table II, column 6). In most cases, the market shares of microfinance stocks are comparable to those of mainstream financial stocks. This is especially relevant for Kenya, where Equity Bank dominates the F+MF sector (31%) and accounts for a notable 14% of the domestic stock market. To obtain a scaling perspective, Table II also provides the market shares of the countries at stake in F+MF sectors in the worldwide emerging-finance sector (column 7), and in the emerging-market universe (column 8). Together, the five countries under scrutiny account for 9.61% of the emerging financial sector and 12.4% of the emerging-market universe.
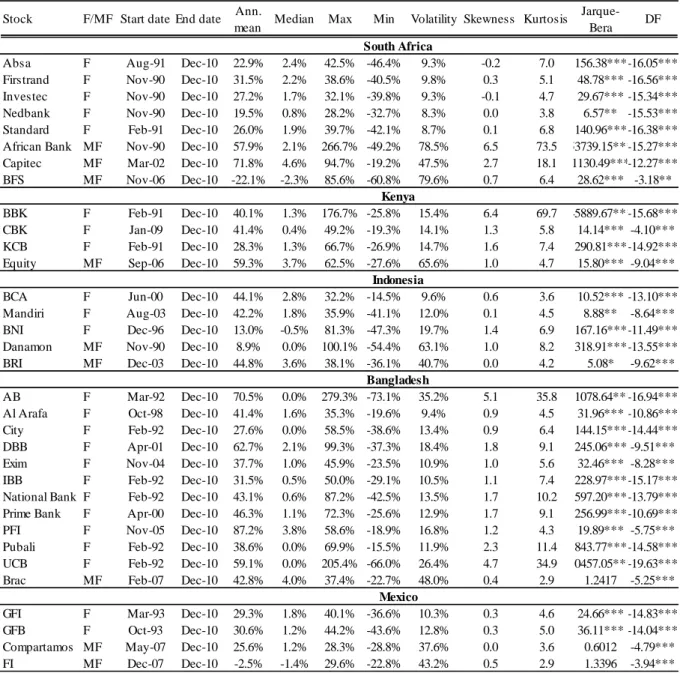
The descriptive statistics for monthly returns are presented in Table III. The data, from Datastream, cover the period for which each series is available, and end in December 2010. These statistics show great disparity in returns, especially those from MFIs. Some MFIs have been exceptionally profitable since their IPO, such as African Bank (annualized monthly return of 57.9% since 1990) and Capitec (71.8% since 2002) in South Africa12 or Equity in Kenya13 (59.3% since 2006). Conversely, others have performed disastrously, including BFS, a South African MFI, (-22.1% since 2006). All have very high volatility (from 37.5% for Compartamos to 79.6% for BFS) and high levels of extreme risks. The returns also display something rarely found in finance: they are nearly always asymmetrical to the right, with skewness as high as 6.5 for African Bank. At the same time, African Bank has an exceptionally fat-tailed distribution, with kurtosis of 73.5, and a maximum of 266% for one month and 233% for one day, both occurring in February 1995. All returns have been positively tested for stationarity.
< Insert Table III here >
To estimate the local CAPM and the international Fama-French-Carhart model in Section 4, we use country stock indices from MSCI and the four standard global factors
12 The history of the microfinance industry in South Africa is singular (see Porteous & Hazelhurst, 2004; Napier,
2006). After having experienced full deregulation in the post-apartheid period (1992-1999), which enhanced commercial microcredit activities, the sector started to be supervised by the Microfinance Regulatory Council (MFRC) which is “entrusted with the responsibility of regulating the activities of the micro lending sector and to protect consumers against deceptive and unfair lending practices in terms of the Usury Act Exemption Notice (…) of June 1999.” (http://www.dti.gov.za/thedti/mfrc.htm).
13 Rhyne (2009) mentions that Equity boasts over a million small savers and was recognized as the best bank in
(market, size, value and momentum) in USD retrieved from Kenneth French’s website.14 More precisely, the country indices are quoted in domestic currencies and encompass 21 stocks in Mexico, 45 in South Africa, 22 in Indonesia, and 7 in Kenya.15 The industry composition of each country index reflects the specific features of the local market. Data for interest rates (three-month interbank rates) in each country and exchange rates are from Datastream.
To compare monthly changes in microfinance and finance stocks, we construct original capitalization-weighted indices for both the microfinance and the financial sectors. We proceed in the following way. First, for each country we create a local microfinance return index starting when at least one MFI is quoted in that country. These indices take into account reinvested dividends. For comparability, local indices are converted to USD at the same-day exchange rate (sourced from Datastream). Second, we aggregate the local microfinance indices into the Global Microfinance Index (GMI), weighting each stock by its market capitalization. The GMI is defined from January 1990 on. Between January and March 1990 the GMI comprises a single stock, African Bank (South Africa). Subsequent additions take place in April 1990 (Danamon, Indonesia), February 2002 (Capitec, South Africa), and November 2003 (Bank Rakyat, Indonesia). After 2005, microfinance IPOs accelerated and the GMI was adjusted more frequently. At the end of the sample period (December 2010), the GMI is composed of nine stocks from five countries with the following geographic weights: 63% for Indonesia, 18% for South Africa, 13% for Mexico, 4% for Kenya, and 1% for Bangladesh.
14 Available at: http://mba.tuck.dartmouth.edu/pages/faculty/ken.french/data_library.html
The global factors include 23 countries: Australia, Austria, Belgium, Canada, Denmark, Finland, France, Germany, Greece, Hong Kong, Ireland, Italy, Japan, Netherlands, New Zealand, Norway, Portugal, Singapore, Spain, Switzerland, Sweden, United Kingdom, and United States.
Figure 1 charts the movements in the local microfinance indices (in local currency), each normalized to 100 at its starting date. Importantly, the South African index experienced such exceptional growth over the period that a different scale is needed to represent its change (axis on the right side of Figure 1). Figure 1 also charts the change in the GMI (in USD). This graph should be interpreted with caution at the beginning of the sample period because of the lack of geographical diversification.
< Insert Table IV here >
Table IV presents monthly descriptive statistics for all microfinance indices. The annualized profitability of national indices ranges from 11% for Indonesia since 1990 to 58.8% for Kenya (over a short period, since 2006). Owing to the diversification effect, national microfinance indices present lower dispersion than the MFIs themselves. However, because the indices remain weakly diversified, their volatilities are higher than those of traditional emerging indices (from 34.7% for Mexico to 78.1% for South Africa, compared with the equivalent MSCI emerging indices, for which volatility ranges from 20.6% for South Africa to 35.9% for Indonesia). Extreme risks are also much higher: skewness is highly positive (from 0.39 for Bangladesh to 6.59 for South Africa), as it is for individual MFIs (except for the Mexican index, where Compartamos is the only MFI to exhibit left-skewed asymmetrical returns); and kurtosis is very high (up to 74.3 for South Africa) for national microfinance indices, except for Bangladesh and Mexico (which has kurtosis of nearly 3). The GMI index has an average annualized monthly return of 20.3% and volatility of 56%, and more moderate extreme risks (skewness of 0.5 and kurtosis of 5.91).
For the finance sector, we construct local and global indices by mimicking the construction of the microfinance indices. More precisely, in each of the five countries under
consideration, the local finance index is built from the financial stocks belonging to the corresponding MSCI universe, but excluding microfinance. Consequently, at the end of the sample period the local financial indices are composed of stocks from the following numbers of banking institutions: 5 in South Africa, 3 in Kenya, 3 in Indonesia, 11 in Bangladesh, and 2 in Mexico. Again, each index is weighted by market capitalization. The number of financial institutions in Bangladesh is striking. This is because the financial sector is particularly well developed compared with other sectors in that country (Demirgüç-Kunt & Levine, 1999). Bangladesh experienced a major financial sector reform, initiated by the World Bank at the beginning of the 1990s and pursued by the government after 1996, with a view to expanding and diversifying the sector and privatizing national banks (Uddin & Hopper, 2003).
The Global Finance Index Comparator16 (GFI-C) aggregates the five local indices. However, to allow rational comparisons with the GMI, the country weights in the GFI-C are constrained to be those of the GMI. Specifically, the weight of each country in both the GMI and the GFI-C is dictated by the size of its microfinance sector (converted to USD). Interestingly, on the Indonesian stock market the microfinance sector (present since 1990) predates the banking sector (present since 1996). As a result, the GFI-C can be defined only for the period starting in November1996.
Figure 2 presents the changes in the local and global indices. Returns from the traditional financial indices present far lower dispersion than do the microfinance indices: Average annualized monthly returns range from 22.5% for South Africa since 1990 and 33.5% for Kenya since 1991. However, financial indices’ volatility (from 25.9% for South Africa to 51.6% for Indonesia) is much lower than for microfinance indices. These results
16 The Global Finance Index (GFI) provided by MSCI aggregates 21 country indices for the finance sector. It
also apply to the GFI-C index, whose average annualized monthly return (22.5%) is slightly higher than that of the GMI index (20.3%), and with lower volatility (47.5% versus 56%).
3. Joint Movements of the Finance and Microfinance Global Indices
To facilitate comparison of our two global indices, the GFI-C for finance and the GMI for microfinance, a common base was set at December 1996. The graph of daily cumulative returns of the GFI-C and GMI (Figure 3) shows that after a period of great disparity between finance and microfinance, with higher instability for microfinance, a phenomenon of convergence appeared. In fact, the correlation between the GMI and the GFI-C rose from 33% over the first half of the sample period (until December 2003) to 79% during the second half. Volatilities for the two series also differ by sub-period (initially 53% and then 30% for finance, and 76% and 34% for microfinance). The Engle and Sheppard (2001) test for constant conditional correlation confirms the instability of correlations at the 1% level.17
To describe the joint movements of the GFI-C and GMI indices, we adopt DCC-MVGARCH18 modeling (Engle & Sheppard, 2001; Engle, 2002), which enables us to factor in dynamic conditional correlations. This approach is often used to model correlation dynamics between financial series (Kearney & Poti, 2006; Brière & Signori, 2009). Consider daily returns, rt (r1,t,r2,t,...,rk,t)', of k assets. Let us assume that these returns are conditionally normal19 with zero mean and conditional covariance matrix H : t
17 We test the null hypothesis of constant correlation. The test statistic take value 36.47 (p-value = 0). 18 Dynamic Conditional Correlation Multivariate Generalized Autoregressive Conditional Heteroskedasticity. 19 Without normality the results are still valid but with a Quasi Maximum Likelihood Estimation (QMLE)
t
t I
r ~N(0,Ht).
Matrix H can be decomposed as follows: t
t t t
t DRD
H
where R is the conditional correlation matrix andt D is a k-dimensional diagonal matrix of t
which the i-th element is the conditional standard deviation of the return of asset i
hit . Following the conventional approach (e.g., Engle, 2002; Chiang, Jeon, & Li, 2007), the univariate GARCH processes for GFI-C and GMI are modeled using a GARCH (1,1) specification of the form:2 1 , 2 1 , 2 ,t i i it i it i (1)
wherei,iandi are non-negative parameters satisfying i i 1, and the
i t, ’s are sequences of independent and identically distributed random variables, with mean 0 and variance 1.The DCC model proposed by Engle (2002) involves a two-stage estimation of the conditional covariance matrix H . In the first stage, univariate volatility models are fitted for t
each stock return and estimates of the hii,t’s are obtained. In the second stage, stock-return
residuals are normalized:
, it it ii t u h .
In the DCC model, the k k time-varying covariance matrix of
ut denoted byQ tfulfills: 1 1 1 ' ) ' ( ) 1 ( t t t t t t A B E uu Au u BQ Q (2)
where A and B are non-negative parameters satisfyingA B 1. The proper correlation
matrixR is given by: t
2 / 1 2 / 1 )) ( ( )) ( ( t t t t diag Q Q diag Q R
We follow Engle’s (2002) two-step log-likelihood estimation procedure for the DCC. Table III displays the estimates of the univariate GARCH parameters (i,i, andi) and the DCC parameters (A and B). With reference to parameter significance and information criteria, the best model is unambiguously the GARCH (1,1) for both series, which is also the most frequent specification for financial returns.
< Insert Table V here >
The coefficients of the lagged variance and innovation terms are highly significant, which is consistent with time-varying volatility and the appropriateness of the GARCH (1,1) specification. Both GARCH (1,1) univariate processes present a high degree of persistence (long memory), signaled by i i being close to 1, which is even higher for GMI (0.996)
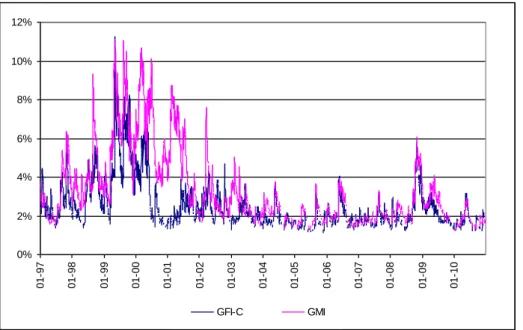
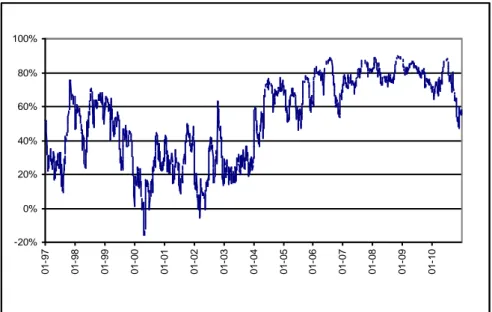
than for GFI-C (0.986). Figure 4 plots the estimated conditional volatilities of both the GMI and GFI-C. Figure 5 plots their conditional correlation.
The volatility of both indices has fallen significantly since the early 2000s. The decline occurred earlier for finance (starting in 2000) than for microfinance (starting in 2002). The rise in conditional correlation between the two sectors is very pronounced over the study period. It occurred mainly between 2003 and 2006, when correlations changed from being highly variable (between -20% and 70%) to much more stable (around 80%). Although the 2000-2001 crisis had little effect on microfinance equities20 they were affected by the 2007-2008 crisis, confirming that the sector is no longer crisis-resilient (Visconti, 2007-2008; Wagner, 2012).
20 Patten, Rosengard and Johnston (2001) also exhibit the good performances of BRI during the East Asian
What caused the convergence between quoted microfinance and mainstream finance? We suggest an interpretation of convergence that combines both sides of the market. First, from the investor’s perspective, convergence could result from a self-fulfilling learning mechanism starting from pre-IPO stock valuations by financial analysts. The literature on IPOs stresses that experts lack information to value companies before they go public (Lowry, Officer, & Schwert, 2010). Likewise, post-IPO prices are very erratic because investors are in a learning process (Lowry & Schwert, 2002). Regarding microfinance, we hypothesize that the lack of information is huge, leaving pre-IPO experts no choice but to base their price estimates on finance stocks or indices. As a result, investors start their learning mechanism on post-IPO microfinance with stock prices linked to financial prices. This self-fulfilling contagious mechanism is fairly common in stock markets.21 Second, from the MFI’s perspective, going public inevitably affects the business model. We conjecture that the changes make MFIs behave more like banks than they did before the IPO. This trend would then reinforce the market-originating contagious mechanism initiated by financial experts.
IPOs probably represent the culmination of the commercialization trend occurring throughout the microfinance sector (Christen & Drake, 2001). This trend is associated in particular with savings mobilization, an activity typical of mainstream banks (Woller, 2002). In sum, both sides of the market offer reasonable arguments to rationalize the convergence process. Interestingly, using different indices, O’Donohoe et al. (2009) also concludes in favor of convergence. The authors locate the main convergence period rather late, in 2008. This can be seen as evidence that convergence is still at work rather than already achieved.
21Tsai and Lee (2012) put forward a similar convergence mechanism for Asian real estate investment trust
(REIT) markets. It happens to converge toward the US REIT market although the underlying real estate securities in different countries are poorly related.
Regardless of the precise date of convergence, the reduction in volatilities at the aggregate level is probably due to the diminishing weight of recent IPOs in our two indices.
Is convergence between quoted microfinance and mainstream finance associated with mission drift, meaning the social aim was sacrificed to the financial bottom line? We address this issue by presenting social characteristics of listed MFIs over time in two different ways. In both cases, we acknowledge the existence of time- and country-specific effects by normalizing the characteristics of the listed MFIs by their same-year same-country averages.
First, Figure 6 shows the changes in the three normalized social performances (average loan size, interest rate on loans, and share of female borrowers) averaged over the available quoted MFIs. Due to data normalization, a unit value indicates that listed and non-listed MFIs exhibit the same performance. Regarding the share of female borrowers, mission drift is suspected if listed MFIs systematically serve fewer women than non-listed MFIs do. After 2002, the normalized share of female borrowers stays consistently below unity, suggesting the possible emergence of gender-related mission drift. This may be due to the fact that women are poorer than men on average, and tend to borrow smaller amounts (D’Espallier, Hudon, & Szafarz, 2013).22 Average loan size appears to be slightly larger for listed MFIs than for non-listed ones. However, the figure has dropped since 2009 and has even become smaller than one. The changes in loan interest rates are less clear-cut. In 1999 and 2005 the value peaked above 2 and above 1.5 respectively, which are very high levels considering that we use a relative measure. For instance, a value of 2 means that the average listed MFIs charged an interest rate twice the size of that charged by the average non-listed MFIs.
However, the evolution of social performances featured in Figure 6 with respect to the calendar time axis can be plagued by endogeneity. The MFIs that went public may be different from their peers even before their IPOs. To address this concern, Figure 7 frames the
22
D’Espallier, Guérin and Mersland (2011) show that in microfinance, women are also better credit risks than men.
time scale in such a way that the IPO takes place in year 0 for all listed MFIs (so time -1 is the year preceding the IPO, +1 is the year following the IPO year, and so on). We then build an average pre- and post-IPO graph for each social characteristic. This allows us to capture the changes in these characteristics that occur around the IPO (from five years beforehand until five years afterwards). Figure 7 suggests evidence of mission drift regarding the share of female borrowers. For average loan size, the picture is less clear. The indicator varies enormously, preventing us from drawing firm conclusions on mission drift. For instance, in year +3 the average loan size is slightly below 1, but in year +4 it rockets back above 2. More consistently, the interest rate charged to borrowers remains close to 1 around the time of the IPO (from -2 to +2) but then steadily increases afterwards, which could indicate a delayed and relatively weak form of mission drift associated with interest rates. These results are reminiscent of those obtained by D’Espallier, Hudon and Szafarz (2014). Analyzing the impact of subsidies in microfinance, the authors show that MFIs facing adverse financial circumstances—i.e., subsidy uncertainty—prefer to charge higher interest rather than increase average loan size. This may be because average loan size is the leading social performance indicator used by subsidy providers and other experts in the field.
Overall, both approaches deliver the same message, namely that IPOs seem to be associated with a decline in the share of women borrowers. Regarding average loan size and borrower interest rates, data variability prevents us from detecting any regularity. More generally, addressing mission drift with our dataset is challenging for several reasons. First, there are different social characteristics, and their relative importance varies not only across MFIs but also across regions (D’Espallier, Guérin, & Mersland, 2013). Second, we have only yearly data for social performances, which contrasts sharply with the daily market prices we used to detect convergence. Last, as Table 1 shows, statistically significant differences on social performances are difficult to capture due to high dispersion in the data.
In conclusion, the microfinance sector has been trending towards gradual integration into mainstream finance. However, it has retained some specific traits. Microfinance tends to develop in countries where the financial sector is relatively weak (Maksudova, 2010; Vanroose & D’Espallier, 2013),23 such that the regional distribution of listed MFIs differs from that of the traditional financial sector. From this point, although the two sectors are converging, the potential for microfinance to provide diversification in an equity portfolio can be distinguished from the diversification potential of finance by regional bias. Section 4 considers the nature of risks assumed by domestic and international investors in finance and microfinance equities.
4. Risk Factors of Microfinance Investment
The profitability of the microfinance sector is hotly debated.24 For instance, Cull, Demirgüç-Kunt and Morduch (2009) state that: “The evidence suggests that investors seeking pure profits would have little interest in most of the institutions that are now serving poorer customers” (p. 169). Schmidt (2010) is even more pessimistic about the potential for profitable investment in microfinance: “(...) I fear that the high expectations regarding the return on an investment in MFIs, which I consider to be exaggerated, will have a negative
23
However, Hermes, Lensink and Meesters (2009) note that MFIs are more efficient in countries with more highly developed financial sectors. Besides, barriers to banking activity vary considerably across countries (Beck, Demirgüc-Kunt, & Martinez Peria, 2008).
24 Using data from Eastern Europe and Central Asia, Caudill, Gropper and Hartaska (2009) show that larger
impact on activities in the microfinance sector (...)” (p. 125).25
In this section, we revisit the issue by investigating the sensitivity of both microfinance and finance stock returns to market and foreign-exchange risks. We use financial asset-pricing models to assess the impact of risk properly. The basic Capital Asset Pricing Model (CAPM) proposed by Sharpe (1964) and Lintner (1965) is a single-factor model in which the risk associated with an individual security is measured by its contribution to market risk. Extensions of the CAPM have been introduced to account for risk factors that go beyond market risk. The multifactor models introduced by Fama and French (1993) and Carhart (1997) are amongst the most successful. In addition to the market factor, the Fama-French-Carhart (FFC) model uses three risk factors: “size,” which relates to firm size; “value,” which exploits the book-to-market ratio; and “momentum,” which reflects the possible persistence of past returns.
We analyze two perspectives in turn. First, we consider the situation of a domestic investor in a country where microfinance equity is available. Second, we take an international investor contemplating sector-wise investment in finance and microfinance indices. To address the domestic investor’s situation, we estimate a CAPM-type model in local currency including two factors: the market factor and a foreign-exchange factor.26 Owing to the unavailability of interest rate data for Bangladesh, the following model is estimated for four countries (Indonesia,27 Kenya, Mexico, and South Africa):
25 Other opinions are more favorable. For instance, Dieckmann (2007) says: “Apart from poverty alleviation,
microfinance offers stable financial returns over the economic cycle, low loan portfolio default rates and potentially low correlations to mainstream capital markets” (p.19).
26
Crabb (2004) stresses that foreign-exchange remains an important source of risk for MFIs, which are exposed to the devaluation of their funding sources. Value, size and momentum factors are unavailable for the countries under study.
27 However, we use pure foreign-exchange exposure against the USD rather than a trade-weighted index of
t k t FX FX k t MRP MRP k t f ik t r R R R , ) , , ( (3)
where Rtik is either a stock return or the return on an index (domestic finance or microfinance) in country k, RMRPk is the local excess return of the market in country k and RFXk is the
exchange rate return in country k (USD versus domestic currency).28 All returns are monthly and expressed in domestic currency.
To address the international investor’s situation, we estimate the FFC model for individual microfinance and finance stocks as well as for GMI and GFI-C indices.29 This four-factor model entails: market, size, value and momentum. We estimate the corresponding factor loadings MRP,SMB,HML,and WML from the following specification:
t t WML WML t HML HML t SMB SMB t MRP MRP t USD f i t USD r R R R R R , , , ) , , , , ( (4)
where RUSDi ,t is either a stock return or an index (domestic microfinance, domestic finance,
GMI, or GFI-C) return. RMRP,t, RSMB,t, RHML,t, RWML,t are respectively the market size, value
and momentum factors, respectively.30 All returns are monthly and expressed in USD.
28 In June 2010 Indonesia imposed controls to restrict capital outflows. The other currencies under consideration
are traded freely.
29 Unfortunately, a four-factor analysis is unfeasible at the country level because the FFC factors are unavailable
for the emerging countries under scrutiny.
30 The market factor, MRP (Market Risk Premium), is the global excess return of the market (value-weighted
return of 23 country indices) over the risk-free rate (one-month US Treasury Bills). The size factor, SMB (Small Minus Big), is the return on an international portfolio of small stocks (bottom 10% in terms of market capitalization) minus that of a portfolio of big stocks (top 90% capitalization). The value factor, HML (High Minus Low), is the return of a portfolio made of “value” stocks, i.e. those with high (top 30%) book-to-market ratio (book value of common equity divided by the market equity) minus that of a portfolio of “growth” stocks
< Insert Table VI here >
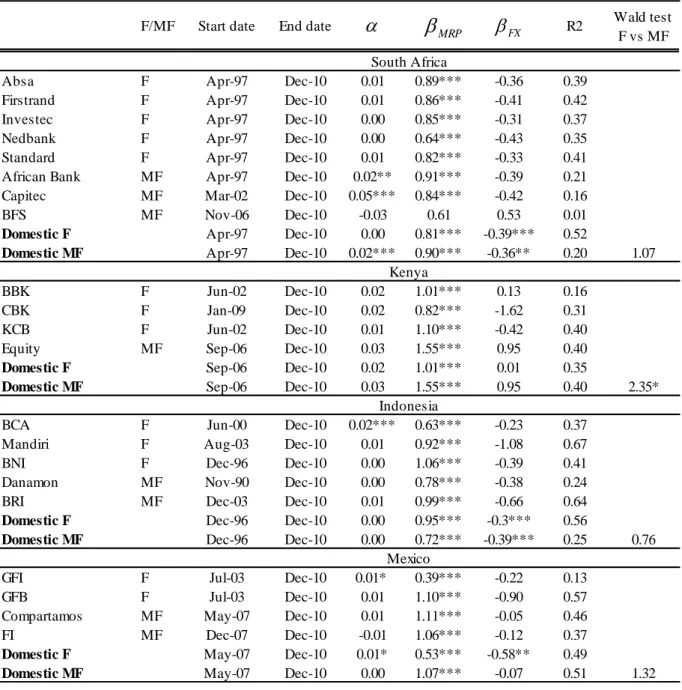
Table VI presents the local CAPM estimation results for the stock- and country-specific regressions given by Eq. (3), and the outcomes of Wald tests for equality of the beta coefficients between domestic finance and microfinance. Most intercepts are not significantly different from zero. With a single exception (BFS in South Africa), the loadings on the domestic market factors are all significant, both for microfinance and for finance stocks, lying between 0.63 (Indonesia) and 1.55 (Equity in Kenya) for microfinance, and between 0.39 (Gfinbur in Mexico) and 1.10 (Commercial Bank in Kenya, and Gfnrote in Mexico) for finance. In general, market betas are higher for microfinance than for finance, signaling a higher systematic risk for MFIs than for traditional banks. However, the difference is hardly significant. The only borderline exception is Kenya, where microfinance exhibits a smaller market beta (0.72) than finance (0.95), the difference being significant at the 10% level. For all countries, R-squared values are relatively low (between 19% for South African microfinance and 55% for Indonesian finance), which is a typical feature of market beta estimation in emerging countries (Harvey, 1995).
Exposure to the currency factor produces the intuitively expected result: Betas are negative in most cases. However, many of them are not significant, at least at the stock level. Interestingly, at the sector level, three out of four currency betas are significant for finance and two out of four for microfinance. Banks and MFIs often fund their portfolios through debt in foreign currency, especially USD (Crabb, 2004). When the dollar appreciates, financing becomes more expensive but the institutions’ revenues (from repayment of loans contracted in
(bottom 30% book-to-market ratio). The momentum factor, WML (Winners Minus Losers) is the return of a portfolio of best-performing stocks (top 30%) minus that of a portfolio of worst-performing stocks (bottom 30%) over the previous year.
local currency) remain fixed, thus penalizing them. Only a few MFIs are not exposed to foreign-exchange risk, either because they operate in a fully dollarized economy, or because they solely trade in local currency. Foreign-exchange betas are not significantly different for the finance and microfinance sectors, meaning that the two types of institution share similar exposures.
< Insert Table VII here >
Table VII provides the international FFC estimation results. The factor loadings (market, size, value and momentum) are estimated based on Eq. (4). As a robustness check, we estimate the FFC regression for the global finance and microfinance indices. The results reveal that, except for Bangladesh, most market betas are significant and higher than the beta for both microfinance and finance. This likely reflects the higher systematic risk of equity from emerging countries compared with a well-diversified world portfolio balanced between emerging- and developed-market stocks. Market betas are higher for microfinance than for finance. In South Africa, the HML factor loading is positive and strongly significant for finance stocks but mostly insignificant for microfinance ones. This is in line with the observation from the report by O’Donohoe et al. (2009, p. 33) indicating that quoted microfinance “trades at a premium on a P/BV basis over traditional banks, though this premium has declined considerably since its peak in November 2007.” The size and momentum betas exhibit little regularity. Except for Mexico, the Wald tests detect no difference between estimates for finance and microfinance stocks.
Summing up, both the finance and the microfinance sectors exhibit high market betas, locally and globally. Moreover, domestic investors in both sectors are significantly exposed to
foreign-exchange risk. Lastly, that microfinance is converging towards mainstream finance is confirmed by the proximity of their market and foreign-exchange betas in domestic markets.
5. Diversification Benefits
Spanning tests examine whether including an external asset in a portfolio of benchmark assets shifts the pre-existing efficient frontier to the left. Here, we use the mean-variance spanning test31 proposed by Huberman and Kandel (1987) to assess the diversification benefits of microfinance stocks for optimal portfolios of financial stocks. This test involves running OLS regressions of the returns of the external asset, R , on the returns of the K benchmark assets, E
, 1, , k B R k K, as follows: , , 1 K k E t k B t t k R R
(5)Under the null hypothesis of spanning, constant is equal to zero and the sum of the k coefficients is equal to one.
We consider two different scenarios. The first, and most general, concerns the situation of a U.S. investor whose pre-existing portfolio consists of financial stocks from the 21 countries represented in the MSCI Global Finance Index (GFI). We successively check whether each country’s microfinance stocks and our global microfinance index (GMI) are spanned by this universe. Second, we assess the diversification benefits of microfinance
31 An alternative option is to use mean-variance efficiency tests (Basak, Jagannathan, & Sun, 2002; Brière, Drut,
Mignon, Oosterlinck, & Szafarz, 2013), but this would involve examining portfolios with given proportions of microfinance stocks.
stocks for national portfolios. In each country where microfinance stocks are available, we consider the situation of a domestic investor and contemplate the possibility of adding each local microfinance stock to a pre-existing portfolio composed of local financial stocks only.
< Insert Table VIII here >
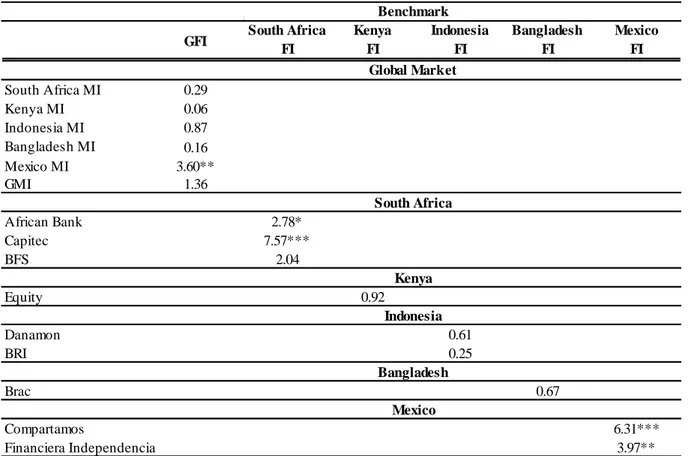
Table VIII reports the F-statistics for the spanning tests for 6 different markets (1 international, 5 domestic). Overall, mean-variance spanning is rejected, indicating the lack of diversification opportunities provided by microfinance. Mexico is the main exception to this rule. Mexican microfinance stocks do indeed provide diversification benefits both to domestic investors in financial stocks and to U.S. investors in the GFI index. Mirchandani and Connell (2009) point out that microfinance stocks underperformed their country indices during the recent financial crisis. This underperformance was more pronounced in Mexico than elsewhere. Some South African MFIs (mainly Capitec) also offers diversification opportunities, but only to domestic investors. The evidence of diversification benefits for South Africa is thus frail.
Interestingly, these results contrast with previous ones from Galema et al. (2011), who find stronger evidence of diversification benefits from microfinance. Those differences could be due to at least two methodological discrepancies. First, we use monthly stock prices whereas Galema et al. (2011) use annual returns computed from book earnings. The authors do so to consider a large set of investment opportunities in the microfinance sector. In practice, however, these opportunities are hard to seize as they mostly stem from non-quoted institutions. Second, the sample period used by Galema et al. (2011) stretches from 1997 to 2007, which means that their data are more deeply affected than ours by the pre-convergence
period. The convergence of microfinance on mainstream finance makes the sector less appealing to investors blind to poverty alleviation.
Still, our findings should not be taken at face value for several reasons. First, quoted microfinance stocks are present in five emerging countries only. The global capitalization of these five is negligible with respect to the world market (0.1%) and represents a small fraction of the emerging market universe (12.4%). Second, the distributions of the test statistics have been established asymptotically under the assumption that returns are normal, which is far from being verified in our dataset. Given this evidence, conclusions need to be drawn in a conservative way.
Overall, despite data issues that can alter the precision of our results, the central message is unambiguous. Considering microfinance as a separate sector yields few diversification benefits, if any, for a portfolio holder invested in finance stocks.
6. Conclusion
Despite the impressive development of the microfinance sector, the financial performance of microfinance equity is poorly understood. This is probably due to data availability issues. Although suffering from data limitations, this paper takes full advantage of daily quoted prices of microfinance stocks since their issuance, and draws a global picture of worldwide microfinance equity. Two main messages stand out. First, we have demonstrated that microfinance had largely converged on the mainstream financial sector. This is consistent with the evidence that the MFIs that issue stocks are those that behave most like banks without really intending to serve the poorest of the poor (Cull, Demirgüç-Kunt, & Morduch,
2007). Although the situation is far from homogenous across countries, the picture that emerges from factor analysis is consistent with the convergence outcome. Moreover, we have confirmed the intuition that MFIs and banks are both highly exposed to exchange rate risk, probably because they obtain most of their funding from international capital markets.
Second, spanning tests show that the diversification potential of microfinance stocks within the financial sector is minimal. Microfinance equity may be disregarded at virtually no cost by profit-oriented investors seeking new investment opportunities in developing countries. Obviously, this evidence does not hold for investors who are concerned (even slightly) by social outcomes in general32 and financial access for the poor in developing countries in particular. In this respect, listed microfinance can be a halfway solution between a purely profit-oriented investment and NGO-type financing through donations/subsidies or subsidised loans.
Ultimately, the question is whether the development of listed microfinance is associated with mission drift. Our investigation provides a nuanced answer to that question. Even though interest rates are higher on average, listed MFIs grant loans that are similar in size to those of other MFIs. Our results also suggest that the convergence of microfinance and mainstream finance may coincide with a decline in the share of women borrowers, but this evidence requires further confirmation. Overall, this paper delivers an encouraging message, namely that listed microfinance equity still generates significant social performances.
A seminal contribution in many respects, this paper also suffers from econometric drawbacks. The main problem likely relates to the underlying probability distributions of the returns. As the descriptive statistics have amply shown, we are dealing with series that depart
32 Microfinance is now seen as part of a broader asset class called “impact investment” designed to yield both a
financial return and a broader benefit to society (“Impact Investing: Happy returns, the Emergence of a New Asset Class”, The Economist, September 2011).
significantly not only from normality, a common feature of most financial series, but also from the typical heavy-tail distributions that financial econometricians are used to dealing with. Moreover, MFIs have very different size, geographic location, and other characteristics compared with the entire financial sector. Finding a more carefully-matched sample might yield more insights. We therefore view our empirical results as challenging but still preliminary, and we hope they will motivate further studies in this area. Indeed, the quoted microfinance sector is still in its infancy, and a clearer understanding of what drives its performance is likely to emerge with time.
Lastly, emerging financial markets have been documented as a key source of diversification for Western portfolio holders (Bekaert & Harvey, 2003; Quisenberry & Griffith, 2010). However, the optimal composition of portfolios made up of emerging-country stocks remains largely unexplored, especially with respect to their sensitivity to global crises. In this respect, one promising avenue for research is the way sector-specific and/or country-specific investments could help robustify global portfolios (Brière & Szafarz, 2008; Brière, Burgues, & Signori, 2010). For this, adequate sector delineation is a prerequisite. Our paper has also taken steps in that direction.
References
Adam, M.C., & Szafarz, A. (1993). Speculative bubbles and financial markets. Oxford
Economic Papers, 44, 626-640.
Agier, I., & Szafarz, A. (2013). Microfinance and gender: Is there a glass ceiling on loan size?
Ahlin, C., & Lin, J. (2006). Luck or skill? MFI performance in macroeconomic context. BREAD Working Paper N° 132.
Armendariz, B., & Szafarz, A. (2011). On mission drift in microfinance institutions. in B. Armendariz and M. Labie (eds.). The Handbook of Microfinance, World Scientific Publishing, London-Singapore, 341-366.
Ashta, A., & Hudon, M. (2012). The Compartamos microfinance IPO: Mission conflicts in hybrid institutions with diverse shareholdings. Strategic Change: Briefings in
Entrepreneurial Finance, 21, 331-341.
Basak, G., Jagannathan, R., & Sun G. (2002). A Direct Test for the Mean-Variance Efficiency of a Portfolio. Journal of Economic Dynamics and Control, 26, 1195-1215.
Beck, T., Demirgüç-Kunt, A., & Martinez Peria, M.S. (2008). Banking services for everyone? Barriers to bank access and use around the world. World Bank Economic Review, 22, 397-430.
Bekaert, G., & Harvey, C.R. (2003). Emerging markets finance. Journal of Empirical
Finance, 10, 3-55.
Bogan, V.L. (2012). Capital structure and sustainability: An empirical study of microfinance institutions. Review of Economics and Statistics, 94, 1045-1058.
Brière, M., Burgues, A., & Signori, O. (2010). Volatility exposure for strategic asset allocation. Journal of Portfolio Management, 36, 105-116.
Brière, M., Drut, B., Mignon, V., Oosterlinck, K., & Szafarz, A. (2013). Is the market portfolio efficient? A new test of mean-variance efficiency when all assets are risky.
Finance, 34, 7-41.
Brière, M., & Signori, O. (2009). Do inflation-linked bonds still diversify? European
Financial Management, 15, 279–297.
Brière, M., & Szafarz, A. (2008). Crisis-robust bond portfolios. Journal of Fixed Income, 18, 57-70.
Carhart, M.M. (1997). On persistence in mutual fund performance. Journal of Finance, 52, 57-82.
Caudill, S.B., Gropper, D.M., & Hartaska, V. (2009). Which microfinance institutions are becoming more cost effective with time? Evidence from a mixture model. Journal of
Money, Credit and Banking, 41, 651-672.
Chiang, T.C., Jeon, B.N., & Li, H. (2011). Dynamic correlation analysis of financial contagion: Evidence from Asian markets. Journal of International Money and Finance, 26, 1206-1228.
Christen, R.P., & Drake, D. (2002). Commercialization: The new reality of microfinance, in D. Drake and E. Rhyne (eds.). The Commercialization of Microfinance: Balancing
Business and Development. Kumarian Press, Bloomfield, 2-22.
Copestake, J. (2007). Mainstreaming microfinance: Social performance management or mission drift?. World Development, 35, 1721-1738.
Crabb, P.R. (2004). Foreign exchange risk management practices of microfinance institutions.
Journal of Microfinance, 6, 51-63.
Cull, R., Demirgüç-Kunt, A., & Morduch, J. (2007). Financial performance and outreach: a global analysis of leading microbanks. Economic Journal, 117, 107–133.
Cull, R., Demirgüç-Kunt, A., & Morduch, J. (2009). Microfinance meets the market. Journal
of Economic Perspectives, 23, 167-192.
Cull, R., Demirgüç-Kunt, A., & Morduch, J. (2011). Does Regulatory supervision curtail microfinance profitability and outreach? World Development, 39, 949-965.
De Mariz, F., Reille, X., & Rozas, D. (2011). Discovering Limits: Global Microfinance Valuation Survey 2011. J.P. Morgan and CGAP, July.
Demirgüç-Kunt, A., & Levine, R. (2001). Bank-based and market-based financial systems: Cross country comparison. Working Paper, World Bank.
De Roon, F.A., Nijman, T.E., & Werker, B.J.M. (2001). Testing for mean-variance spanning with short sales constraints and transaction costs: The case of emerging markets. Journal of
Finance, 56, 721-742.
D’Espallier, B., Guérin, I., & Mersland, R. (2011). Women and repayment in microfinance: A global analysis. World Development, 39, 758-772.
D’Espallier, B., Guérin, I., & Mersland, R. (2013). Focus on women in microfinance institutions. Journal of Development Studies, 49, 589-608.
D’Espallier, B., Hudon, M., & Szafarz, A. (2013). Unsubsidized microfinance institutions.
Economics Letters, 120, 174-176.
D’Espallier, B., Hudon, M., & Szafarz, A. (2014). Microfinance and subsidies: Does aid uncertainty trigger mission drift? CERMi, mimeo.
Di Bella, G. (2011). The impact of the global financial crisis on microfinance and policy implications. Working Paper, International Monetary Fund.
Dieckmann, R. (2007). Microfinance: An emerging investment opportunity. Research Paper, Deutsche Bank.
Dorfleitner, G., Leidl, M., & Reeder, J. (2012). Theory of social returns in portfolio choice with application to microfinance. Working Papers in Business, Economic and Management Information Systems 455, University of Regensburg.
Drut, B. (2010). Social responsibility and mean-variance portfolio selection. Working Paper, 2010-03, Economix, Université de Paris Ouest-Nanterre.
Engle, R.F. (2002). Dynamic Conditional Correlation – A simple class of multivariate GARCH models. Journal of Business and Economics Statistics, 20, 339-350.
Engle, R.F., & Sheppard, K. (2001). Theoretical and empirical properties of dynamic conditional correlation multivariate GARCH. Discussion Paper, Department of Economics University of California San Diego.
Fabozzi F.J., & Francis J.C. (1977). Stability tests for alphas and betas over bull and bear market conditions. Journal of Finance, 34, 1243-1250.
Fama, E.F., & French, K.R. (1993). Common risk factors in the returns on stocks and bonds.
Journal of Financial Economics, 33, 3-56.
Fernando, N.A. (2006). Understanding and dealing with high interest rates on microcredit. Asian Development Bank, Manilla.
Flood, R.P., & Garber P.M. (1980). Market fundamentals versus price level bubbles: The first tests. Journal of Political Economy, 8, 745-770.
Galema, R., Lensink, R., & Spierdijk, L. (2011). International diversification and microfinance. Journal of International Money and Finance, 30, 507-515.
Gonzalez, A. (2007). Resilience of microfinance institutions to national macroeconomic events: An econometric analysis of MFI asset quality. Discussion Paper, Microfinance Information Exchange.
Ghosh, S., & Van Tassel, E. (2008). A model of mission drift in microfinance institutions. Working Paper, Department of Economics, Florida Atlantic University.
Harvey, C.R. (1995). The risk exposure of emerging equity markets. World Bank Economic
Review, 9, 19-50.
Hermes, N., Lensink, R., & Meesters, A. (2009). Financial development and the efficiency of microfinance institutions. Working Paper available at SSRN:
http://ssrn.com/abstract=1396202.
Huberman, G., & Kandel, S. (1987). Mean-variance spanning. Journal of Finance, 42, 873-888.
Hudon, M. (2010). Subsidies and financial performances of the microfinance institutions: Does management matter? Journal of International Development, 22, 890-905.
Hudon, M., & Traca, D. (2011). On the efficiency effects of subsidies in microfinance: An empirical inquiry. World Development, 39, 966-973.
Kearney, C., & Potì, V. (2006). Correlation dynamics in European equity markets. Research
in International Business and Finance, 20, 305-321.
Krauss, N.A., & Walter, I. (2009). Can microfinance reduce portfolio volatility? Economic
Development and Cultural Change, 58, 85-110.
Lowry, M., & Schwert G.W. (2002). IPO market cycles: Bubbles or sequential learning?
Journal of Finance, 57, 1171-1200.
Lowry, M., Officer, M.S., & Schwert G.W. (2010). The variability of IPO initial returns.
Journal of Finance, 65, 425–465.
Maksudova, N. (2010). Contribution of microfinance to financial sector development and growth. Working Paper, CERGE-EI, Charles University, Prague.
Matthäus-Maier, I., & von Pischke, J. (eds.) (2006). Microfinance Investment Funds. Springer, Berlin.
McIntosh, C., & Wydick, B. (2005). Competition and microfinance. Journal of Development
Economics, 78, 271–298.
Mersland, R. (2009). The cost of ownership in microfinance organizations. World