WORKING
PAPERS
SES
N. 455
II.2015
Does preschool boost the
development of minority
children?
The case of Roma children
Christina Felfe
and
Does preschool boost the development of minority children?
The case of Roma children
Christina Felfe* and Martin Huber**
*University of St. Gallen, Dept. of Economics **University of Fribourg, Dept. of Economics
Abstract:
Does universal preschool constitute an effective policy tool to promote the development and integration of children from minority groups? In the light of rising cross border migration and increasing ethnic variation in many developed countries, we address this question for the children of the Roma -the largest and most disadvantaged minority in Europe. To tackle -the issue of non-random selection into preschool, we exploit variation in the individual distance to the nearest preschool facility. Non-parametric instrumental variable estimations reveal significant short-term gains in terms of children’s verbal and analytical skills. Preschool attendance also increases the prevalence of vaccinations, but has no effect on other health outcomes. Overall, it also does not seem to enhance integration measured by language proficiency and peer relations, at least not in the short-run.Key words: universal child care, child development, non-parametric instrumental variable estimation. JEL classification: C14, C21, C26, I10, I21, J13.
We have benefited from comments by Michael Lechner and seminar participants in Bludenz. Addresses for correspondence: Christina Felfe, University of St. Gallen, Varnb¨uelstrasse 14, 9000 St. Gallen, Switzerland, [email protected]; Martin Huber, University of Fribourg, Bd. de P´erolles 90, 1700 Fribourg, Switzerland, [email protected].
1
Introduction
Social, economic, and political exclusion remains an everyday challenge ethnic minorities are facing in modern societies, see Kahanec, Zimmermann, and Zaiceva (2010). Poor knowledge of the language and the cultural habits of the host country are often put forward as the key reason for the ‘vicious circle of exclusion and poverty’. As a consequence, numerous international policy documents have suggested providing minorities with unlimited access to the education system of the host country, in particular to the early education system. The focus on early education is due to the findings of recent research showing that the returns to early life interventions are orders of magnitude larger than the returns to similarly costly measures later in life, see Heckman and Masterov (2007) among others. Most of this research, however, focuses on interventions targeting the specific needs of children from disadvantaged backgrounds. Whether untargeted programs, such as universal preschool, carry any beneficial effects for these children is unclear. We therefore ask the question whether participation in universal preschool helps boosting the development of children belonging to one of the largest and most disadvantaged minorities - the Roma (O’Higgins 2013). The estimated number of the Roma population in Europe lies somewhere between ten and twelve million people, see Br¨uggemann (2012). Recent regime changes in many Central and Southeast European countries - the main countries of residence of the Roma - and the enlargement of the European Union have led to large inflows of Roma into the older member states. Integrating this minority group represents a serious challenge: about 90 % of Roma households live below national poverty lines, less than one third works in paid employment, only 15 % of young Roma adults complete upper-secondary schooling and even more worrisome up to 37 % of Roma lack primary education and thus the basic skills in reading and mathematics (Br¨uggemann 2012).
To permit a more rigorous analysis as base for an appropriate design of policies, the United Nations Development Programme (UNDP), the World Bank (WB), and the European Commission (EC) have recently conducted the first cross country survey on Roma - the so-called UNDP/WB/EC Regional Roma Survey. The survey collected basic socio-economic data on households as well as individual household members in twelve countries of Central and Southeastern Europe. A specific module on early childhood education provides furthermore information on children’s health, children’s cognitive and non-cognitive development as well as children’s participation in preschool. Hence, this survey allows for the first time assessing the effects of preschool attendance on the development and integration of Roma children.
Identification of the causal effects of preschool attendance on child outcomes is challenging. Sending a child to preschool is likely to be confounded with further integration efforts of parents which are not easily measured. In addition, preschools may select children based on information that is not readily observed by the econometrician. Empirical analyses that merely contrast children with preschool exposure to children
without preschool exposure are thus likely to be plagued by identification problems due to endogeneity. We tackle this issue as follows. The UNDP/WB/EC Regional Roma Survey contains detailed information on the household and the neighborhood the household lives in, among other things the distance to the nearest preschool. The neighborhood is obviously an important determinant of children’s development and thus variation in preschool availability across neighborhoods is unlikely to be exogenous for children’s preschool attendance. Variation conditional on neighborhood (and household) characteristics, however, is arguably a more promising source of exogenous variation. Our identification strategy therefore relies on the individual distance to the nearest preschool as an instrument for preschool attendance while controlling for features of the household, the household head, and the neighborhood, as well as regional fixed effects. We implement this strategy using a fully non-parametric instrumental variable estimator, namely the inverse probability weighting (IPW) approach discussed in Fr¨olich (2007).
Our results reveal significant returns to preschool attendance in terms of verbal and analytical skills. To be more precise, when attending preschool Roma children are 30.4 percentage points (ppts) more likely to know ten letters of the alphabet, 23.8 ppts more likely to read at least four popular words, and 22.2 ppts more likely to write their own name. In addition, they are 41.8 ppts more likely to recognize the symbols for the numbers one to ten. When attending preschool Roma children are also 21.7 ppt more likely to be vaccinated. There are, in contrast, no (short term) gains in any further health outcomes. Neither do we observe any improvements in important measures of integration, namely proficiency in the local language or relations to peers.
An increasing body of research discusses the effects of universal preschool on children of the majority population and finds mostly neutral or positive effects (e.g. Baker, Gruber, and Milligan 2008, Berlinski, Galiani, and Gertler 2009, Cascio 2009, Drange, Havnes, and Sandsor 2014, Felfe, Nollenberger, and Rodriguez-Planas 2012, Fitzpatrick 2008, Gormley Jr., Phillips, and Gayer 2008, Havnes and Mogstad 2011, Magnuson, Ruhm, and Waldfogel 2007). In addition, there is a large literature that focuses on the effects of preschool interventions targeted at disadvantaged children. Targeted interventions have demonstrated strong beneficial impacts on the development of participating children. For an overview, see Blau and Currie (2006) or Heckman and Masterov (2007). It is, however, leass clear whether widely accessible or universal child care programs (which are meant to provide care to any child) are appropriate for children with specific needs, such as those from disadvantaged backgrounds or minority groups. To the best of our knowledge, the evidence on the impact of large-scale programs on children from minority groups is rather scarce. In the US American context, there are a couple of studies focusing on the effects of the Oklahoma’s universal pre-kindergarten (pre-K) program on the development of children from different ethnic groups ( Gormley, Gayer, Phillips, and Dawson 2005, Gormley and Gayer 2008). In the European context, there exist a few studies investigating the returns to public preschool on immigrant children’s development. Drange and Telle (2010) analyze the introduction of free preschool at age five in Norway and
find beneficial effects on girls’, but not on boys’ school performance. Dustmann, Raute, and Schoenberg (2013) analyze the consequences of a staggered expansion in child care facilities in Germany and find that longer public child care attendance strongly and robustly reduces language and motor skill problems and improves overall school readiness for children of immigrant ancestry.
Our paper contributes to the existing literature in at least two dimensions. First, it is the first paper addressing the question whether universal preschool constitutes a successful tool to boost the development of children of the Roma - one of the largest and most disadvantaged minorities in Europe. Second, the existing studies have mostly relied on alternative parametric methods exploiting expansions in public child care. In contrast, we employ a non-parametric instrumental variable method using distance to the nearest preschool as an instrument for attendance. Importantly, this approach allows for non-linearities and effect heterogeneity.
The remainder of the paper is structured as follows. The next section provides a brief overview of the preschool system in the countries under study. Section 3 introduces the data. Section 4 discusses the identification and the estimation framework. Section 5 presents our results and several robustness checks. Section 6 concludes.
2
Background
This section provides a broad overview of the early child care systems in Europe and gives some institutional details of early child care provision in the countries under study.1
Early child care covers children who are between zero and six or seven years old, the age when primary school becomes mandatory. It is usually provided in care centers run by either a public or a private entity. Such centers operate mostly separately for younger and older children - the age break is usually around 3 years old: the care centers for younger children are called nurseries, those for older ones kindergarten or preschool. In what follows, we only refer to preschool, as we do not consider children younger than 3 in our analysis.
To comply with the goals put forward by the European Union’s Presidency in 2002 - ‘to provide child care by 2010 to at least 90% of children between 3 years old and the mandatory school age and at least 33 % of children under 3 years of age’ (EU 2002) - most European countries have committed themselves to provide a preschool slot to all children, either by establishing a legal entitlement to a slot in preschool or by making attendance compulsory for at least the last pre-school year. Among the countries under study, however, only Hungary entitles children with a claim on a slot in preschool from the age of 3 onwards. In
1
All details about the early child care system are taken from EuropeanCommission, EACEA, Eurydice, and Eurostat (2014) or are based on the data set used in this paper - see Section 3 for details on the data.
the Czech Republic, there exists a legal claim from age 5 onwards. In Bulgaria, Hungary, Moldova and Serbia, attendance is compulsory in the last year prior to primary school.
Average preschool attendance among children who are 3-6 years old varies substantially across the countries under study. In line with the legal setting, it is highest in Hungary, where almost 90 % of all children aged 3-6 attend preschool. Attendance rates are also high in Bulgaria, the Czech Republic, and Romania (almost 80 %), and in Slovakia and Moldova (around 70 %). Still more than half or roughly half of all 3-6 years old children go to preschool in Albania (62 %), Croatia (57 %), and Serbia (48 %). Yet, in the remaining countries, Macedonia, Montenegro, and Bosnia and Herzegovina, preschools are only rarely frequented: in the case of Macedonia only around one third of all children aged 3-6 attend preschool, while in the latter two countries only around one fifth does so.
Preschools are nowadays not only a place where children are taken care off, but rather an institution where children are taught the skills needed for primary school. For this reason, many governments issue of-ficial educational guidelines to help preschools meeting this goal. Ofof-ficial objectives are to support children to develop personal, emotional, and social skills as well as language and communication skills. Moreover, preschools engage in physical and health education. In the year prior to primary school, preschools focus on fomenting children’s literacy and numerical and logical reasoning, as well as adapting children to school life.
3
Data
In 2011 the United Nations Development Program, the World Bank, and the European Commission conducted a cross country survey of the Roma - the so-called UNDP/WB/EC Regional Roma survey 2011. It is unique in the sense that it is representative for the Roma population in all areas with a higher concentration of Roma than the respective national average in the following twelve Central and Southeast European countries: Albania, Bosnia and Herzegovina, Bulgaria, Croatia, Czech Republic, Hungary, Macedonia, Montenegro, Republic of Moldova, Romania, Serbia, and Slovakia.
The survey was conducted in a three stage random representative sampling process: first, 110 random clusters of approximately 30 households from areas with an above average concentration of Roma were selected; second, in each cluster, seven households were randomly chosen and the respective head of the household, or the person that proved to be the most knowledgeable, answered questions about the household; third, one random household member older than 15 years was selected to answer a battery of questions on status and attitudes. In addition, the primary caregiver of all children below school age answered questions of a special module on early childhood education and care (ECEC). In each country, the survey interviewed about 750 Roma households and additionally 350 non-Roma households, living in
close proximity to the Roma households.
We restrict our sample to the Roma population only, to children at preschool age (3-6 years old), and to households which have not moved during the previous five years (which is the case for more than 95%). The latter restriction guarantees that the children under study have at least some time and chance to attend preschool in the location of residence. We furthermore drop all observations lacking information on the outcome variables provided by the ECEC module (cognitive and non-cognitive development measures). Given these restrictions, our baseline sample contains 3,334 Roma children at preschool age (4.5 years old on average). Information on children’s health is contained in the main survey and thus is provided by the household head who is likely to be less informed about children’s development than the primary caregiver, who answers the questions contained in the ECEC module. As a results, our sample shrinks when analyzing health-related outcomes (2,478 observations). For descriptive comparisons we also draw upon 569 non-Roma children who live in close vicinity to the Roma households. These non-Roma children are exposed to the same public infrastructure and neighborhood conditions as their Roma peers. Table 1 provides descriptive statistics of the key variables for non-Roma and Roma children, as well as for Roma children with and without preschool exposure.
Despite living in the same neighborhood, Roma children still come from more disadvantaged back-grounds than non-Roma children. For instance, the representative household head of a Roma household, who is most likely the father, possesses less education than that of a non-Roma household: 85.2 % of all non-Roma fathers have secondary education while only 45.0 % of all Roma fathers do so. Roma house-holds are also larger than non-Roma ones: the latter have on average 4.9 members, the former 6.2 mem-bers. Moreover, even if Roma and non-Roma children live in the same municipality, a substantial fraction of Roma children lives in worse conditions than non-Roma children: a considerable share of the latter live in either apartments (15.1 %) or newer houses (29.0 %), while many Roma children live in ghettos or slums (35.1 %). In addition, Roma children are also more likely to live in neighborhoods with a Roma majority and poor public transportation (64.8 % versus 14.8 % and 39.96 % versus 30.06 %, respectively). Already at preschool age, we observe a substantial development gap between Roma and non-Roma children. The latter know the regional language much better than the former (84.2 % versus 71.4 % understand the local language), are more likely to name ten letters from the alphabet (56.8 % versus 29.8 %), are more likely to write their own name (43.1 % versus 19.1 %) or to read four popular words (37.1 % verus 17.5 %). Non-Roma children also have better analytical skills: they are more likely to recognize numbers between one and ten (70.3 % versus 41.7 %). Furthermore, they are more self-confident (92.1 % versus 79.9 %) and better integrated among their peers (95.1 % versus 88.4 %). Finally, non-Roma children enjoy slightly better health, suffer less often from longstanding illnesses (3.4 % versus 5.4 %), and are more likely to be vaccinated (95.3 % versus 83.2 %). The described differences between Roma and non-Roma children are all significant at least at the 5 % level.
Table 1: Descriptive Statistics on Key Variables
Non-Roma Roma Diff. Roma Preschool No Preschool Diff. Preschool Panel A: Child outcomes
Understand language (d) 0.842 0.714 -0.127*** 0.837 0.660 0.177*** Name 10 letters (d) 0.568 0.298 -0.269*** 0.506 0.206 0.300*** Write name (d) 0.431 0.191 -0.239*** 0.378 0.108 0.270*** Read 4 words (d) 0.371 0.175 -0.196*** 0.335 0.103 0.232*** Recognize numbers 1to10 (d) 0.703 0.417 -0.286*** 0.655 0.310 0.345*** Selfconfidence (d) 0.921 0.799 -0.122*** 0.894 0.757 0.138*** Peer relation (d) 0.951 0.884 -0.067*** 0.950 0.855 0.095*** Health (1 to 5,bad to good) 4.541 4.343 -0.198*** 4.340 4.344 -0.004 Longstanding illness(d) 0.034 0.054 0.020** 0.044 0.058 -0.014* Limited by health (d) 2.933 2.912 -0.021 2.928 2.905 0.023 Vaccination card (d) 0.953 0.832 -0.121*** 0.870 0.815 0.056** Panel B: Family characteristics
Age of child (years) 4.448 4.452 0.004 4.966 4.222 0.744*** Child is a boy (d) 0.499 0.508 0.009 0.504 0.510 -0.006 Hh head: second. educ.(d) 0.852 0.450 -0.402*** 0.576 0.394 0.182*** Household members 4.852 6.213 1.361*** 5.992 6.312 -0.319*** Home: Appartment (d) 0.151 0.071 -0.080*** 0.081 0.067 0.014 Home: New house (d) 0.290 0.127 -0.163*** 0.145 0.119 0.025 Home: Older house 0.453 0.429 -0.025 0.478 0.407 0.071** Home: slum, Roma camp (d) 0.090 0.351 0.262*** 0.278 0.384 -0.106*** Electricity available (d) 0.974 0.876 -0.099*** 0.903 0.863 0.040** Panel C: Location characteristics
Location: capital (d) 0.202 0.159 -0.043* 0.130 0.171 -0.041 Location: city (d) 0.188 0.157 -0.031 0.138 0.165 -0.028 Location: Majority roma (d) 0.148 0.648 0.500*** 0.601 0.668 -0.067 Distance closest city (km) 2.982 3.088 0.106 3.222 3.026 0.196 Busstop less 1km (d) 0.694 0.604 -0.090** 0.689 0.566 0.123***
Observations 569 3334 1030 2304
Notes: Column ‘Non-Roma’ is the average for all non-roma children, the column ‘Roma’ corresponds to the the Roma sample average, column ‘Preschool’ refers to all Roma children with preschool exposure, and column ‘No Preschool’ refers to all Roma children with no preschool exposure. ‘Diff. Roma’ is the difference between the columns ‘Roma’ and ‘Non-Roma’, ‘Diff. Preschool’ is the difference between columns ‘Preschool’ and ‘No Preschool’. Results of a test of no difference between the respective columns when clustering at the region level are indicated as follows: *** p > 0.01, ** p > 0.05, * p > 0.1.
Do Roma children who participate in the educational system already early in their life outperform those only starting education in primary school? The development gap between Roma children with and without exposure to preschool is substantial: for language skills the gap lies between 17.7 ppts and 30.0 ppts, the gap in analytical skills amounts to 34.5 ppts and concerning personality traits the gap lies between 9.5 ppts and 13.8 ppts. Moreover, Roma children who attend preschool are also more likely to be vaccinated than those who do not (87.0 % versus 81.5 %). Nevertheless, it would be premature to conclude that preschool helps closing the gap between Roma and non-Roma children. Besides the described differences in children’s development, we also observe that Roma children with exposure to preschool stem from more advantaged backgrounds than their Roma peers without preschool exposure. In fact, Roma children who attend preschool resemble non-Roma children much more than Roma children who do not attend preschool. For instance, the household head is more likely to possess secondary education (57.6 % versus 39.4 %), they live in smaller families (6.0 versus 6.3 household members), they are more likely to live in an area which is well connected to public transportation (68.9 % versus 56.6 %), but they are less likely to live in a ghetto-like area (27.8 % versus 38.4%). In other words, the socio-economic family background and the neighborhood are on average more favorable for Roma children who attend preschool. Hence, a simple comparison between Roma children with and without exposure to preschool is likely to overestimate the impact of preschool attendance on children’s development. The next section therefore discusses how we tackle the issue of endogenous selection into preschool.
4
Empirical Framework
This section discusses the causal effect of preschool attendance on children’s development we aim for, the assumptions underlying our identification strategy, and the estimation method.
4.1
Main Effect and Potential Channels
The causal effect of preschool attendance on the development of a child is the (hypothetical) difference between the child’s development when attending and not attending preschool. The effect may work through different mechanisms, for instance through the exposure to the preschool teacher, the pedagogical and stimulating content of the time spent in preschool, and the group of peers. In particular, Roma children might benefit from the contacts to non-Roma children which are likely more frequent than in the case of any counterfactual care mode, i.e. the mother, the extended family, friends or neighbors. Thus, this first set of possible causal channels is likely to exert a positive impact on the development of Roma children. The second set of potential mechanisms is indirect by crowding out alternative care modes. The direction of the crowding out effect depends on the quality of alternative care, which is impossible to judge about.
Yet, at least in terms of host country specific skills as the local language and the cultural capital, preschool exposure is (through contact with the staff and peers) likely to exert an indirect positive effect on the development of Roma children. Third, parents may adjust their parenting style when being in contact to preschool teachers and parents of other children attending the same preschool. This effect may go either way: on the one hand, contact to pedagogical staff or other parents may inspire parents in their parenting methods, on the other hand parents may outsource child care and thus invest less in their children.
In this paper, we focus on estimating the overall impact of preschool. We analyze a variety of different outcomes, which may hint towards potential underlying causal channels. However, disentangling the different mechanisms through which preschool might exert its impact on Roma children lies beyond the scope of this paper.
4.2
Identification
As discussed in Section 3, Roma children with and without exposure to preschool stem from different socio-economic backgrounds. This difference likely arises because the decision to send a child to preschool is not exogenous. First, parents may weight the pros and cons of registering their child in preschool or taking care of them themselves. Furthermore, the decision to register a child in preschool may reflect parents’ knowledge and opinion about the country’s institutions as well as their integration efforts. In addition, preschools may select children depending on their development and their family or ethnic background (even if officially, they are prohibited from doing so by law). The criteria underlying both decision processes - the decision of parents and the decision of preschools - are unlikely to be all measured or observed. Hence, given these unobserved but potentially important dimensions of the preschool decision process, a simple comparison of children enrolled and children not enrolled in preschool (even conditional on observed characteristics) probably results in biased estimates of the impact of preschool attendance on children’s development.
Our identification strategy therefore relies on an instrumental variable (IV) approach. We suggest to use the distance from a child’s home to the closest preschool facility as an IV. To be more precise, we rely on the information provided by the interviewer whether the nearest preschool facility is less than one kilometer away and thus walking distance from the home of the respective household. Related distance-based instruments have frequently been used to assess the returns to college, see for instance Card (1995) and Kane and Rouse (1995). An IV must satisfy particular relevance and validity conditions, at least conditional on a range of observed characteristics. A formal definition of the nonparametric IV assumptions our estimates rely on is given in Abadie (2003), while we subsequently focus on their intuition in the context of our application.
IV relevance requires the first stage of the instrument to be non-zero. That is, there must be some ‘compliers’ among the Roma children in the sense that these children would attend preschool if living close by, but would not do so if living further away. In other words, the IV must shift the decision of at least some parents to register their child in preschool. Availability of a preschool may shape parents’ awareness of the possibility to enroll their child into preschool and thus increase the likelihood of doing so. In addition, living closer to a facility should reduce the costs of attending preschool, at least in terms of transportation costs. In Section 5.1 we provide empirical evidence based on our sample that living closer to a preschool facility indeed (statistically significantly) raises the likelihood of enrolling a child in preschool. At the same time, there should be no ‘defiers’, i.e. there should be no children that do not attend preschool if living close by, but would do so if living further away.2 This assumption appears plausible in our application as it appears hard to think of a reason that could induce those Roma families who would send their children to a distant preschool facility to take them out of preschool altogether once a facility opened up in their vicinity.
IV validity rules out a direct effect of the mere distance to preschool on child outcomes (other than through preschool attendance). It also implies that there is no statistical association between the instrument and any unobservable determinants of preschool attendance and/or the outcomes, at least conditional on observed characteristics. While the absence of an association between the mere distance to preschool and child outcomes seems plausible, the latter restriction appears quite demanding and is discussed in more detail in the remainder of this section. In particular, there may be two concerns with respect to the issue of validity: first, the availability of a preschool might be the result of selective lobbyism of local citizens and second, parents’ location choice might be based on the amenities offered by the neighborhood, such as preschool facilities.
Regarding the first concern, selective lobbyism implies that in areas where the Roma community or members of the majority population put more pressure on the local administration to provide preschool facilities, there are further factors correlated with such lobbying activity that affect also the development of Roma children. We argue that this appears unlikely after controlling for a range of regional and household level characteristics. First of all, even if attitudes or preferences for child care were selective, they are unlikely to change rapidly over time. Hence, controlling for regional fixed effects should capture such unmeasured preferences and local actions. As described in Section 3, our sample is spread over twelve countries, between three and four regions per country (40 regions all together), and up to 113 local clusters (units of 30 households out of which seven are interviewed in our sample) per region. The local clusters are, unfortunately, too small in terms of geographical size and number of observations to exhibit sufficient variation in our distance to preschool instrument. The median number of children included in a local
2
Note that the ‘no defiers’ assumption is implicit in parametric IV models with a homogeneous (or constant) first stage coefficient on the instrument.
cluster in our sample are 5. We therefore rely on the regions as units upon which the fixed effects are defined. On average, there are 156 children per region in our sample (see Table A.1 in the appendix for an overview of the regions included in our sample). In addition, we condition on several features of the local cluster, such as town size, distance to the next bigger city, the availability of public transport, and whether the local majority is Roma, to further tackle selection bias due to local preferences. In addition, we include (Roma) household level characteristics such as household size, education of the household head, and the condition of the dwelling as further controls. This should rule out instrument confounding due the socio-economic status of Roma families, which may affect both local preferences/lobbying and child development. In a sensitivity analysis we extend our set of regional and individual controls even further (see Section 5.2).
Regarding the second concern, the question is whether migration of Roma families is (partly) driven by the provision of preschool facilities (or by other amenities that correlate with education). According to Vlase and Preoteasa (2012), the main driver behind migration of Roma people are employment op-portunities, while the attractiveness of the education system as a whole and thus of the preschool system in particular appears to play a negligible role. In addition, the households included in our sample are (contrary to what the clich´e suggests) rather immobile: only 4.6 % of Roma families had moved into their residence at sampling date within the previous five years, while the vast majority had lived in the same municipality for at least five years. We exclude the few Roma families that moved in the previous five years to guarantee that the Roma children live for a sufficiently long time at the location where the in-strument and preschool state are measured.3 Despite the recent immobility, one may nevertheless argue that migration/residence decisions longer than five years ago could have been endogenous. As for instance argued in Card (1995) (however, in the context of college education), family background may play an im-portant role. We argue that we can tackle this issue by conditioning on the previously discussed set of household characteristics. Including the neighborhood features mentioned before should furthermore help controlling for potential pull factors for previous migration.
Taken together, our IV method essentially relies on variation in the distance to preschool across Roma children living in the same region and sharing similar neighborhood and household characteristics. Condi-tional on the mentioned set of control variables, individual distance to preschool is arguably exogenous, i.e. neither correlated with lobbyism/local preferences, nor Roma families’ location choice and therefore serves as a valid instrument. Under the previous conditions, our approach identifies the local average treatment effect (LATE) of preschool on child development in the subgroup of compliers. Hence, our estimates mea-sure the effects of attending preschool on the development of the marginal child that only starts attending preschool if living close by. Only if we - as it is the case in standard linear IV models - impose the strong
3
Our set of control variables should help mitigating potential selection bias introduced by dropping the small subsample of movers.
assumption of effect homogeneity (i.e. preschool attendance exerts the same effect on everyone), our esti-mated effect would apply to the entire population of Roma children.
4.3
Estimation
This section briefly sketches our IV estimation approach based on inverse probability weighting (IPW) as discussed in Fr¨olich (2007), which is entirely non-parametric. To this end, let Di denote the preschool attendance indicator (i.e. Di = 1 if attending and Di = 0 if not attending) of a particular individual i in our sample of n observations. Zi represents the binary instrument, which takes the value one when individual i lives less than a kilometer away from preschool and zero otherwise. Yicorresponds to one of the child outcomes of interest, while Xi denotes the vector of observed covariates. Finally, let p(Xi) ≡ Pr(D = 1|X = Xi), i.e. the conditional probability to live close to preschool given the observed characteristics, also known as (instrument) propensity score.
Instrument assignment is (given our assumptions) as good as random once we condition on the covari-ates. Instead of conditioning on the covariates directly, we can also condition on the propensity score (see Rosenbaum and Rubin (1983)). In applications using semi- or nonparametric IV methods, controlling for the one-dimensional propensity score is often more feasible than controlling for a multidimensional vector of covariates. In other words, it may not be possible to find observations across instrument states that are comparable in terms covariates for all combinations of covariate values in the data, while finding compara-ble observations in terms of propensity scores is possicompara-ble because distinct combinations of covariates may still yield similar propensity scores. Since the true propensity score is, however, unknown, in practice any propensity score method relies on an estimate of this parameter, denoted by ˆp(Xi). We estimate the latter non-parametrically by local constant kernel regression as discussed in Racine and Li (2004). This method allows for both continuous and discrete regressors and is implemented using the package by Hayfield and Racine (2008) for the statistical software R. We rely on Kullback-Leibler cross-validation (Hurvich, Si-monoff, and Tsai (1998)) to choose the appropriate bandwidth, but test for sensitivity when cutting the bandwidth by half (see Section 5.2). Finally, we estimate the effect of preschool attendance by inverse probability weighting (IPW):4):
Estimated LATE = Pn i=1Yi· Zi/˜p(Xi) − Pn i=1Yi· (1 − Zi)/¯p(Xi) Pn
i=1Di· Zi/˜p(Xi) − Pn
i=1Di· (1 − Zi)/¯p(Xi)
, (1) with ˜p(Xi) = ˆ p(Xi) Pn i=1Zi/ ˆp(Xi) and ¯p(Xi) = 1− ˆp(Xi) Pn
i=1(1−Zi)/(1− ˆp(Xi)) being the normalized propensity scores.
It is worth noting that in contrast to the vast majority of IV applications, our empirical strategy is very
4
To be more precise, we use the normalized sample analogue of expression (11) in Fr¨olich (2007) where the nor-malization guarantees that the weights the observations obtain in the minuends and subtrahends of the numerator and denominator sum up to one.
flexible in terms of functional form assumptions. In particular, linearity in the first stage regression or the outcome model need not be imposed, as for instance in two stage least squares (TSLS). As both preschool attendance and all but one outcome are binary, TSLS appears particularly unattractive in our application because it is generally only consistent under linear probability models for both stages. Our approach is also more robust than semiparametric estimators that rely on parametric models for the propensity score (like probit or logit), which may be prone to misspecification. In our case, the functional form of Pr(D = 1|X = Xi) is not restricted at all.
Concerning inference, we estimate the standard error of the LATE estimator by bootstrapping 1999 times. To be concise, we apply a cluster bootstrap, so that entire households (i.e. all members thereof) rather than individuals are randomly drawn with replacement in each bootstrap sample. Clustering allows for dependencies between unobserved characteristics of children that live in the same household, which likely arise due to exposure to similar social networks, parenting style, etc. In a sensitivity analysis shown in Section 5.2, we cluster instead on the municipality (local cluster) level which allows for dependencies between unobserved characteristics of children that live in the same municipality. Such dependencies may arise due to exposure to similar institutions, infrastructure, or social networks.
5
Results
5.1
Main Results
Before addressing the question whether preschool attendance helps boosting the development of Roma children and thus closing the gap to non-Roma children, we discuss the first stage effect of preschool availability in the vicinity on attendance among Roma children in order to assess the relevance of the instrument. Table 2 shows that in the sample with cognitive and non-cognitive development outcomes (3,334 observations), living at most one kilometer away from the next preschool increases the likelihood of Roma children to attend preschool by 10.6 ppts, which is statistically significant at any conventional level. Using the smaller sample with health outcomes, the first stage is of similar magnitude - 12.4 ppts - and is also significant at all conventional significance levels. In the light of the rather low level of preschool attendance among Roma children - only one third of our Roma sample (but twice as many non-Roma children) go to preschool - this is a substantial increase. Among Roma children in our sample who do not have a preschool close by attendance is even lower, amounting to only one fifth.5 Hence, the mere offer of a preschool facility in the neighborhood helps integrating Roma children in the local educational system already early in life. The effectiveness of such a policy, however, differs across countries. As can
5
Those attending even if not living close to a preschool are the so called ‘always takers’, see Angrist, Imbens, and Rubin (1996).
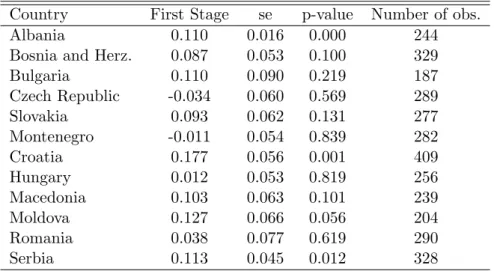
be seen from Table A.2, the first stage estimates vary between roughly zero and 18 ppts. Bearing in mind the institutional features of the countries under study (see Section 2 for details), it seems that expanding the local supply of preschools is particularly effective in countries with rather low enrollment rates (e.g. Bosnia and Herzegovina, Croatia or Serbia) and rather ineffective if enrollment rates are already high (e.g. Hungary, Czech Republic, and Romania).
Table 2:
Estimation results
LATE(IPW) S.E. P-Value Panel A: Effects on cognitive outcomes (n=3334)
Understand Language 0.034 0.157 0.829 10 Letters 0.304 0.147 0.039 Write name 0.222 0.131 0.090 4 Words 0.238 0.124 0.054 10 Numbers 0.418 0.161 0.010 First stage 0.106 0.016 0.000
Panel B: Effects on personality outcomes (n=3334)
Confidence -0.044 0.146 0.765
Peer Relations -0.111 0.116 0.338
First stage 0.106 0.016 0.000
Panel C: Effects on health outcomes (n=2478)
General Health -0.086 0.286 0.763 Longst. illness 0.039 0.076 0.605 Limited activity -0.141 0.115 0.223 Vaccinated (d) 0.218 0.113 0.054 - against tubercolis -0.036 0.064 0.573 - against polio 0.207 0.117 0.076 - against diteper 0.112 0.111 0.312 - against measles 0.151 0.115 0.189 First stage 0.124 0.019 0.000
Note: Standard errors are estimated based on bootstrapping 1999 times
children? The IV estimates based on our nonparametric IPW approach presented in Table 2, Panel A, suggest that preschool attendance brings considerable benefits for Roma children in terms of their cognitive skills. Roma children in preschool are 30.4 ppts more likely to know ten letters of the alphabet (significant at the 5 % level), 22.2 ppts more likely to write their own name, and 23.8 ppts more likely to read at least four popular words (both significant at the 10 % level). There appear to be also substantial gains in terms of analytical skills: exposure to preschool raises Roma children’s ability to recognize the symbols for the numbers one to ten by 41.8 ppts (significant at the 5 % significance level). The estimated benefits of preschool exposure are substantial, in particular in the light of the poor performance of Roma children without exposure to preschool (see Table 1): only 20.6 % of the latter group are able to name ten letters of the alphabet, 10.8 % can write their own name, 10.3 % are able to read four or more popular words, and only 31.0 % recognize the symbols for the numbers one to ten. Hence, the results suggest that exposure to preschool more than doubles the performance of Roma children in these cognitive tasks and helps closing the performance gap with non-Roma children (56.8 %, 43.1 %, 37.1 % and 70.3 % of non-Roma children complete this tasks satisfyingly). As a word of caution, however, it has to be acknowledged that the point estimates are not very precise, such that the confidence intervals cover a wide range of possible values. Nevertheless, it seems worth comparing these remarkable effects to estimates previously found in the literature. We do so by relating the estimates to the standard deviations (sd) of the respective outcome variables in the control group: the effects correspond to approximately 0.75 sd in the case of verbal skills and to around 0.9 sd in the case of analytical skills. These effects are comparable to those found, for instance, for ethnic minorities in Oklahoma (Gormley, Gayer, Phillips, and Dawson 2005). The estimated benefits from preschool exposure for Black children varied between 0.52 and 0.74 sd for verbal skills and amounted to 0.30 sd for analytical skills. In the case of Hispanic children, benefits were about 0.94 sd for analytical skills and ranged between 0.98 and 1.5 for verbal skills. In contrast to the gains in cognitive performance, there appear to be no benefits in terms of personality traits, such as self-confidence or peer relations (Table 2, Panel B). In the same vein, we do not observe any noteworthy effect of preschool attendance on Roma children’s proficiency in the local language. Hence, while preschool attendance helps to boost Roma children’s performance in specific tasks, it does not seem to have an immediate influence at margins which are important for future integration. This is surprising as one might a priori have expected participation in the educational system to lead to an improved integration of minority children among their native peers. However, it is possible that the timing of the survey is too early and effects on language proficiency and integration emerge only later. Finally, preschool attendance also increases the prevalence of vaccinations among Roma children (see Table 2, Panel C). In contrast to non-Roma children who are almost all vaccinated (95.3 %), only 81.5 % of Roma children without preschool exposure are so. When attending preschool this share rises by 21.8 ppts (significant at the 10 % significance level only) and thus leads to full coverage among Roma kids. This result is driven by vaccination against poliomyelitis - a viral
infection which leads to paralysis among children. This achievement is notable as poliomyelitis still prevails among the Roma population while it is basically extinguished in most parts of Europe (Loewenberg 2006). Besides the increased incidence of vaccination, there are, however, no further gains in terms of children’s health when attending preschool (see Table 2, Panel C).
5.2
Tests and Robustness checks
Our identification strategy relies on variation in the individual distance to preschool across Roma children living in the same region and sharing similar neighborhood and household characteristics. We argue that conditional on the mentioned set of control variables, individual distance to preschool is exogenous, i.e. neither related with lobbyism/local preferences, nor Roma families’ location choice and therefore serves as a valid instrument. To strengthen this argument, this section shows the results of a series of robustness checks and statistical tests.
In a first step, we augment the set of control variables and include various proxies for household wealth, namely availability of a radio, tv, computer, a bed for each, and a kitchen in the house, and further features of the neighborhood such as the draining system and the distance to the municipality office. The latter may not only act as additional pull factors, but also be correlated with the availability of preschools. As can be seen from the third column in Table 5.2 results hardly change and significance is maintained among all previously significant estimates, which increases the confidence in our instrument. In addition, we (partially) check the unconditional validity of our instrument (i.e. when not conditioning on any covariates) using the IV test suggested by Huber and Mellace (2013), which jointly tests monotonicity of preschool attendance in distance and mean independence of distance and the potential treatment and outcome states. The p-values of the tests for the various outcome variables, which are presented in the appendix, are never significant on any conventional level and thus provide evidence in favor of our instrument being monotonous and valid.
Baseline Controls Cluster Trimming Bandwidth Panel A: Effects on cognitive outcomes
Understand Language 0.034 0.025 0.034 0.034 0.102 (0.157) (0.156) (0.305) (0.167) (0.134) 10 Letters 0.304 0.338 0.304 0.304 0.282 (0.147) (0.141) (0.182) (0.152) (0.122) Write name 0.222 0.228 0.222 0.222 0.175 (0.131) (0.119) (0.165) (0.132) (0.108) 4 Words 0.238 0.200 0.238 0.238 0.133 (0.124) (0.120) (0.179) (0.126) (0.103) 10 Numbers 0.418 0.423 0.418 0.418 0.379 (0.161) (0.151) (0.228) (0.160) (0.132) First stage 0.106 0.110 0.106 0.106 0.130 (0.016) (0.016) (0.025) (0.016) (0.017) Panel B: Effects on personality outcomes
Confidence -0.044 -0.026 -0.044 -0.044 0.041 (0.146) (0.141) (0.209) (0.148) (0.119) Peer Relations -0.111 -0.058 -0.111 -0.111 0.021 (0.116) (0.113) (0.157) (0.118) (0.096) First stage 0.106 0.110 0.106 0.106 0.130 (0.016) (0.016) (0.025) (0.016) (0.017) Panel C: Effects on health outcomes
General Health -0.086 -0.005 -0.086 -0.086 -0.326 (0.286) (0.300) (0.353) (0.283) (0.259) Longst. illness 0.039 0.051 0.039 0.039 0.071 (0.076) (0.077) (0.099) (0.074) (0.066) Limited activity -0.141 -0.171 -0.141 -0.141 -0.148 (0.115) (0.123) (0.164) (0.116) (0.104) Vaccinated (d) 0.218 0.192 0.218 0.218 0.202 (0.113) (0.099) (0.179) (0.112) (0.103) First stage 0.124 0.119 0.124 0.124 0.142 (0.019) (0.019) (0.027) (0.019) (0.019)
Note: The first column displays the baseline results when clustering at the household level. The second column shows regression results when clustering at the municipality level. The third column gives the results when augmenting the set of controls by proxies for the wealth of the household (availability of a radio, tv, computer, a bed for each, and a kitchen in the house) and the neighborhood (draining system and distance to municipality office) - clustering is at the household level (as for all remaining columns). The fourth column provides the results when discarding observations with p-scores above 0.95 and below 0.05.
As advanced in Section 4.3, we also test the robustness of our results with respect to (i) an alterna-tive unit of clustering, namely the municipality (see the second column of Table 5.2), (ii) propensity score trimming, i.e. dropping observations with propensity scores higher than 95 % and lower than 5 % (fourth column), and (iii) cutting the kernel bandwidths (coming from cross-validation) by half, implying under-smoothing (fifth column). Coefficients are rather stable across the alternative specifications, but standard errors increase slightly when clustering at the municipality level. In the latter case, only statistically sig-nificant improvements in analytical skills and children’s knowledge of letters are found.
6
Conclusion
This paper addresses the question whether exposing Roma children to preschools stimulates their development and thus contributes to closing the development gap observed between Roma and non-Roma children. The empirical analysis is based on a recent data set developed by the United Nations Development Programme, the World Bank and the European Commission. To tackle endogenous selection into preschool, we use distance to the nearest preschool as an instrument for attendance. Estimates resulting from a non-parametric instrumental variable approach highlight important development gains: preschool attendance raises Roma children’s likelihood to know ten letters of the alphabet by 30.4 ppts, to be able to read at least four popular words by 22.2 ppts, to write their own name by 23.8 ppts, and to recognize the symbols for numbers one to ten by 41.8 ppts. In addition, preschool increases the prevalence of vaccinations among Roma children by 21.7 ppt. As a word of caution, it, however, has to be acknowledged that albeit the effects are significantly different from zero, the confidence intervals around the point estimates are non-negligible.
Given these results, expanding preschools appears to be a successful policy for diminishing early arising inequalities between children from minority and majority groups. Nevertheless, the absence of (short term) gains in terms of language proficiency and peer relations may cause some doubts on the efficiency of preschools as a tool to enhance future incorporation of minority children into society. Reasons for this may be that child care facilities or groups within the latter are rather segregated so that exposure to preschool does not promote interactions between children from ethnic minorities and the majority. Moreover, staff working in these facilities may (in part) belong to the ethnic minority and thus not be able to enhance children’s understanding of the local language and the cultural habits. Future research should therefore dig deeper into the structural quality of the child care facilities and analyze whether peer group composition and staff characteristics may be responsible for the success of preschools as a tool to also enhance integration.
References
Abadie, A. (2003): “Semiparametric instrumental Variable estimation of treatment response models,” Journal of Econometrics, 113, 231–263.
Andrews, D. W. K., and G. Soares (2010): “Inference for Parameters Defined by Moment Inequalities Using Generalized Moment Selection,” Econometrica, 78, 119–157.
Angrist, J., G. Imbens, and D. Rubin (1996): “Identification of Causal Effects using Instrumental Variables,” Journal of American Statistical Association, 91, 444–472 (with discussion).
Baker, M., J. Gruber, and K. Milligan (2008): “Universal Child Care, Maternal Labor Supply, and Family Well-Being,” Journal of Political Economy, 116(4), 709–745.
Berlinski, S., S. Galiani, and P. Gertler (2009): “The effect of pre-primary education on primary school performance,” Journal of Public Economics, 93(1-2), 219–234.
Blau, D., and J. Currie (2006): “Who is Minding the Kids,” The Handbook of Education Economics. Br¨uggemann, C. (2012): “Roma Education in Comparative Perspective. Analysis of the UNDP/World Bank/EC Regional Roma Survey 2011,” Roma Inclusion Working Papers. Bratislava: United Nations Development Programme.
Card, D. (1995): “Using Geographic Variation in College Proximity to Estimate the Return to Schooling,” in Aspects of Labor Market Behaviour: Essays in Honour of John Vanderkamp, ed. by L. Christofides, E. Grant, and R. Swidinsky, pp. 201–222. University of Toronto Press, Toronto.
Cascio, E. (2009): “Do Investments in Universal Early Education Pay Off? Long-term Effects of Intro-ducing Kindergartens into Public Schools,” Working Paper 14951, NBER.
Chen, L.-Y., and J. Szroeter (2009): “Hypothesis testing of multiple inequalities: the method of constraint chaining,” CeMMAP working paper 13/09.
Drange, N., T. Havnes, and A. Sandsor (2014): “Kindergarten for all: Long run effects of a universal intervention,” mimeo.
Drange, N., and K. Telle (2010): “The effect of preschool on the school performance of children from immigrant families. Results from an introduction of free preschool in two districts in Oslo,” Discussion papers 631, Statistics Norway.
Dustmann, C., A. Raute, and U. Schoenberg (2013): “Does Universal Child Care Matter? Evidence from a Large Expansion in Pre-School Education,” mimeo, UCL.
EuropeanCommission, EACEA, Eurydice, and Eurostat (2014): “Key data on Early Childhood Education and Care in Europe,” Eurydice and Eurostat Report.
Felfe, C., N. Nollenberger, and N. Rodriguez-Planas (2012): “Can’t buy Mommy’s Love? Uni-versal Child Care and Children’s Long-run Cognitive Development,” Working paper, St. Gallen. Fitzpatrick, M. D. (2008): “Starting School at Four: The Effect of Universal Pre-Kindergarten on
Children’s Academic Achievement,” The B.E. Journal of Economic Analysis & Policy, 8(1), 46. Fr¨olich, M. (2007): “Nonparametric IV Estimation of Local Average Treatment Effects with Covariates,”
Journal of Econometrics, 139, 35–75.
Gormley, W., and T. Gayer (2008): “The Effects of Oklahoma´s Pre-K Program on Hispanic Children,” Social Science Quarterly, 89(4), 916–936.
Gormley, W., T. Gayer, D. Phillips, and B. Dawson (2005): “The Effects of Universal Pre-K on Cognitive Development,” Development Psychology, 41(6), 872884.
Gormley Jr., W. T., D. Phillips, and T. Gayer (2008): “THE EARLY YEARS: Preschool Programs Can Boost School Readiness,” Science, 320(5884), 1723–1724.
Havnes, T., and M. Mogstad (2011): “No Child Left Behind: Universal Child Care And Children’s Long-Run Outcomes,” American Economic Journal: Economic Policy, 3(2), 97–129.
Hayfield, T., and J. Racine (2008): “Nonparametric Econometrics: The np Package,” Journal of Statistical Software, 27, 1–32.
Heckman, J., and D. Masterov (2007): “The Productivity Argument for Investing in Young Children,” Science, 29(3), 446–493.
Huber, M., and G. Mellace (2013): “Testing instrument validity for LATE identification based on inequality moment constraints,” forthcoming in the Review of Economics and Statistics.
Hurvich, C., J. Simonoff, and C. Tsai (1998): “Smoothing Parameter Selection in Nonparametric Regression using an Improved Akaike Information Criterion,” Journal of Royal Statistical Society, Series B, 60, 271–293.
Kahanec, M., K. Zimmermann, and A. Zaiceva (2010): “Ethnic Minorities in the European Union: An overview,” IZA DP, 5397.
Kane, T. J., and C. E. Rouse (1995): “Labor-Market Returns to Two- and Four-Year College,” The American Economic Review, 85, 600–614.
Loewenberg, S. (2006): “The health of Europe’s most marginalised populations,” The Lancet, 368(9553), 2115.
Magnuson, K. A., C. J. Ruhm, and J. Waldfogel (2007): “Does Prekindergarten Improve School Preparation and Performance?,” Economics of Education Review, 26, 33–51.
O’Higgins, N. (2013): “Roma and non-Roma on Central and Southeast European Labour Markets,” UNDP Policy brief.
Racine, J., and Q. Li (2004): “Nonparametric Estimation of Regression Functions with Both Categorical and Continuous Data,” Journal of Econometrics, 119, 99–130.
Rosenbaum, P., and D. Rubin (1983): “The Central Role of the Propensity Score in Observational Studies for Causal Effects,” Biometrika, 70, 41–55.
Silverman, B. (1986): Density estimation for statistics and data analysis. Chapman and Hall, London. Vlase, I., and A. M. Preoteasa (2012): “Roma migrants from Bulgaria and Romania. Migration
patterns and integration in Italy and Spain 2011,” in Roma from Romania, Bulgaria, Italy and Spain, between Social Inclusion and Migration, ed. by D. Tarnovschi, pp. 65–85. Soros Foundation Romania.
A
Appendix
A.1
Further tables
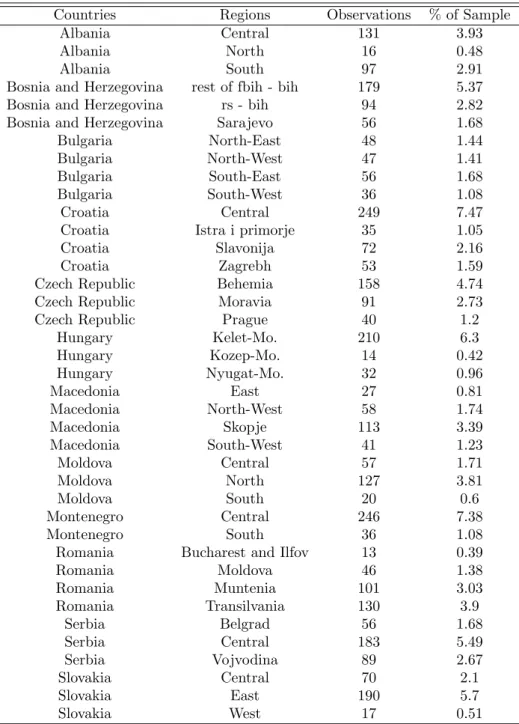
Table A.1: Countries and Regions
Countries Regions Observations % of Sample
Albania Central 131 3.93
Albania North 16 0.48
Albania South 97 2.91
Bosnia and Herzegovina rest of fbih - bih 179 5.37 Bosnia and Herzegovina rs - bih 94 2.82 Bosnia and Herzegovina Sarajevo 56 1.68 Bulgaria North-East 48 1.44 Bulgaria North-West 47 1.41 Bulgaria South-East 56 1.68 Bulgaria South-West 36 1.08
Croatia Central 249 7.47
Croatia Istra i primorje 35 1.05
Croatia Slavonija 72 2.16
Croatia Zagrebh 53 1.59
Czech Republic Behemia 158 4.74 Czech Republic Moravia 91 2.73 Czech Republic Prague 40 1.2
Hungary Kelet-Mo. 210 6.3 Hungary Kozep-Mo. 14 0.42 Hungary Nyugat-Mo. 32 0.96 Macedonia East 27 0.81 Macedonia North-West 58 1.74 Macedonia Skopje 113 3.39 Macedonia South-West 41 1.23 Moldova Central 57 1.71 Moldova North 127 3.81 Moldova South 20 0.6 Montenegro Central 246 7.38 Montenegro South 36 1.08
Romania Bucharest and Ilfov 13 0.39
Romania Moldova 46 1.38 Romania Muntenia 101 3.03 Romania Transilvania 130 3.9 Serbia Belgrad 56 1.68 Serbia Central 183 5.49 Serbia Vojvodina 89 2.67 Slovakia Central 70 2.1 Slovakia East 190 5.7 Slovakia West 17 0.51
Table A.2: First stages per countries
Country
First Stage
se
p-value
Number of obs.
Albania
0.110
0.016
0.000
244
Bosnia and Herz.
0.087
0.053
0.100
329
Bulgaria
0.110
0.090
0.219
187
Czech Republic
-0.034
0.060
0.569
289
Slovakia
0.093
0.062
0.131
277
Montenegro
-0.011
0.054
0.839
282
Croatia
0.177
0.056
0.001
409
Hungary
0.012
0.053
0.819
256
Macedonia
0.103
0.063
0.101
239
Moldova
0.127
0.066
0.056
204
Romania
0.038
0.077
0.619
290
Serbia
0.113
0.045
0.012
328
A.2
IV tests
We subsequently present IV tests for the unconditional validity of our instrument (i.e., when not control-ling for covariates X). To be precise, the method jointly tests monotonicity of preschool attendance in distance to preschool and the mean independence of the distance instrument of both potential outcomes and treatment states as proposed by Huber and Mellace (2013). The authors have shown that under the satisfaction of both assumptions, the following testable mean constraints must hold:
E(Y |D = 1, Z = 1, Y ≤ yq) ≤ E(Y |D = 1, Z1= 0) ≤ E(Y |D = 1, Z = 1, Y ≥ y1−q),
E(Y |D = 0, Z = 0, Y ≤ yr) ≤ E(Y |D = 0, Z1= 1) ≤ E(Y |D = 0, Z = 0, Y ≥ y1−r), (2) where (under our identifying assumptions) q = Pr(D=1|Z1=0)
Pr(D=1|Z1=1) is the share of always treated (those who
attend preschool no matter whether they live close or farther away) in the population with D = 1, Z1= 1. r = Pr(D=0|Z1=1)
Pr(D=0|Z1=0) is the share of never treated (those who do not attend preschool no matter whether they
live close or farther away) in the population with D = 0, Z1= 0.
As discussed in Huber and Mellace (2013) in more detail, the intuition of the test is that E(Y |D = 1, Z1 = 0), E(Y |D = 0, Z1 = 1) point identify the mean potential outcomes (as a function of D) of the always/never treated under D = 1, 0, respectively. At the same time, the mean potential outcomes of the latter groups can be bounded in the (mixed) populations with D = 1, Z1 = 1 and D = 0, Z1 = 0, respectively, that also contain compliers. One can therefore test whether the points lie within the bounds as postulated in (2). We do so applying the minimum p-value-based test of Chen and Szroeter (2009) for multiple inequality constraints. The distribution of the test statistic is estimated by bootstrapping (we use 999 bootstrap draws) and relies on pre-estimating which inequality constraints are (close to being) violated to increase testing power in finite samples.6 As a word of caution, however, it has to be noted that even asymptotically, these tests cannot find all possible violations of instrument validity, because they rely on a partial identification approach. The p-values of the IV tests for the various outcomes are provided in Table A.3 and are never significant on any conventional level.
6See for instance Andrews and Soares (2010) and Chen and Szroeter (2009) for a more detailed discussion of
Table A.3: IV tests
Outcome Understand Language 10 Letters Write name 4 Words 10 Numbers
P-value 1.000 0.999 1.000 1.000 1.000
Outcome Confidence Peer Relations General Health Longst. illness Limited activity
P-value 1.000 0.997 0.999 0.959 0.785
Outcome Vaccinated (d) - against tubercolis - against polio - against diteper - against measles
P-value 0.531 0.626 0.125 0.999 0.695
Note: P-values are based on bootstrapping 999 times.
A.3
Propensity score distributions
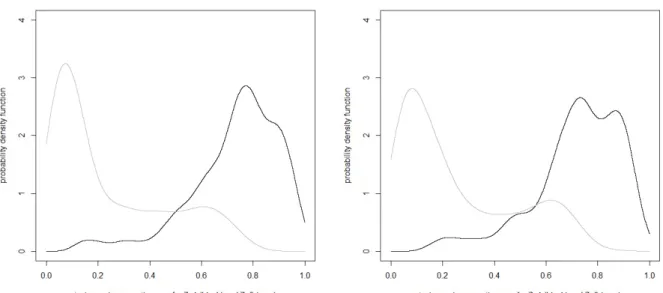
Figure A.1:
Propensity score distributions for cognitive/personality outcomes (left) and health
outcomes (right)
Note: Kernel density estimation of the estimated Pr(D = 1|M, W, X) is based on the Gaussian kernel and the Silverman (1986) rule of thumb for bandwidth selection.