HAL Id: hal-00776637
https://hal.inria.fr/hal-00776637
Submitted on 17 Jan 2013
HAL is a multi-disciplinary open access
archive for the deposit and dissemination of
sci-entific research documents, whether they are
pub-lished or not. The documents may come from
teaching and research institutions in France or
abroad, or from public or private research centers.
L’archive ouverte pluridisciplinaire HAL, est
destinée au dépôt et à la diffusion de documents
scientifiques de niveau recherche, publiés ou non,
émanant des établissements d’enseignement et de
recherche français ou étrangers, des laboratoires
publics ou privés.
Surface-based versus volume-based fMRI group analysis:
a case study
Alan Tucholka, Merlin Keller, Jean-Baptiste Poline, Alexis Roche, Bertrand
Thirion
To cite this version:
Alan Tucholka, Merlin Keller, Jean-Baptiste Poline, Alexis Roche, Bertrand Thirion. Surface-based
versus volume-based fMRI group analysis: a case study. MICCAI 2009 Functional NeuroImaging
Workshop, Bertrand Thirion, Alexis Roche, Philippe Ciuciu, Sep 2009, Londres, United Kingdom.
�hal-00776637�
Surface-based versus volume-based fMRI group
analysis: a case study
Alan Tucholka1,2,3, Merlin Keller1,2, Jean-Baptiste Poline1
, Alexis Roche1
, and Bertrand Thirion2
1
Neurospin, I2BM, CEA, F-91191 Gif-sur-Yvette, France 2
INRIA Saclay-ˆIle-de-France, Parietal, Saclay, France 3
Abstract. Being able to detect reliably functional activity in a popula-tion of subjects is crucial in human brain mapping, both for the under-standing of cognitive functions in normal subjects and for the analysis of patient data. The usual approach proceeds by normalizing brain volumes to a common 3D template. However, a large part of the data acquired in fMRI aims at localizing cortical activity, and methods working on the cortical surface may provide better inter-subject registration than the standard procedures that process the data in 3D. Nevertheless, few as-sessments of the performance of surface-based (2D) versus volume-based (3D) procedures have been shown so far, mostly because inter-subject cortical surface maps are not easily obtained. In this paper we present a systematic comparison of 2D versus 3D group-level inference procedures, by using cluster-level and voxel-level statistics assessed by permutation, in random effects (RFX) and mixed-effects analyses (MFX). We find that, using a voxel-level thresholding, and to some extent, cluster-level thresholding, the surface-based approach generally detects more, but smaller active regions than the corresponding volume-based approach for both RFX and MFX procedures, and that surface-based supra-threshold regions are more reproducible by bootstrap.
1
Introduction
Studying the localisation and variability of brain activity across subjects is cer-tainly one of the most important aspects of neuroimaging data analysis. The detection and the precise localisation of the BOLD signal are therefore crucial. Clearly, these steps are interacting as the detection of activity across subjects requires first to coregister the subjects brains to a common coordinate system. This step is most commonly performed in 3D space, by applying linear and non-linear warpings such that the anatomical and the functional images are coregistered to a common template, often chosen to be the MNI template. The standard approach to activation detection [1] consists in comparing the images from the different subjects on a voxel-by-voxel basis, computing a statistical map to test the presence of an activation in each voxel of the standard space. The ensuing multiple testing problem can be addressed directly at the voxel-level or
by testing the presence of activity inside clusters defined above a user-chosen threshold [2].
Spatial normalisation is therefore crucial to the whole procedure. Because a very large part of the data originates from the cortex, methods that work on the cortical surface may be more sensitive than those using the 3D data. It is well known that volume-based normalization may intoduce inaccuracies in anatomical positioning of functional data, the magnitude of which may be estimated as 1cm in several cortical regions [3]. Several studies have shown that a coregistration based on the cortical surface may better align the functional signal across subjects [4,5,6,7]. For instance, it is difficult to account for the inter-subject variability of gyri size, shape or position in a 3D referential and such differences may displace functional activity to a different gyrus.
In this paper, we investigate whether surface-based approaches, that rely on a cortical surface referential, provide better constraints about the position of functional activity, and more precisely, whether this is reflected in state-of-the-art inter-subject statistical procedures. Following [4], we perform functional analysis on the cortical surface for a group of 25 subjects. The inter subjects analysis relies on matching the subjects cortical surface [4]. Additionally, we systematically compare the 2D and 3D statistical analysis and provide results on the difference in sensitivity of the two approaches for different tests, for a given control of the type I error. More specifically, we use for the comparison mixed- and random-effects inference at the voxel and at the cluster level [8] and assess their bootstrap reproducibility. These statistical analyses provide the cognitive neuroscientist or clinician with solid information on the sensitivity that can be achieved with surface-based methods.
2
Materials and Method
2.1 Data and pre-processing
Data were acquired from 25 subjects who performed a functional localizer proto-col as described in [9]. This protoproto-col is intended to activate multiple brain regions in a very short time (128 volumes in 5 minutes) with many experimental condi-tions to allow the application of many different functional contrasts. Anatomical and functional data was acquired on a 1.5T GE scanner. The functional data was first corrected from the EPI distortions using field maps. Next, a standard pre-processing (correction of differences in slice timing, motion correction and anatomo-functional co-registration) was performed using the SPM5 software on all subjects.
FreeSurfer [4] was used to segment and reconstruct the cortical surface from T1 MRI data of each subject, providing the white matter mesh for both hemi-spheres (note that the aime of this work is not to evaluate the quality of this segmentation). This provides a common spherical coordinate system for each hemisphere in each subject. Pre-processing of the data includes i) segmentation of the white matter on a triangular mesh, ii) detection of the deepest sulci,
iii) inflation of the white surface on a sphere (brain-sphere), iv) deformation to match the deepest sulci positions on the template model.
All data are then converted to the standard GIFTI format for further process-ing (to obtain a node-by-node correspondence of the resampled brains): i) a reg-ular sphere (icosphere) of diameter equal to the brain-sphere is created, ii) this sphere is refolded onto the original cortical surface of each subject while preserv-ing node-to-node correspondence of the icosphere mesh between subjects. The resulting gray/white interface mesh is called resampled mesh.
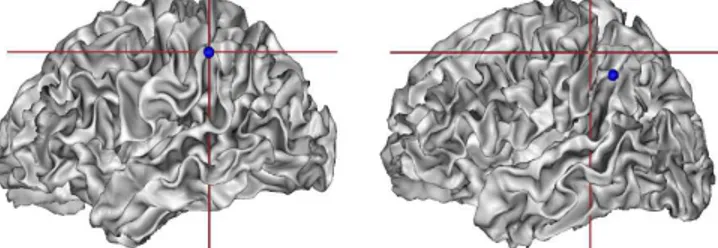
In Fig. 1, two meshes are presented after affine coregistration to the MNI template of the corresponding T1 images. The cross corresponding to the top of the posterior Sylvian Fissure sulcus on the left subject appears on the right subject in a very different anatomical position. The surface-based correspondence (blue balls) is clearly much more accurate.
Fig. 1.Definition of the top of the posterior Sylvian Fissure sulcus in two brains in a normalized space (MNI space, affine coregistration). The cross corresponds to the same voxel coordinates. The blue ball correspond to the same node after brain resampling.
An average-brain of the 25 subjects was created for visualisation of the re-sults. Each resampled mesh is coregistered to a normalized space (MNI/Talairach space), then an average brain is obtained by computing the mean 3D position of each node through all subjects in that space.
Functional images were then projected onto the resampled gray/white in-terface mesh of each subject using the method described in [10]. A General Linear Model (GLM) analysis was applied at each and every node and the ac-tivation maps for the i) left versus right button presses, ii) sentence listening versus sentence reading, iii) computation versus reading iv) reading versus pas-sive checkerboard viewing contrasts.
2.2 Group data modeling
In this work, n = 25 subjects are considered. For each subject i, and at any node of the resampled mesh, let ˆβi be the estimation of the BOLD effect related to
some some effect of interest (note that this section is easy to generalize to a linear combination, i.e. contrast of effects). ˆβi is distributed around the true effect βi:
ˆ
βi= βi+ ei with ei∼ N (0, s2i) where the estimation variance s 2
the first-level General Linear Model (GLM). We assume that βi= βG+ εi where
εi∼ N (0, σ2) and βG is the population-level effect. We thus have :
ˆ βi= βG+ ε′i, ε′i∼ N (0, σ 2 + s2 i), (1) where σ2
is the between-subject variance. This is a generalization of the RFX model in [1] which neglects the estimation variance, i.e. it assumes s2
i ≡ 0. Both
βG and σ 2
are then estimated by maximizing the log-likelihood of the model specified in Eq. (1) using the Expectation-Maximization (EM) algorithm in [11]. The following log-likelihood ratios are computed to test the positivity of βG:
LM F X =supσ2,βG>0 QS i=1N ( ˆβi; βG, σ 2 + s2 i) supσ2 QS i=1N ( ˆβi; 0, σ2+ s2i) , (2) LRF X =supσ2,βG>0 QS i=1N ( ˆβi; βG, σ2) supσ2 QS i=1N ( ˆβi; 0, σ2) (3)
Note that computing LRF X is equivalent to performing a t-test.
2.3 statistical calibration
The distribution of the statistics in Eq. (2-3) under the null hypothesis (βG= 0)
is unknown, but can be estimated very simply by a randomization procedure, in which the statistics are recomputed after a sign swap of the observed effects
ˆ
βi. Under the hypothesis that the distribution of the true effects is
symmet-ric about 0 under the null hypothesis, this procedure yields an exact (possibly conservative) specificity for the test. In order to control the family-wise error rate (FWER), i.e. the probability of detecting one false positive over the search domain, we consider the distribution of the maximal statistic under the null hy-pothesis. For a chosen FWER α, this yields a voxel- or vertex- level corrected threshold.
A more sensitive approach to detect extended regions consists in first thresh-olding the statistics map at a given level (corresponding e.g. to p < 10−3
un-corrected), and then to estimate the distribution of size (area or volume) of the supra-threshold clusters under the null hypothesis. To solve the multiple compar-ison issue, the size of the maximal cluster is tabulated under the null hypothesis. Once again, the quantile α of this simulated distribution yields a cluster-level corrected threshold.
In order to enable the comparison of volume-based and surface-based ap-proaches, we systematically project the clusters obtained from the volume-based approaches onto the average surface.
3
Results
To compare the surface-based versus the volume-based group-level analysis, we used four different methods (RFX voxel-level, MFX voxel-level, cluster-level
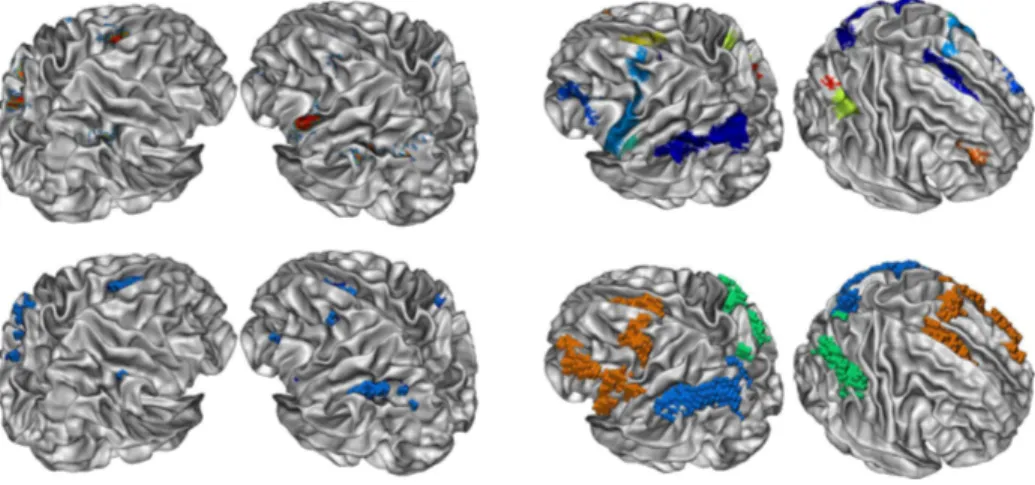
Fig. 2. Left: Surface-based (top line) versus volume-based (bottom line) voxel-level RFX group analysis results for the computation task. Right: Cluster-level RFX group analysis for the computation task on the surface (top line) and in the volume (bottom line).
RFX and cluster-level MFX) on four functional contrasts: computation versus reading, reading versus passive checkerboard viewing, left versus right button press and sentence listening versus sentence reading that we refer to as computation, reading, motor and auditory. The voxel-level analysis finds only a few active voxels with the volume-based method, while the activity map on the surface contains a significant number of active nodes in more brain regions (see e.g. the regions activated for the computation task, in the left part of Fig. 2, in particular the bottom part of the pre-central gyrus).
The same tendency can be observed with the cluster-level analysis (see Ta-ble 1), although the effect is more subtle (see Fig. 2): The surface-based proce-dures detected many more functional clusters than the volume-based methods, but these clusters are much smaller. This indicates that:
– Many clusters that are merged in 3D are split into different components on the surface (see Fig. 2); this means that several different functional regions are merged into one cluster in volume-based analyses. While these regions are close in Euclidian distance (in the volume space), there are distant once projected on the surface (e.g. on a different gyrus).
– The size threshold is much lower for the surface-based approach than for the volume-based approach, in the sense that the surface-based approach is able to extract finer structures than the volume-based approach.
The MFX statistic never detects any voxels or clusters activated in the vol-ume, while the results on the surface are similar, though weaker than with the RFX statistic. The reduced sensitivity with mixed effects is unexpected and can hint at a first-level model mis-specification, hence a defect of the model design. The results in terms of activated area are given in Table 2; the surface-based
Contrast Computation Reading Left Motor Auditory Method RFX MFX RFX MFX RFX MFX RFX MFX
Surface 14 17 6 7 8 6 4 4
Volume 5 0 4 0 4 0 2 2
Table 1.Comparison of the number of clusters found using RFX and MFX methods on volume-based and surface-based approaches.
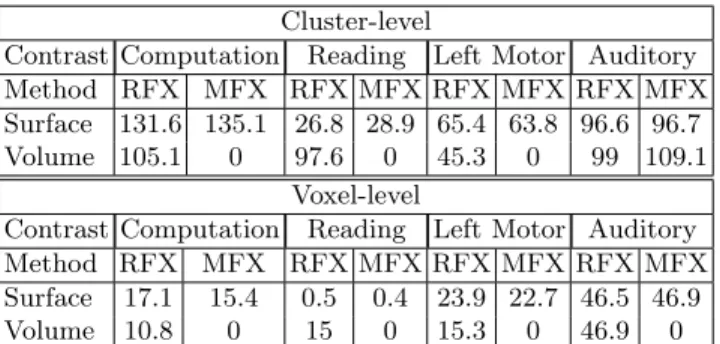
Cluster-level
Contrast Computation Reading Left Motor Auditory Method RFX MFX RFX MFX RFX MFX RFX MFX Surface 131.6 135.1 26.8 28.9 65.4 63.8 96.6 96.7 Volume 105.1 0 97.6 0 45.3 0 99 109.1
Voxel-level
Contrast Computation Reading Left Motor Auditory Method RFX MFX RFX MFX RFX MFX RFX MFX Surface 17.1 15.4 0.5 0.4 23.9 22.7 46.5 46.9 Volume 10.8 0 15 0 15.3 0 46.9 0 Table 2. Comparison of the area of supra-threshold regions in cm2
of volume-base (after projection) and surface-base approaches, for MFX and RFX statistics, with both cluster-level and voxel-level inference.
approach detects wider regions for the computation task, and less for the reading task when considering RFX. It is generally more sensitive using MFX.
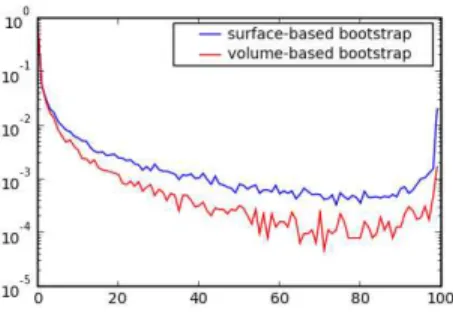
Additionally, we studied the bootstrap reproducibility of the supra-threshold regions in the surface- and volume-based procedures: we created P = 103
sur-rogate groups and computed how many time a vertex or a voxel had a p-value below 10−3, uncorrected. We systematically found a higher proportion of
con-sistently supra-threshold regions in the surface-based method as illustrated in Fig. 3. This effect was quantified using the a classification index based on this histogram [12], which was consistently higher for the surface-based approach (data not shown).
4
Discussion
We have shown in this work that surface-base approaches detects activity in more brain regions when based detection is performed (level RFX, voxel-level MFX) compared to the volume-based approach. This gain in sensitivity is probably related to two factors:
– The search domain is smaller (i.e. it consists in the cortex only), while the volume-based approach tests also white matter and cerebro-spinal fluid re-gions. This effect is visible in the bootstrap reproducibility histogram shown in Fig. 3. The price to pay is that sub-cortical structures (thalamus, basal ganglia, cerebellum etc.) are not considered in the surface-based representa-tions.
Fig. 3.Bootstrap reproducibility of RFX thresholding procedures for the motor con-trast: This is the normalized histogram of the reproducibility map that indicates how frequently a voxel or vertex has a supra-threshold activity, with a threshold correspond-ing to p < 10−3, uncorrected: the surface-based approach has a much higher proportion of consistently supra-threshold regions.
– The coregistration of the data is certainly more accurate, as illustrated in Fig. 1 with an anatomical landmark. Note that this better coregistration could have the effect to reduce the spread of significant regions by removing a spatial uncertainty on their position.
When considering cluster-level statistics, the gain is more subtle, as discussed in the previous section. More precisely, it can be expected that the finer coreg-istration related to the surface-based approach has a mitigated effect on the detection of large clusters: volume-based approaches tend to join smaller clus-ters which are close in Euclidean space, but relatively distant on the geodesic (surface-based) representation. It should also be reminded that cluster-level anal-yses allow only a weak control of false detections: a supra-threshold cluster has the property to contain at least one voxel for which the null hypothesis can be rejected, but does not allow to conclude that all the voxels or nodes in that cluster are indeed active.
Moreover, when considering tasks with asymmetric activity, such as read-ing, the volume-based approach can miss significant activity in weakly-activated hemisphere, compared to the surface-based approach (data not shown).
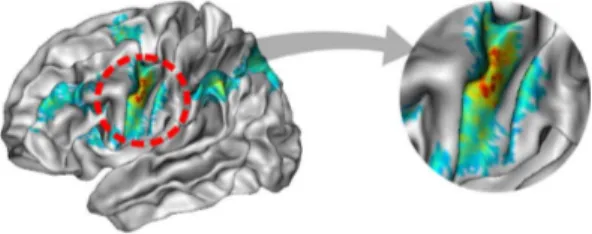
However, in surface-based approaches, if the resolution is not fine enough, or if EPI distortions are not perfectly corrected, the functional signal may be diluted to neighbouring gyri, creating false supplementary clusters (as we can see on Fig. 4). An interesting question that can still be addressed is how a surface coregistration procedure based on geometric features such as Freesurfer would compare to representations of the surface that take into account sulcus labelling. Some recent experiments have indeed shown that sulcus-based coordinate sys-tems tend to stabilize the position of some functional landmarks [13].
Conclusion Performing fMRI group analysis on the cortical surface instead of the brain volume may benefit to the detection of some foci of activity, and thus
Fig. 4.The activity on the pre-central gyrus has also been projected on the neighbour-ing gyrus (post-central gyrus).
yield more specific, and possibly more sensitive analysis than standard volume based approaches. It may thus reveal sharper contrasts in the functional data and thus provide more reliable markers of brain functional anatomy. It will also be important to assess whether surface-based analysis better discriminates population of controls and patients than standard volume-based methods.
References
1. Friston, K.: Statistical parametric mapping. In Frackowiak, R., Friston, K., Frith, C., Dolan, R., , Mazziotta, J., eds.: Human Brain Function. Academic Press USA (1997)
2. Hayasaka, S., Nichols, T.: Validating Cluster Size Inference: Random Field and Permutation Methods. NeuroImage 20(4) (2003) 2343–2356
3. Stiers, P., Peeters, R., Lagae, L., Hecke, P.V., Sunaert, S.: Mapping multiple visual areas in the human brain with a short fMRI sequence. NeuroImage 29(1) (Jan 2006) 74–89
4. Fischl, B., Sereno, M.I., Dale, A.M.: Cortical surface-based analysis. ii: Inflation, flattening, and a surface-based coordinate system. Neuroimage 9(2) (Feb 1999) 195–207
5. Argall, B.D., Saad, Z.S., Beauchamp, M.S.: Simplified intersubject averaging on the cortical surface using suma. Hum Brain Mapp 27(1) (Jan 2006) 14–27 6. Desai, R., Liebenthal, E., Possing, E.T., Waldron, E., Binder, J.R.: Volumetric vs.
surface-based alignment for localization of auditory cortex activation. NeuroImage 26(4) (2005) 1019 – 1029
7. Anticevic, A., Dierker, D.L., Gillespie, S.K., Repovs, G., Csernansky, J.G., Essen, D.C.V., Barch, D.M.: Comparing surface-based and volume-based analyses of functional neuroimaging data in patients with schizophrenia. NeuroImage 41(3) (2008) 835 – 848
8. M´eriaux, S., Roche, A., Dehaene-Lambertz, G., Thirion, B., Poline, J.B.: Combined permutation test and mixed-effect model for group average analysis in fmri. Hum Brain Mapp 27(5) (May 2006) 402–410
9. Pinel, P., Thirion, B., Meriaux, S., Jobert, A., Serres, J., Bihan, D.L., Poline, J.B., Dehaene, S.: Fast reproducible identification and large-scale databasing of individual functional cognitive networks. BMC Neurosci 8 (2007) 91
10. Operto, G., Bulot, R., et al.: Projection of fMRI data onto the cortical surface using anatomically-informed convolution kernels. Neuroimage 39(1) (Jan 2008) 127–135
11. Keller, M., Roche, A.: Increased sensitivity in fmri group analysis using mixed-effect modeling. ISBI 2008 (May 2008) 548–551
12. Thirion, B., Pinel, P., Mriaux, S., Roche, A., Dehaene, S., Poline, J.B.: Analysis of a large fmri cohort: Statistical and methodological issues for group analyses. Neuroimage 35(1) (Mar 2007) 105–120
13. Tucholka, A., Thirion, B., Pinel, P., Poline, J.B., Mangin, J.F.: Triangulating cortical functional networks with anatomical landmarks. ISBI 2008 (May 2008) 612–615
![[PDF] Apprendre à travailler avec le logiciel Audacity | Cours informatique](data:image/gif;base64,R0lGODlhAQABAIAAAP///wAAACH5BAEAAAAALAAAAAABAAEAAAICRAEAOw==)