HAL Id: hal-00008288
https://hal.archives-ouvertes.fr/hal-00008288
Preprint submitted on 31 Aug 2005
HAL is a multi-disciplinary open access
archive for the deposit and dissemination of
sci-entific research documents, whether they are
pub-lished or not. The documents may come from
teaching and research institutions in France or
abroad, or from public or private research centers.
L’archive ouverte pluridisciplinaire HAL, est
destinée au dépôt et à la diffusion de documents
scientifiques de niveau recherche, publiés ou non,
émanant des établissements d’enseignement et de
recherche français ou étrangers, des laboratoires
publics ou privés.
The late merging phase of a galaxy cluster : XMM EPIC
Observations of A3266.
Jean-Luc Sauvageot, Elena Belsole, Gabriel Pratt
To cite this version:
Jean-Luc Sauvageot, Elena Belsole, Gabriel Pratt. The late merging phase of a galaxy cluster : XMM
EPIC Observations of A3266.. 2005. �hal-00008288�
ccsd-00008288, version 1 - 31 Aug 2005
Astronomy & Astrophysicsmanuscript no. 3242˙aa.hyper30688 August 31, 2005
(DOI: will be inserted by hand later)
The late merging phase of a galaxy cluster :
XMM EPIC observations of A3266.
J.L. Sauvageot
1, E. Belsole
2and G.W. Pratt
31C.E.A., DSM, DAPNIA, Service d’Astrophysique, C.E. Saclay, F91191, Gif sur Yvette Cedex, France 2H.H. Wills Physics Laboratory, University of Bristol, Tyndall Avenue, Bristol BS8 1TL, U.K. 3Max-Planck-Institut f¨ur extraterrestrische Physik, 85748 Garching, Germany
Received date ; accepted date
Abstract.We present a mosaic of five XMM-Newton observations of the nearby (z = 0.0594) merging galaxy cluster Abell 3266. We use the spectro-imaging capabilities of XMM-Newton to build precise (projected) temperature, entropy, pressure and Fe abundance maps. The temperature map exhibits a curved, large-scale hot region, associated with elevated entropy levels, very similar to that foreseen in numerical simulations. The pressure distribution is disturbed in the central region but is remarkably regular on large scales. The Fe abundance map indicates that metals are inhomogeneously distributed across the cluster. Using simple physical calculations and comparison with numerical simulations, we discuss in detail merging scenarios that can reconcile the observed gas density, temperature and entropy structure, and the galaxy density distribution.
Key words.Galaxies: clusters: individual: Abell 3266 - X-rays: galaxies: clusters - galaxies: intergalactic medium
1. Introduction
The last decade has seen increasing interest in the study of the dynamics of galaxy clusters. Previously, cluster dynam-ics were almost exclusively investigated by studying galaxy spatial and velocity distributions using observations at opti-cal wavelengths. However, projection effects and the inaccu-rate determination of cluster galaxy membership can preclude firm conclusions about sub-clustering and the dynamical state. X-ray observations are less affected by projection effects and provide a powerful tool to investigate substructure in clusters of galaxies. Einstein and ROSAT data (combined with opti-cal studies) have suggested that 20 to 55 per cent of clusters show evidence of substructure in their gas and/or galaxy dis-tribution (e.g., Jones & Forman 1999, Schuecker et al. 2001, Kolokotronis et al. 2001). The high energy X-ray detectors aboard the ASCA satellite allowed for the first time the use of the temperature distribution of the intra-cluster gas (ICM) as a quantitative tool for the determination of the cluster dynamical state (e.g. Markevitch 1996, Markevitch et al. 1998, Donnelly et al. 2001). These observations revealed that many clusters which appear fairly smooth in their projected gas and/or galaxy distributions can in fact show complex temperature structure, indicative of dynamical activity.
The temperature distribution of the ICM can now be mapped in exquisite detail with the instruments on board
XMM-Newton and Chandra, making it possible to explore the effects
Send offprint requests to: jsauvageot@cea.fr
of the cluster formation history on the thermodynamics of the gas, and to make detailed, quantitative, dynamical models of individual merger events (e.g., Markevitch et al. 2002; Belsole et al. 2004, 2005; Henry et al. 2004; Govoni et al. 2004). In this paper we use XMM-Newton and Chandra observations to attempt to piece together the dynamical history of the nearby (z = 0.0594) merging galaxy cluster Abell 3266 (A3266).
A3266 has been extensively studied in the optical and the X-ray wave-bands. Quintana et al. (1996), in an analysis of over 300 spectra over a 1.◦8× 1.◦8 field of view, found a ve-locity dispersion of 1400-1600 km s−1at the centre, decreasing to 700-800 km s−1 towards the outskirts (∼ 3h−150 Mpc). They interpreted this velocity gradient as the effect of an old merger which started some 4× 10⁹h−1
50 years ago, with maximum core collapse occurring∼ 2 × 10⁹h−1
50 years ago. In their scenario, the collision was in the southwest-northeast (SW-NE) direc-tion with a relative velocity between the two colliding objects of≃ 1000 km s−1.
In X-ray, A3266 has been studied using ROSAT (Mohr, Mathiesen & Evrard, 1999), ASCA (Henriksen, Donnelly & Davis, 2000; Markevitch et al., 1998), and BeppoSax (De Grandi & Molendi, 1999). All of these analyses found signs of merger activity, including (i) elongated central surface bright-ness along the SW-NE axis (Mohr et al., 1999); (ii) asymmet-ric temperature features and a decreasing temperature profile from∼ 10 in the centre to ∼ 5 keV (Markevitch et al., 1998; De Grandi & Molendi, 1999; Henriksen et al., 2000) at a dis-tance of 15′(∼ 1h−1
the metallicity distribution (De Grandi & Molendi, 1999). The latter authors found a relatively low average metal abundance of 0.17± 0.02 Z/Z⊙.
Roettiger & Flores (2000) developed a 3D numerical model using the optical data from Quintana et al. (1996) in com-bination with constraints from ROSAT and ASCA X-ray ob-servations. They suggested that A3266 is the result of an old (≃ 3 billion years ago), off-axis collision of two clusters with a mass ratio of∼ 1 : 2. In their picture, the less massive
sub-cluster crossed the dominant sub-cluster in the SW-NE direction, passing the western side of the dominant cluster while moving into the plane of the sky at∼ 45◦. Interestingly, they also
pre-dicted a large amount of angular momentum transfer into the ICM from the two colliding clusters. This momentum transfer should be measurable with X-ray bolometers, but unfortunately cannot be verified with the CCDs on board XMM-Newton (or
Chandra), as approximately≃ 10 times better spectral
resolu-tion is needed (see also Roettiger & Flores 2000).
Recently, Henriksen & Tittley (2002) presented a Chandra observation of A3266. This was obtained with the ACIS-I de-tector, and the centre of the cluster was centred on chip 1. Unfortunately the roll-angle caused the whole north-eastern elongation of the cluster to be missed, although the Chandra data allow a good examination of the central 4′. In agreement
with previous work, Henriksen & Tittley found a decreasing temperature profile and observed local temperature variations on scales of 0.25′ as defined by the temperature map. They also found an enhancement in a relatively flat abundance pro-file that they interpreted as the result of metal deposition from a higher metallicity sub-cluster into the main cluster as a conse-quence of the merging event. The overall picture resulting from these Chandra data, together with their re-investigation of the Quintana et al. galaxy distribution was of a relatively minor merging event occurring in the plane of the sky.
Here we present a study which, by taking advantage of the high sensitivity and large field of view provided by
XMM-Newton, surpasses previous high quality X-ray observations.
We combine the 5 overlapping publically-available
XMM-Newton pointings into a mosaic covering∼ 20′, and use this
to investigate the merger scenario in A3266. Our conclusions are the result of the interpretation of precise temperature, pres-sure and entropy maps, in combination with archival Chandra data and optical observations.
Throughout this paper we use a cosmology with h =
H0/100 = 0.7, ΩM=0.3 and ΩΛ=0.7. In this cosmology and at
the cluster redshift, 1′ corresponds to 68 kpc. If not otherwise stated, errors are quoted at 1σ for one interesting parameter and all abundances are given relative to solar using the tables of Grevesse & Sauval (1998).
2. Data preparation
2.1.
XMM-Newton
observations and mosaicconstruction
The EPIC observations were retrieved from the XMM-Newton Science Archive (XSA) database. A total of six∼ 30 ks point-ings cover the entire X-ray extent of the cluster in the sky.
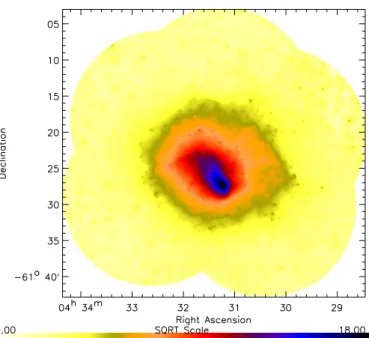
Fig. 1. Low energy (0.5-2.5 keV) wavelet reconstructed EMOS
X-ray image of A3266. The image clearly shows the strong change of isophotal orientation with distance from the centre, the compression of the isophotes toward the SW in the central region, and the bright off-centre core.
Table 1. Journal of observations. The exposure time given
cor-responds to that remaining after cleaning for soft proton flares. Observation 0105262001 was not used since it was heavily comtaminated by flares.
Obs-ID Date Clean exposure (s) EMOS1 EMOS2 EPN 0105260701 2000-10-01 21385 21393 17498 0105260801 2000-10-11 20743 20743 16849 0105260901 2000-10-09 24942 24942 21049 0105261001 2000-09-27 5756 5691 6214 0105261101 2000-09-25 13892 13891 9998
Observation details are given in Table 1. As a background we used the blank-sky background described in Lumb et al. (2002, hereafter the DL event list).
We screened the event lists for flare-induced background contamination by generating light curves in a high energy band, where counts were grouped in 100 second bins. Background files were filtered with the same criterion adopted for the source events. This consists of rejecting those time intervals with more than 18 cnts/100s in the 10-12 keV energy band for MOS cam-eras, and 22 cnts/100 s in the 12-14 keV energy band for the pn, respectively. One of the pointings was heavily contaminated by proton flares, leaving us with five useful pointings. We then built a mosaic event list by merging all the events from each pointing. To build the background merged event list, we ro-tated the original DL event lists to match the sky coordinates of each of the five pointings. It was then possible to merge these
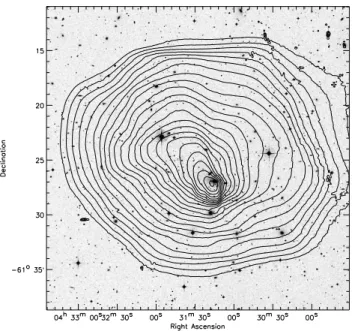
Fig. 2. Digital Sky Survey image of A3266 with low energy
(0.2-2.5 keV) XMM EPIC contours superimposed.
five background event lists to create a background mosaic event list.
To take into account vignetting of the telescope, we used the photon weighting technique computed with the task
- in the Science Analysis System (SAS). The
overlap-ping regions of the mosaic were accounted for by dividing the weight associated with each event by the total exposure time. This allows us to use the merged event list as if it was a single pointing. The total exposure time per camera achieves∼ 80 ks in the central part of the cluster.
2.2. Chandra observation
A 30 ks Chandra observation of A3266 was performed in July 2000 using the ACIS-I detector in VFAINT mode (ID 899). We created a new level-2 event file using CIAO 3.1, following the recommended procedures described in the Chandra data anal-ysis1. In particular we filtered for periods of high background (negligible for this data set), corrected for gain variation, and applied an improved astrometry to the data. Our main inter-est in using these data is to map the low-energy X-ray emis-sion from the central regions of the cluster at the best available spatial resolution, in order to compare these results directly with XMM-Newton data. We thus detected and excluded point sources and filled these regions with Poisson noise using the CIAO tasks wavdetect and dmfilth, respectively. We then used wavelet filtering to build a smoothed X-ray image.
3. X-ray morphology
Figure 1 shows the vignetting corrected, XMM-Newton 0.5-2.5 keV energy band image of the wavelet reconstructed mo-saic in square root scale. The X-ray peak is found at R.A.
1 http://asc.harvard.edu/ciao/threads/createL2/
= 04h31m14s1, Dec. =
−61◦27′26.′′5 (J2000), in agreement with the position of the X-ray peak from Chandra R.A. = 04h31m13s5, Dec. =−61◦27′12.′′0 (J2000), taking into account
that XMM-Newton does not resolve emission from the central galaxy. Figure 2 shows a Digital Sky Survey (DSS) image with the EPIC low energy X-ray contours superimposed.
While the large scale morphology is fairly regular, in the inner region (∼ 450h−170 kpc) the isophotes are clearly ellipti-cal, and the bright inner core is unequivocally off-centre with respect to the larger scale gas distribution. We observe a sig-nificant compression of the isophotes from the peak of emis-sion toward the SW. In the opposite NE direction, we observe an elongation of the surface brightness in a shape resembling a comet tail. Limited statistics in the Chandra data do not al-low us to achieve the 1′′resolution limit, but the final wavelet
reconstructed Chandra low energy image confirms the fea-tures found with the XMM-Newton data (see also Henriksen & Tittley 2002).
4. X-ray cartography
It is well known that the temperature, entropy and pressure dis-tributions can offer key insights towards an understanding of the physical conditions in merging clusters. In this Section, we use XMM-Newton data to derive precise two-dimensional maps of these quantities, plus the Fe abundance distribution, in A3266.
4.1. Temperature map
4.1.1. The Voronoi Tessellation (VT) method
Here we apply, for the first time, the Cappellari & Copin (2003; hereafter CC03) Voronoi tesselation algorithm (hereafter VT) to build the XMM-Newton EPIC temperature map of A3266. We first extracted source and background images in the 0.5-7.5 keV energy band. The chosen energy range optimises the clus-ter signal over the particle background in the temperature range of the cluster. These two images were then used to estimate the Signal-to-Noise (S/N) of each pixel.
We were unable to use the CC03 algorithm in a single step, since X-ray events are distributed following Poisson statistics and many of the pixels have a low S/N. Our implementation of the algorithm thus involves two steps. We first selected only those pixels with a sufficiently high S/N (i.e. (S− N)/N ≥ 1.05) and used the CC03 algorithm to bin these pixels into meta-pixels with a S/N ≃ 130 (our final goal for the temperature map). Since these meta-pixels were obtained from a high S/N subset, they are not generated from a continuous set of pixels. The second step consists of assigning all of the so-far unbinned pixels to their closest meta-pixel. Obviously, the addition of these lower S/N pixels adds scatter to the S/N of the final dis-tribution of meta-pixels. However, the resulting disdis-tribution of convex meta-pixel cells covers the whole image without signif-icantly degrading the S/N.
Application of this technique to the mosaic event list of A3266 results in 138 cells. We fitted the spectrum of each cell with an absorbed model using XSPEC v11.2. The
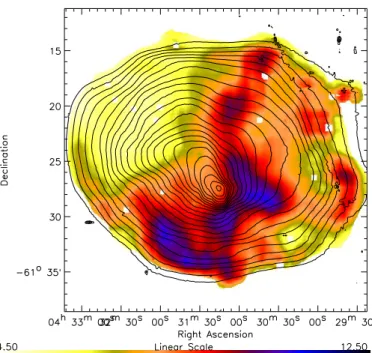
ab-Fig. 3.Temperature map obtained using the VT algorithm. The con-tours are from the wavelet reconstructed 0.5-2.5 keV image with point sources excised. The hot (dark blue/red) region is very likely a shock wave propagating toward the outskirts of the cluster.
sorption was fixed to the Galactic value (NH = 1.6× 1020 cm−2; Dickey & Lockman 1990), and the abundances were
fixed to 0.2 Z/Z⊙. This abundance value was obtained by fit-ting a global spectrum, extracted in a circle of 10′and
exclud-ing point sources, with a two-temperature model with abundances tied together. Our best fitting global abundance is in reasonable agreement with the value found by Henriksen & Tittley (2002) in the central region mapped by Chandra (see also De Grandi & Molendi 1999). We note that a single tem-perature model is an acceptable fit to all 138 cells.
The VT temperature map, shown in Fig. 3, was obtained by filling each cell area with the best fitting temperature value. The 1σ errors associated with the temperature of each cell are plotted as a function of emission measure on the upper panel of Fig. 4. The mean 1σ error is kT+1.15
−0.86. In the lower panel of
Fig. 4 we plot the difference between the upper and lower 1σ errors versus the best-fitting temperature. The observed disper-sion at a given temperature shows the limit of the approach. Since the photon statistics are a function of energy, the higher the temperature, the larger the associated statistical error.
4.1.2. The wavelet spectral mapping method
Like any adaptive binning algorithm, the VT technique sam-ples the sky plane as a set of independent meta-pixels within which the gas temperature can be estimated. While this ap-proach has enabled us to check, in a straightforward manner, the goodness of fit in each cell, it cannot achieve an accurate map of the complex structure of the gas temperature. A more complete exploration of the scale-space can be provided using the wavelet transform. We have therefore built another
temper-Fig. 4. Error on the temperature determination. Mean error bars
are kT+1.2
−0.9 keV. In the top panel we plot the error on T versus
the Emission Measure in each meta-pixel. In the bottom panel we plot the difference between the two 1σ limits versus the fit temperature. The dispersion at a given temperature shows the limit of the approach.
ature map using a specially-developed wavelet spectral map-ping algorithm. In this technique, the gas temperature is first estimated in square resolution elements at different scales, al-lowing characterisation of the spatial variations as Haar wavelet coefficients. The temperature map is obtained from structures selected as significant in the scale-space using a regularised reconstruction process. Further details on the method can be found in Bourdin et al. (2004).
Achieving a spatially homogeneous temperature estima-tion across the field of view, whatever the local statistics, ef-fective area or background contribution, required some adap-tations to the algorithm described in Bourdin et al. (2004, see also Belsole et al. 2004, 2005). For this mosaic, we as-sociated a global emission model F(T ) to the overall data set, and maximised the log-likelihood function log L(F(T )) =
PN
i=1log Fi(T ), in fitting F(T ) to the data. F(T ) is composed
of a linear combination of the expected source and back-ground contributions to each pointing of the mosaic observa-tion. Calling S (T, e) and B(e) the normalised source and back-ground spectra associated with the pointing p, F(T ) can be
ex-Fig. 5. Temperature map built using the wavelet spectral spectral mapping code of Bourdin et al. (2004). The probable shock wave region is again very clearly seen. White squares are excised point sources.
pressed as a function of the local exposure time tp, and effective
area AEp, as:
F(T, k, l, e) = Pnpoint−1
p=0 tp(k, l)∗ AEp(k, l, e)
∗ns(k, l) ∗ S (T, e) + nbp(k, l)∗ B(e) (1)
where e is the incident photon energy, k and l are the meta-pixel coordinates at the current spatial scale, and ns and nbp
are the local emissivity terms associated with S and B, respec-tively. The source model S (T, e) is an absorbed plasma emission spectrum (with NHand abundances fixed as described above). The background model B(e) is a multicomponent spec-trum which takes into account contributions from the particle background and the cosmic X-ray background (see Bourdin et al. 2004 for details).
The resulting temperature map, shown in Fig. 5, was ob-tained from a wavelet analysis performed on 7 scales, corre-sponding to structures of typical sizes ranging from 10′′ to 5′.
All the structures were detected according to a 3 σ significance criterion. As expected, the spatial resolution is better near the cluster core, where the emissivity is the highest, than in the external regions, which have lower photon statistics. Point-by-point comparison is difficult because of the large cell size at the edges of the VT map. Nevertheless, comparing Figs. 3 and 5 shows that the temperature maps are consistent within an un-certainty of±0.5 keV.
4.1.3. Description of the temperature structure
A3266 exhibits temperature structure at several different spa-tial scales (Fig. 5). First of all, we can identify a region of
enhanced temperature which follows closely the compression of the low energy isophotes SW of the X-ray emission peak. This region extends out to 12′(∼ 0.8h−1
70 Mpc) from the cluster centre, with two ‘arms’ pointing toward the north and the SE. The temperature achieves 10 keV in this region, while the sur-roundings are found to be at∼6-7 keV. Secondly, it is clear that the inner core of the cluster, encompassing the X-ray emission peak, is cooler (kT ∼8 keV) than the region directly to the SW. Lastly, going from the X-ray emission peak toward the NE, we observe a smooth decline from kT =8 keV, in the centre, to kT ∼ 5 keV, at the NE edge of the map. These XMM data show considerably more temperature detail than any previous X-ray observations of this cluster. The overall temperature structure is in good agreement with the ASCA analysis (Markevitch et al. 1998; Henriksen et al. 2000) once averaged over the ASCA PSF. The Chandra temperature map presented in Henriksen & Tittley (2002) has rather poor spatial resolution as the data suf-fer from the limited photon statistics. However, once averaged to the spatial resolution of the Chandra temperature map, the
XMM-Newton map looks similar.
We note that the main temperature structure is very similar to the predictions of numerical simulations of on-axis mergers between clusters in the compact/central phase, when a mod-erately supersonic shock develops toward the outskirts of the newly formed cluster (e.g., Roettiger et al. 1996, Ricker & Sarazin 2001), as discussed below in Sect. 6.
4.2. Entropy and pressure maps
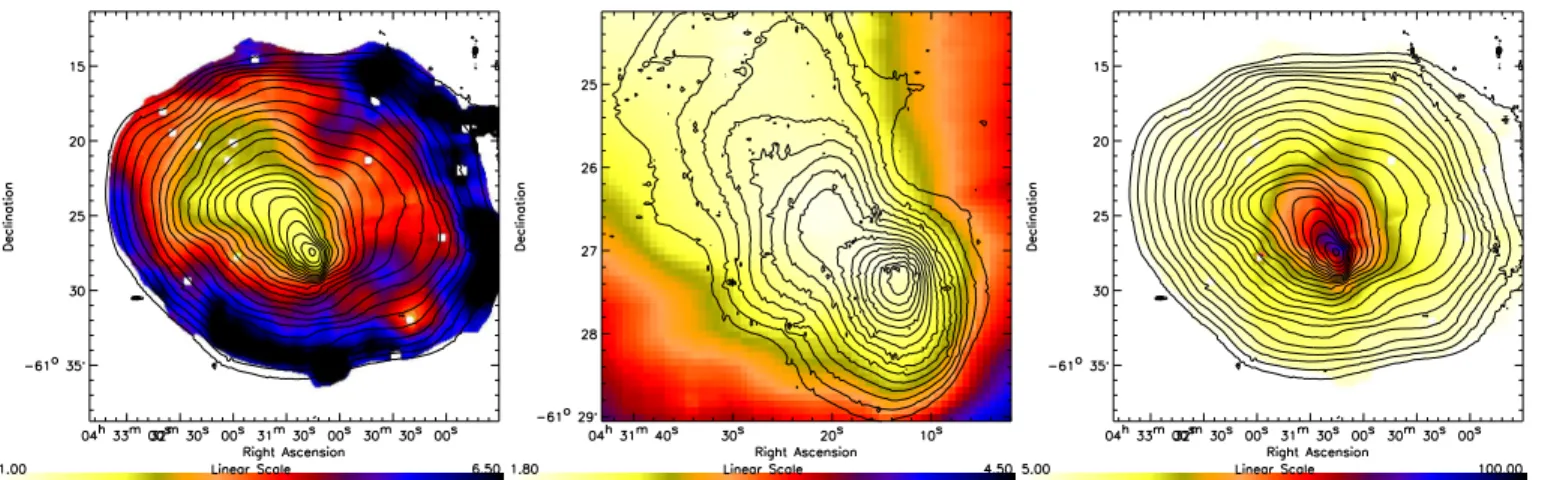
We obtained “pseudo” (projected) entropy (S ) and pressure (P) maps from our emissivity and temperature distributions using the following definitions : S ∝ T/I1/3and P
∝ T ∗ √I, where I
is the 0.2-2.5 keV X-ray image. These maps are shown in Fig. 6. The pseudo-entropy map (left-hand panel of Fig. 6) displays a very elongated dip, which is associated with the comet tail shaped surface brightness distribution in the centre of the clus-ter. In the middle panel of Fig. 6, we show a zoomed view of the central entropy with low energy (0.5-2.5 keV) Chandra con-tours overlaid. The concon-tours of the low energy emission follow very closely the strong gradients in the XMM-Newton entropy map. Interestingly, the pressure (right-hand panel of Fig. 6) ex-hibits much more axial symmetry than the entropy, temperature or emission measure maps.
4.3. Core Fe abundance distribution
The 80 ks exposure achieved in the central region with the
XMM-Newton mosaic allows us to investigate the spatial
distri-bution of metallicity. We do this by generating an Fe equivalent width (EQW) map. We extracted three images in the following energy bands: 6000-6453 eV (Fe K line), 5667-5995 eV (low energy continuum), and 6460-6913 eV (high energy contin-uum). These images were smoothed adaptively using the same template2. We estimated the continuum under the line by
inter-2 The template was built on the basis of count statistics as defined
by the radial profile of the 6-6.45 keV image. With this type of tem-plate, the smoothing box increases linearly from the centre to the outer
Fig. 6. Left: Projected entropy map defined as S ∝ T/I1/3(arbitrary units); Middle: Zoomed image of the projected entropy distribution in the cluster core, with contours of the 0.5-2.5 keV Chandra image overlaid. Note how closely the contours of the low energy X-ray emission follow the entropy gradient; Right: Projected pressure map defined as P ∝ T ∗ √I (arbitrary
units). The contours are from the wavelet reconstructed 0.5-2.5 keV EPIC image with point sources excised. The regularity of the pressure distribution is noticeable.
polation between the two continuum images. The EQW image was then obtained simply by dividing the Fe K image by the interpolated continuum image. The EQW map is sensitive to temperature variations through the Fe emissivity. We have used the table of Fe line total equivalent widths from Rothenflug & Arnaud (1985), together with our temperature map, to convert the EQW map to a spatially resolved abundance distribution.
The resulting Fe abundance distribution (Fig. 7) exhibits a remarkable low abundance ‘path’, which appears to extend between a more uniform region of higher abundance. We ex-tracted a spectrum of this “path”, following the region outlined in blue in Fig. 7. The best fitting values of Z/Z⊙= 0.17± 0.05
and kT = 7.5± 0.3 keV confirm the low abundance of this region. Another spectrum was extracted on the basis of the small-scale higher metallicity areas (defined by white circles in Fig. 7). This spectrum is best fitted with a metallicity of
Z/Z⊙ = 0.23± 0.05 and kT = 6.36 ± 0.3 keV. These direct
spectral measurements thus confirm the validity of the method we have used. The Fe map appears to indicate that the gas in the cluster core is not yet well mixed.
5. Optical observations 5.1. Galaxy density map
Galaxy relaxation after a cluster merger is commonly thought to occur at an intermediate speed between that of the gas and that of the dark matter. Study of the galaxy distribution and dy-namics thus gives further insight into merger kinematics than that achievable through study of the gas alone. We have there-fore built a projected density map with the algorithm developed by Slezak et al. (2005), using the galaxies in the APM cata-logue (Maddox et al., 1990). Use of such a map has the great
regions, following the radial count statistics. This method of template definition avoids the formation of spurious structure sometimes ob-served in adaptive smoothing.
Fig. 7.Fe K abundance map of the cluster. The low-abundance (light-yellow) “path” is confirmed by a spectral fit of the region enclosed by the blue line (Z/Z⊙ = 0.17± 0.05). The high abundance regions
enclosed in white have Z/Z⊙= 0.23± 0.05, when fitted together.
advantage of good statistics, thereby allowing detection of sub-tle variations of the density field. At the same time, projection effects cannot be excluded without a systematic redshift confir-mation.
We used galaxies with R≤ 19 (corresponding to L∗+ 2.5)
to build the galaxy density map. This magnitude was chosen as it allowed sufficient sampling of the cluster while limiting background contamination. In addition, at fainter magnitudes, star-galaxy separation becomes critical in the APM catalogue.
Using a wavelet algorithm to build the galaxy density map allows a more careful restoration of significant structure than the classical Dressler method, and yields a reconstructed image with optimised spatial resolution following count statistics. The
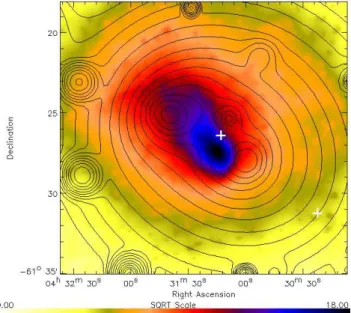
Fig. 8. Projected galaxy density map. The colour image is the low energy X-ray image shown in Fig. 1. The smoothed galaxy den-sity (galaxies with R ≤ 19 from the APM catalogue) is displayed as logarithmically-spaced contours. One clearly see the two density peaks and the X-rays maximum lying in between. The central cross is located at the position of the brightest cluster galaxy (BCG). The southwest cross shows the position of the WAT galaxy.
final projected galaxy density map is shown in Fig. 8, where we observe two strongly significant peaks to the NW and SE of the X-ray emission maximum. The separation between the peaks is∼ 5.2′(≃ 360h−1
70 kpc). The brightest galaxy is located at R.A. = 04h31m13s Dec.=
−61◦27′13′′, to the NE extreme
of the SW peak. This galaxy is a dumb-bell galaxy (Henriksen et al., 2000), with components oriented in the NE-SW direc-tion. Other peaks appearing in the image arise because of the wavelet method we used. A chance projection of a small num-ber of galaxies (typically three or four) may appear as a highly significant local maximum at high spatial frequency, and it is reconstructed as such in the final image, even though we set the threshold for structures to be significant to 3σ. We have visu-ally checked the structures by overplotting the projected galaxy density map on the APM catalogue. All small-scale, high sig-nificance structures in Fig. 8 come from projections of four or less galaxies.
We have compared our projected galaxy density map to pre-vious analyses. Henriksen et al. (2000) and Flores et al. (2000) find only a single central peak, although both maps show a distinct elongation in the NE-SW direction. There is a weak secondary peak at ∼ 4.8′ (∼ 325 kpc) from the main galaxy
concentration in Flores et al.’s map. In our galaxy density map, the second peak is found at a similar projected distance, but is more significant. This discrepancy can be explained by the different data sets used. In Flores et al. (2000), only galaxies belonging to the cluster with a measured redshift were used, re-sulting in only 12 objects in the central 5′× 5′region in Flores
et al., against 42 objects used for calculating the map shown in Fig. 8. The NE maximum was very poorly sampled and the di-lution was such that it almost vanishes from the map. We have
Fig. 9. Velocity histograms derived using galaxies included in
circles of increasing radius, from R < 10′up to R < 60′, cen-tred on the BCG near the X-ray peak. The mean velocity re-mains stable.
checked, with the available redshifts, that the 2D NE maximum is not due to a superposition effect, and visual inspection of re-cent deep CCD imaging confirms the reality of this structure (S. Maurogordato, private comm.).
5.2. Velocities
We used published redshifts to obtain the velocity histogram of the NE and SW galaxy density peaks. Galaxies used to build each histogram were selected within a circle of radius 3′ from
each peak. The mean velocity of the southwestern peak, derived from 64 galaxy redshifts, is 17590 km s−1. The mean
veloc-ity of the northeastern peak, derived from 19 galaxy redshifts, is 16907 km s−1. The difference between the mean velocities of the two galaxy density peaks is very small (δV ≈ 700 km s−1) compared to the overall velocity dispersion of the cluster, indicating that both galaxy density peaks belong to the same structure.
We used the redshifts published in Quintana et al. (1996) to analyse the total velocity distribution in circles of increasing radii centred on the BCG. We used bins of 300 km s−1in order to avoid oversampling the velocity data. Figure 9 displays four histograms for circles of maximum radius rmaxof 10,20,30 and 60 arcminutes.
The galaxy velocity distribution is single-peaked and the dispersion decreases with increasing encircled radius (see also Quintana et al. 1996). The latter may be due to a reduction of the projection effect. The mean velocity changes only slightly out to a radius of 60′ from the centre. We observe a
60′. As expected, inspection of the RA-DEC distribution of galaxies with velocities around 19000 km s−1 indicates that they are not spatially correlated with the NE galaxy density peak shown in Fig. 8.
If the galaxy population consisted of two sets of galaxy over-densities with intrinsically different mean velocities, such analysis should have detected significant variations in the mean and shape of the distribution. The above results indicate that the merger viewing angle is close to the plane of the sky.
6. Discussion and Tentative scheme
6.1. Viewing angle, merger geometry and mass ratio The sharpness of the X-ray temperature (Fig. 5), and partic-ularly the entropy (Fig. 6) features argue for a small viewing angle, since projection effects would wash out these features if the merger was happening at large angles to the line of sight (e.g. Roettiger et al., 1996). Furthermore, our optical analysis indicates that, while there are two peaks in the central (5′× 5′)
galaxy density distribution, the velocity distribution is single peaked from 10′ out to 60′ from the centre. Quintana et al. (1996) obtained 317 galaxy velocities in a 1.◦8× 1.◦8 field, and discussed the possibility of two secondary peaks in their veloc-ity histogram. However the re-analysis of Roettiger & Flores (2000), using the same data set, concludes that the velocity distribution is consistent with a single Gaussian, in agreement with our analysis. Henriksen et al. (2000), again using the same data set, use the Kaye’s Mixture Model (KMM) algorithm to divide the data into an inner region and an outer region with slightly different velocity dispersions. The central velocity of the two Gaussians is not given in their paper, but close exam-ination of their Fig. 1 shows that they cannot be statistically different within the (relatively large) errors. There is no evi-dence for a high-velocity component which is associated with a well-determined galaxy density peak. We thus conclude that there is no strong evidence for more than one velocity com-ponent from the available optical observations, supporting the conclusion from the X-ray data that the merger viewing angle is small.
The temperature and entropy features are useful in con-straining the merger geometry and mass ratio. The symmetry of the low energy X-ray image (Fig. 2) and temperature map (Fig. 5) about the NE-SW axis argues strongly in favour of a small (projected) impact parameter. On the other hand, both images are strongly asymmetric along the orthogonal SE-NW axis. This asymmetry argues in favour of a merger event be-tween subclusters of substantially unequal mass.
The observed regularity of the pressure map (right-hand panel of Fig. 6) can be interpreted in two ways. Either the present merger has not affected the main cluster as a whole, and pressure equilibrium still applies more or less everywhere, or the shock waves have already passed across the entire clus-ter. In view of the clear observational evidence of a rather sharp hot temperature region (Fig. 5), the first option appears more likely. This argues in favour of a relatively large mass ratio.
We thus continue our discussion in the basic framework of an unequal mass ratio merger, occurring close-to on-axis at a small to negligible angle to the line of sight.
6.2. Is there a shock ?
The presence or absence of shocked gas can give key infor-mation on the epoch of the merger event (e.g. Markevitch et al., 1999). Under simple assumptions it is possible to test for shocked gas by investigating the physical conditions around the edges of the enhanced temperature region. The inner and outer edges of this region lie at radii of∼ 1′(68h−170 kpc) and∼ 4-7′ (i.e., 270− 500h−170 kpc), respectively, from the X-ray emission peak. We apply the Rankine-Hugoniot jump conditions for an adiabatic gas: 1 C = s 4 T2 T1 − 1 !2 +T2 T1 − 2 T2 T1 − 1 ! ; for γ = 5 3; (2) 1 C = 3 4 1 M2 + 1 4 ; for γ = 5 3, (3)
to the region which is assumed to be at the shock position. We use the measured pre- and post-shock temperatures (T1and T2, respectively) to compute the Mach number (M), assuming γ =5/3 for an adiabatic gas. Taking a pre-shock temperature, estimated from the average of the external western side of the cluster, of T1≃ 7.5 keV, and a post-shock temperature, as mea-sured in the enhanced temperature region, of T2≃ 9.5 keV, we find ρ1
ρ2 =
1
C = 0.71 and a Mach numberM ≈ 1.3.
Noting that the angle defined by the ‘arms’ of the enhanced temperature region is roughly φ≈ 120◦leads to an alternative
calculation ofM. If one interprets this angle as the Mach cone,
then the Mach number should beM = 1
sin(φ/2)≃ 1.2.
These two independent estimates indicate that, if there is a shock, it is weak. Further evidence comes from the emissiv-ity and entropy images. These are both very regular and do not show any significant gradient perpendicular to the outer tem-perature edge. This also argues against the existence of a strong shock here.
6.3. Merger age
The new result of the XMM/EPIC observation is the very struc-tured temperature enhancement surrounding the cool cluster centre in the SW direction. Since this feature is at the scale of the whole cluster, it is most likely to be associated with the last merger event, and not due to one or more older events such as seen in, e.g., A1750 (Belsole et al., 2004). In addition, the brightest galaxy shows a dumb-bell morphology and these structures are thought to form when the cores of two galaxy clusters collide (Tremaine, 1990; Quintana et al., 1996). The structure observed in the temperature and entropy of the ICM, together with this piece of information, strongly favour the pos-sibility that the two cluster cores have already been in contact (see also Quintana et al. 1996, Flores et al. 2000, Henriksen & Tittley 2002). The question is: what is the current merger epoch?
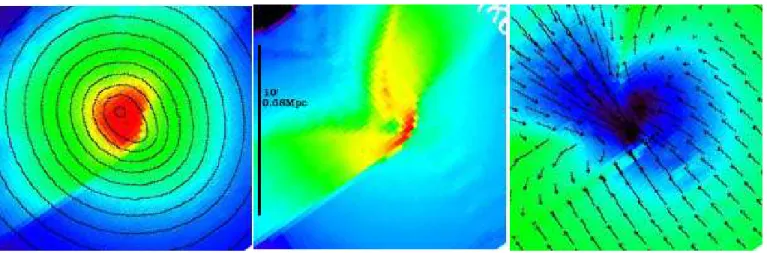
Fig. 10.Images from the simulations of a 1:3 mass ratio, b = 2rs impact parameter merger by Ricker & Sarazin (2001). In this scenario,
the subcluster has entered the cluster from the northeast direction. The three panels show the status of the merger just 0.2 Gyr after the first (maximum) core collapse. From left to right: gas density with contours of gravitational potential, gas temperature (red:hot, blue:cold), and gas entropy (blue: low entropy, green: high entropy) with velocity field (arrows). The slight asymmetry is due to the non-zero impact parameter. The bar in the middle panel is 10′(∼ 680h−1
70 kpc at the distance of A3266) in length. Each image has been rotated to match the observed X-ray
morphology of A3266.
Advances in numerical modelling now allow us to com-pare our results with realistic, if idealised, simulations of clus-ter mergers3. We used the simulations of slightly off-axis (im-pact parameter b = 2rs), 1:3 mass ratio mergers performed by
Ricker & Sarazin (2001)4as a comparison with our X-ray data. We searched these simulations for periods when i) the gas den-sity was reasonably regular but displayed a small amount of asymmetry in the centre, ii) the temperature distribution was mainly characterised by a bow-shaped region of higher tem-perature, and iii) the gas entropy showed the comet-tail shape observed in the left and middle panels of Fig. 6. Two different merger epochs answer to these criteria.
6.3.1. Epoch: +0.2 Gyr after first core collapse
Figure 10 shows the density, temperature and entropy distribu-tions at 0.2 Gyr after the first (maximum) core collapse. It can be seen that this merger epoch reproduces the essential char-acteristics of the X-ray morphology, temperature and entropy structure. It is particularly striking how well the observed low temperature core and surrounding high temperature region are reproduced. In this scenario a small group, with lower temper-ature and entropy, has entered the main cluster from the NE and is now exiting in the SW direction, having passed the main cluster core∼ 0.15 − 0.20 Gyr ago. The group gas was stripped
as it entered regions of progressively denser cluster gas, leaving behind a wake of low-entropy gas. This may explain why the density gradient seen in the Chandra data closely follows the entropy contours. The compression/shock wave would propa-gate in the direction of motion of the subcluster (i.e. toward the SW), thus explaining the temperature distribution. Since the
3 Realistic in the sense that the gas lies in a Navarro-Frenk-White
dark matter halo; idealised in the sense that the cluster mergers have strictly-defined initial conditions, and do not take place in a hierarchi-cal cosmologihierarchi-cal context.
4 Available at www.astro.uiuc.edu/
∼pmricker/research/
cores of the two clusters have already been in contact, this col-lision can also explain the formation of the dumb-bell galaxy.
Interestingly, we can arrive at a similar merger epoch by as-sociating the two galaxy density peaks discussed in Section 5.1 with the cluster-subcluster pair, and using the “ballistic” equa-tions (e.g. Sarazin 2002). From Fig. 8 of Ricker & Sarazin (2001), we can estimate that the global temperature has in-creased by a factor∼ 2.2 due to the merger. The most massive unit thus had kT ≈ 3 keV before the merger event, leading to an estimated mass of∼ 2 × 10¹⁴ M
⊙using the M− T relation
of Arnaud, Pointecouteau & Pratt (2005). The projected dis-tance measured between the two galaxy density peaks is≈ 5.2′
or d = 0.36 Mpc in our cosmology. Assuming that the galax-ies follow the dark matter, this distance is representative of the distance between the two potential wells. The turn-around dis-tance is then: d0≈ 4.5 M1+ M2 1015M ⊙ !1/3 t2/3merge(Gyr)Mpc (4)
where tmergeis the “absolute” date of the merger (Sarazin, 2002)
given by:
tmerge ≈ 13.7 − 980
dMpc vkm s−1
Gyr, (5)
if we consider the age of the Universe equal to 13.7 Gyr in our cosmology. The merger velocities can be estimated using:
v≈ 2930 M1+ M2 1015M ⊙ !1/2 d−1/2M pc 1−dd 0 1− (db 0) 2 1/2 km s−1, (6)
where d is the true distance between the units and b is the im-pact parameter. In our case, we use an imim-pact parameter b = 0, noting that the result does not strongly depend on the exact value (Sarazin, 2002). Assuming a mass ratio of∼ 1 : 3, we find v ≈2400 km s−1, and a time since maximum collapse of
inferred mass ratio, the distance between the two galaxy den-sity peaks, and the observed average X-ray temperature.
As outlined above, this scenario requires us to associate the two galaxy density peaks discussed in Section 5.1 with the cluster-subcluster pair, where the subcluster, travelling from the NE towards the SW, has just passed the core of the main cluster. This interpretation requires us to associate the south-western galaxy density peak with the subcluster, and the NE density peak with the main cluster. We caution that the spectro-scopic completeness of the optical data is not excellent: of the 42 galaxies with R < 19 in the APM catalogue in the central 5′× 5′, only 12 have redshift determinations. Deeper optical observations are required to probe the very central regions of the cluster.
6.3.2. Epoch: +0.8 Gyr after first core collapse
Returning to the simulations of Ricker & Sarazin (2001), we notice that the main morphological, temperature and entropy criteria are also approximately fulfilled at 0.8 Gyr after core passage (Fig. 11) in the same off-axis, 1:3 mass ratio simula-tion. In this scenario, the subcluster has entered the main cluster from the SW, passing the core∼ 0.8 Gyr ago, exiting towards the NE. At this point in the simulation, the subcluster is near-ing turnaround, and the primary shock has dissipated far from the main cluster core, well beyond the edge of the exiting sub-cluster and outside the range of our X-ray observations. The heated central region in this case is the countershock, which is propagating in the opposite direction to the primary shock. Low entropy, high metallicity gas has been stripped from the subcluster, leaving behind a low entropy wake with an inho-mogeneous distribution of metals. This explanation was also put forward by Henriksen et al. (2000) and Henriksen & Tittley (2002), where they associated a galaxy concentration∼ 16′to
the NE (i.e., beyond the field of view of our optical observa-tions) with the exited subcluster.
While the simulation manages to match the gross X-ray characteristics, there are some discrepancies with the observa-tions. The overall structure of the hot region in the temperature map (Fig. 5), is less well reproduced in the simulation (middle panel of Fig. 11). Furthermore, the subcluster is clearly visible at∼ 10′from the main cluster towards the NE corner of the simulated gas density map shown in the left panel of Fig. 11. It is also visible as a region of low temperature and entropy in middle and right hand panels of Fig. 11. It is possible that the X-ray gas associated with the subcluster was entirely stripped during its passage through the main cluster, which may imply a more elevated mass ratio than that considered in these sim-ulations. This interpretation is bolstered by the lack of X-ray emission at the position of the optical subcluster in the ROSAT X-ray maps.
6.3.3. The wide-angle-tail galaxy
One further observational aspect is not explained by either of the two above hypotheses: the orientation of the lobes of the wide-angle-tail (WAT) galaxy located ∼ 7′ to the SW of the
X-ray peak. The radio lobes of this galaxy are oriented in the SW-NE direction of the merger. Among other interpretations, it is suggested that radio lobes are bent by bulk motions of the medium in which the radio galaxy lie in (e.g., Hardcastle, Sakelliou & Worrall 2005, and references therein), especially when these galaxies are found near the centre of clusters and are expected to have only a small relative velocity with respect to the centre of the cluster itself. This is not the case for the WAT galaxy in A3266, which is i) found in rather peripheral position and ii) associated with a host galaxy of relative veloc-ity∼ 800 km s−1less than the mean cluster velocity (although
this is still within the large dispersion of the whole cluster). To explain the direction of the bent radio lobes, bulk gas motion of order 2000 km s−1would be needed. The order of magnitude is the same as we find from our simple dynamic calculation in the epoch +0.2 Gyr scenario. However, in this case, the shock front has not yet had the time to reach the location of the WAT. It is even more difficult to explain the orientation of the WAT lobes in the +0.8 Gyr scenario without invoking large proper motion of the galaxy itself (which in this case should have belonged to the smaller cluster) at the time of collision of the two objects.
7. Conclusion
We have used a set of 5 XMM observations of the merg-ing cluster A3266 to build a mosaic extendmerg-ing to 20 ′ (i.e.
≈ 1.4 Mpc) from the cluster centre. We have been able to
de-rive precise density, temperature, entropy and pseudo-pressure maps that clearly show a region of enhanced tempera-ture around a cooler, low entropy core. The stability of the opti-cal galaxy velocity dispersion argues for a viewing angle close to the plane of the sky. The symmetry of the low energy X-ray isophotes and temperature map along the proposed collision axis argues for a relatively small impact parameter. The asym-metry along the axis orthogonal to the collision, and the rel-atively undisturbed pressure structure, argues for a mass ratio significantly greater than one. An optical galaxy density map suggests the presence of substructure in the central region, in the form of two density peaks, separated by 360h−1
70 kpc, lying to the NE and SW of the X-ray maximum.
Using close comparison with numerical simulations of un-equal mass ratio, slightly off-axis merger events (Ricker & Sarazin, 2001), we have arrived at two possible interpretations for the observed X-ray and optical structure. One interpretation suggests that the subcluster entered the main cluster from the NE, passing the core of the main cluster 0.15-0.20 Gyr, gen-erating the shock wave which is now propagating ahead of the subcluster toward the outskirts of the newly formed cluster. A dynamical calculation made by associating the central galaxy density peaks with the cluster-subcluster pair, leads to a very similar estimate for the merger epoch. However, completeness issues with the optical spectroscopic observations do not allow us to make definite statements concerning the central galaxy density peaks.
An alternative explanation can be found if the subcluster has entered the main cluster from the SW, passing the main cluster core some 0.8 Gyr ago, and exiting towards the NE. At this point in the simulation, the subcluster is near to turnaround.
Fig. 11.Images from the simulations of a 1:3 mass ratio, b = 2rsimpact parameter merger by Ricker & Sarazin (2001). In this scenario, the
subcluster has entered the main cluster from the SW direction, and is approaching turnaround. The three panels show the status of the merger 0.8 Gyr after the first (maximum) core collapse. From left to right: gas density with contours of gravitational potential, gas temperature (red:hot, blue:cold), and gas entropy (blue: low entropy, green: high entropy) with velocity field (arrows). The slight asymmetry is due to the non-zero impact parameter. The bar in the middle panel is 10′(∼ 680h−1
70 kpc at the distance of A3266) in length. Each image has been rotated to match
the observed X-ray morphology of A3266.
Here the primary shock is beyond the reach of our X-ray maps, in the low-density regions at the edge of the cluster. The region of heated gas near the core is the countershock, propagating in the opposite (SW) direction to the primary shock. The lack of X-ray emission to the NE of the X-ray peak in the larger-scale
ROSAT observation of this cluster, which would be associated
with the subcluster potential, would suggest that the subcluster gas has been entirely stripped during the encounter, implying a larger mass ratio than that considered in the simulations.
Deeper optical observations are required to give improved constraints on the relative size of the central galaxy density peaks.
Acknowledgements. We are grateful to S. Maurogordato for pro-viding the galaxy density map, and to H. Bourdin for the use of his wavelet based temperature mapping code. We thank P. Ricker for making his simulations available on the web, and M.J. Hardcastle for discussions about WAT galaxies. We acknowledge the Programme National de Cosmologie (PNC) for supporting the collaboration between the Observatoire de la Cˆote d’Azur and the Service d’Astrophysique, CEA-Saclay. EB acknowledges support from PPARC; GWP acknowledges support from a Marie Curie Intra-European Fellowship under the FP6 programme (contract no. MEIF-CT-2003-500915).
The paper is based on observations obtained with XMM-Newton, an ESA science mission with instruments and contributions directly funded by ESA Member States and the USA (NASA). This research has made use of: the XMM-Newton Science Archive (XSA) data base and the Chandra archive database, NASA’s Astrophysics Data System Abstract Service, the SIMBAD database operated at CDS, Strasbourg, France, the High Energy Astrophysics Science Archive Research Center Online Service, provided by the NASA/Goddard Space Flight Center, and the Digitized Sky Surveys produced at the Space Telescope Science Institute.
References
Arnaud, M., Pointecouteau, E., & Pratt, G.W. 2005, A&A, in press (astro-ph/0502210)
Belsole, E., Pratt, G. W., Sauvageot, J.-L., & Bourdin, H. 2004, A&A, 415, 821
Belsole, E., Sauvageot, J.-L., Pratt, G. W., & Bourdin, H. 2005, A&A, 430, 385
Bourdin, H., Sauvageot, J.-L., Slezak, E., Bijaoui, A., & Teyssier, R. 2004, A&A, 414, 429
Cappellari, M., & Copin, Y. 2003, MNRAS, 342, 345 De Grandi, S., & Molendi, S. 1999, ApJ, 527, L25 Dickey, J. M., & Lockman F. J. 1990, ARA&A. 28, 215 Donnelly, R. H., Forman, W., Jones, C., Quintana, H., Ramirez,
A., Churazov, E., & Gilfanov, M. 2001, ApJ, 562, 254 Flores, R. A., Quintana, H., & Way, M. J. 2000, ApJ, 532, 206 Govoni, F., Markevitch, M., Vikhlinin, A., VanSpeybroeck, L.,
Feretti, L., & Giovannini, G. 2004, ApJ, 605, 695 Grevesse, N., & Sauval, A.J. 1998, Space Sci. Rev. 85, 161 Hardcastle, M. J., Sakelliou, I., & Worrall, D. M. 2005,
MNRAS, 359, 1007
Henriksen, M., Donnelly, R. H., & Davis, D. S. 2000, ApJ, 529, 692
Henriksen, M. J., & Tittley, E. R. 2002, ApJ, 577, 701
Henry, J. P., Finoguenov, A., & Briel, U. G. 2004, ApJ, 615, 181
Joffre, M., Fischer, P., Frieman, J., et al. 2001, in “Gravitational Lensing: Recent Progress and Future Goals”, ed. T. G. Brainerd and C. S. Kochanek, ASP Conference Proceedings, San Francisco: Astronomical Society of the Pacific, Vol. 237, p317 (astro-ph/9909029)
Jones, C., & Forman, W. 1999, ApJ, 511, 65
Kolokotronis, V., Basilakos, S., Plionis, M., & Georgantopoulos, I. 2001, MNRAS, 320, 49
Lumb, D. H., Warwick, R. S., Page, M., & De Luca, A. 2002, A&A, 389, 93
Maddox, S. J., Efstathiou, G., Sutherland, W. J., & Loveday, J. 1990, MNRAS, 243, 692
Markevitch, M. 1996, ApJ, 465, L1
Markevitch, M., Forman, W. R., Sarazin, C. L., & Vikhlinin, A. 1998, ApJ, 503, 77
Markevitch, M., Sarazin, C. L., & Vikhlinin, A. 1999, ApJ, 521, 526
Markevitch, M., Gonzalez, A. H., David, L., Vikhlinin, A., Murray, S., Forman, W., Jones, C., & Tucker, W. 2002, ApJ, 576, 27
Mohr, J.J., Mathiesen, B., & Evrard, A. E. 1999, ApJ, 517, 627 Quintana, H., Ramirez, A., Way, M. J. 1996, AJ, 112, 36 Ricker, P.M., & Sarazin, C. L. 2001, ApJ 561,621 Ritchie B.W., & Thomas, P. A. 2002, MNRAS 329, 675 Roettiger, K., Burns, J.O., & Loken, C. 1996, ApJ, 473, 651 Roettiger, K., Loken, C., & Burns, J. O. 1997, ApJS, 109, 307 Roettiger, K., & Flores, R. 2000, ApJ, 538, 92
Rothenflug, R., & Arnaud, M. 1985, A&A, 144, 431
Tremaine, S. 1990, in Dynamics and Interactions of Galaxies, ed. by R. Wielen (Springer, Berlin), 394
Sarazin, C. L. 2002, Ap&SS, 272, 1 Slezak, E., et al, 2005, A&A, in prep.
Schuecker, P., B¨ohringer, H., Reiprich, T. H., & Feretti, L. 2001, A&A, 378, 408


![[PDF] Cours de programmation Android en pdf | Formation informatique](data:image/gif;base64,R0lGODlhAQABAIAAAP///wAAACH5BAEAAAAALAAAAAABAAEAAAICRAEAOw==)