HAL Id: hal-00004606
https://hal.archives-ouvertes.fr/hal-00004606
Preprint submitted on 30 Mar 2005
HAL is a multi-disciplinary open access
archive for the deposit and dissemination of
sci-entific research documents, whether they are
pub-lished or not. The documents may come from
teaching and research institutions in France or
abroad, or from public or private research centers.
L’archive ouverte pluridisciplinaire HAL, est
destinée au dépôt et à la diffusion de documents
scientifiques de niveau recherche, publiés ou non,
émanant des établissements d’enseignement et de
recherche français ou étrangers, des laboratoires
publics ou privés.
Way’s disk
C. Soubiran, Pascal Girard
To cite this version:
C. Soubiran, Pascal Girard. Abundance trends in kinematical groups of the Milky Way’s disk. 2005.
�hal-00004606�
arXiv:astro-ph/0503498 v1 23 Mar 2005
(DOI: will be inserted by hand later)
Abundance trends in kinematical groups of the Milky Way’s
disk.
⋆
C. Soubiran
1& P. Girard
1Observatoire de Bordeaux, BP 89, 33270 Floirac, France
March 23, 2005/ accepted
Abstract. We have compiled a large catalogue of metallicities and abundance ratios from the literature in order to investigate abundance trends of several alpha and iron peak elements in the thin disk and the thick disk of the Galaxy. The catalogue includes 743 stars with abundances of Fe, O, Mg, Ca, Ti, Si, Na, Ni and Al in the metallicity range -1.30 < [Fe/H] < +0.50. We have checked that systematic differences between abundances measured in the different studies were lower than random errors before combining them. Accurate distances and proper motions from Hipparcos, and radial velocities from several sources have been retreived for 639 stars and their velocities (U,V,W) and galactic orbits have been computed. Ages of 322 stars have been estimated with the Bayesian method of isochrone fitting developped by Pont & Eyer (2004). Two samples kinematically representative of the thin and thick disks have been selected, taking into account the Hercules stream which is intermediate in kinematics, but with a probable dynamical origin. Our results show that the two disks are chemically well separated, they overlap greatly in metallicity and both show parallel decreasing trends of alpha elements with increasing metallicity, in the interval -0.80 < [Fe/H] < -0.30. The Mg enhancement with respect to Fe of the thick disk is measured to be 0.14 dex. An even larger enhancement is observed for Al. The thick disk is clearly older than the thin disk with a tentative evidence of an AMR over 2-3 Gyr and a hiatus in star formation before the formation of the thin disk. We do not observe a vertical gradient in the metallicity of the thick disk. The Hercules stream have properties similar to that of the thin disk, with a wider range of metallicity. Metal-rich stars assigned to the thick disk and super metal rich stars assigned to the thin disk appear as outliers in all their properties.
Key words. Stars: fundamental parameters – Stars: abundances – Stars: kinematics – Galaxy: disk – Galaxy: abundances – Galaxy: kinematics and dynamics
1. Introduction
It is now well admitted that the stellar disk of our Galaxy is made of at least two components : the thin disk and the thick disk. The properties and origin of the thick disk are still matter of debate and require more investigation. In the solar neighbourhood, the observed distribution of stellar velocities is well approximated by the sum of two distinct velocity ellipsoids suggesting that the thin disk and the thick disk are discrete populations. In the last decade a number of studies have demonstrated that they also have distinct chemical distributions (Gratton et al. 1996, Fuhrmann 1998, Bensby et al. 2003, Mishenina et al. 2004 for instance). Unfortunatly, on the one hand, the statistics involving abundance ratios in the thick disk are rather poor, on the other hand, all these studies have not used the same criteria to define the thin disk and the thick
Send offprint requests to: Caroline Soubiran, soubiran@obs.u-bordeaux1.fr
⋆
Data available in electronic form at the CDS (Strasbourg, France)
disk populations. This paper is devoted to improve the situation by collecting the most chemical and kinemati-cal data of high quality available in the literature and to investigate the chemical properties of the thin and thick disks identified by the simplest and most robust criterion, their velocity ellipsoids. Our aim is also to find the stellar parameters which allow the best separation of the thick disk and the thin disk for future investigations.
In order to study the properties of the thin disk and the thick disk separately, its is necessary to clearly identify stars of each population. In practice, this is not obvious be-cause their distributions are overlapping. The kinematical information is often used as a robust criterion for nearby stars but the deconvolution of velocity distributions is complexified by the fact that moving groups, superclus-ters and dynamical streams may exist and translate into inhomogeneities in the velocity ellipsoids. This problem has recently been revisited by Famaey et al. (2004) who identified several kinematical subgroups in a local sam-ple of giants, representative of the solar neighbourhood. Among them, the Hercules stream is crucial because its
motion, which is believed to have a dynamical origin, can be confused with that of the thick disk. Famaey et al. (2004) have estimated that 6.5% of their sample belongs this stream. If the hypothesis of a dynamical origin is cor-rect, then the Hercules stream must be made of a mixture of stars of any population but mainly thin disk stars since they are more numerous. We believe that most of the pre-vious studies of the thick disk may have included Hercules stars which may have perturbed the results. In this study we have carefully identified such stars.
We have focussed on the following key points : (1) the compilation of all the useful stellar parameters with only very accurate measurements, (2) the compilation of a large sample of disk stars with a significant fraction of thick disk stars, 3) the identification of pure thin disk and thick disk stars with a well defined robust criterion. The stel-lar parameters useful for population studies and used in this paper are the velocities (distances, proper motions, radial velocities), metallicities ([Fe/H]), abundance ratios and ages. The accuracy is guaranteed by selecting only stars within 100 pc of the Sun with a relative error on Hipparcos parallax lower than 10% (ESA 1997), which have been recently submitted to detailed abundance stud-ies from high resolution, high signal to noise spectra. In the last years, several groups have produced studies of el-emental abundances involving a few dozen to hundreds of stars spanning a wide range of metallicity. We have com-bined them in order to build a large catalogue of stars with known elemental abundances. The kinematical clas-sification of stars into the thin and thick disks is the most robust because it is not model dependent and the kine-matical properties of the two populations are well known. Moreover the combination of Hipparcos astrometric mea-surements and radial velocities from echelle spectrographs makes the 3D velocities of nearby stars very accurate. We have assigned stars to the thin disk, the thick disk and the Hercules stream on the basis of their (U, V, W) velocity by computing their probability to belong to the correspond-ing velocity ellipsoid.
We describe in Sect. 2.1 the construction of a large catalogue of elemental abundances from published data. Before combining the data we have analysed the agree-ment of abundances between authors. The distribution of abundances versus metallicity of the whole sample is shown. Sect. 3 describes the age determination and the kinematical data which was used to compute (U,V,W) velocities and orbits. The kinematical classification per-formed to select three subsamples of stars representative of the thin disk, the thick disk and the Hercules stream is described in Sect. 4. In Sect. 5 we report our findings on the chemical properties of the three subsamples. Finally we discuss the age distributions, the lack of a vertical gra-dient in the thick disk and the case of several metal-rich outliers in Sect. 6.
2. The abundance catalogue
2.1. Construction of the catalogue
In order to build a large sample of elemental abundances, we have compiled several studies from the literature pre-senting determinations of O, Na, Mg, Al, Si, Ca, Ti, Fe, Ni abundances. We have chosen in the literature the eleven most significant papers which present large lists of stars (Table 1).
Table 1. List of datasets included in the catalogue with the number of stars in the chosen range of atmospheric parameters (see text) and the method used for the Teff determination (ldr=line depth ratios) : A04 = Allende Prieto et al. (2004), B03 = Bensby et al. (2003), B04a = Bensby et al. (2004), C00 = Chen et al. (2000), E93 = Edvardsson et al. (1993), F00 = Fulbright (2000), G03 = Gratton et al. (2003), M04 = Mishenina et al. (2004), N97 = Nissen & Schuster (1997), P00 = Prochaska et al. (2000), R03 = Reddy et al. (2003)
Reference N Elements Teff determination A04 104 Fe,Si,Ca,Mg,Ti,O,Ni b-y, B-V
B03 66 Fe,Si,Ca,Mg,Ti,Na,Al,Ni FeI
B04a 66 O FeI
C00 90 Fe,Si,Ca,Mg,Ti,O,Na,Al,Ni b-y E93 188 Fe,Si,Ca,Mg,Ti,O,Na,Al,Ni b-y
F00 100 Fe,Si,Ca,Mg,Ti,Na,Al,Ni V-K, B-V, b-y G03 116 Fe,Si,Ca,Mg,Ti,O,Na,Ni B-V, b-y M04 174 Fe,Si,Mg,Ni Hα, ldr N97 29 Fe,Si,Ca,Mg,Ti,O FeI P00 10 Fe,Si,Ca,Mg,Ti,O,Na,Al,Ni FeI R03 181 Fe,Si,Ca,Mg,Ti,Na,Al,Ni b-y
Because authors of spectral analyses do not use the same scales and methods, systematics may exist between their results which cannot be combined without a care-ful analysis and eventually some kind of homogenisation. As most of the eleven studies have stars in common, we were able to measure their agreement. We have observed that disagreements were more frequent in the metal-poor regime, and because we were interested in studying the disk population and specially the interface between the thin disk and the thick disk, we have eliminated all stars with [Fe/H] < -1.3. A larger dispersion observed among cold stars convinced us to build our sample with stars hot-ter than 4500K. The number of stars of the eleven studies which fall within these limits is given in Table 1.
The effective temperature is the most critical parame-ter in spectroscopic analyses and different methods for its determination may lead to inhomogeneous scales. A sys-tematic difference in temperature translates into a system-atic difference in metallicity thus in abundances relative to iron. The eleven studies considered for the catalogue have indeed used various methods, listed in Table 1. Our first concern before combining abundances from different au-thors was to quantify the agreement of their temperature scales. We have used as reference temperatures the
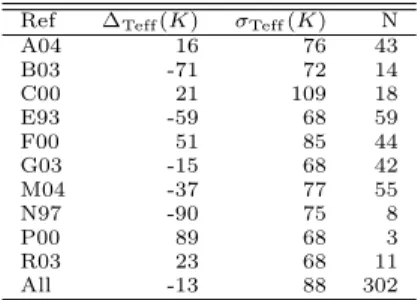
de-terminations by Alonso et al. (1996), Blackwell & Lynas-Gray (1998) and di Benedetto (1998), which are known to be in good agreement in the FGK regime. We have inspected for each paper, the agreement of the tempera-ture scale with the reference one. Table 2 gives the mean differences and dispersions which were obtained. The dis-persions are reasonable, ranging from 68K to 109K, typi-cal of the accuracy of 50-100K generally quoted in spectral analyses. The largest offsets are observed for N97 and P00, however they correspond to the samples with the poorest statistics. For the other studies, the offset is lower than 75K. Such a difference is not expected to strongly affect the abundances. According to M04, a difference of 100K in Teff translates into a difference of 0.07 dex in [Fe/H] and a lower value for other elements.
Table 2.Statistics of the Teff comparison to Alonso et al. (1996), Blackwell & Lynas-Gray (1998) and di Benedetto (1998).
Ref ∆Teff(K) σTeff(K) N
A04 16 76 43 B03 -71 72 14 C00 21 109 18 E93 -59 68 59 F00 51 85 44 G03 -15 68 42 M04 -37 77 55 N97 -90 75 8 P00 89 68 3 R03 23 68 11 All -13 88 302
Most of the determinations of elemental abundances considered here are based on LTE spectral analyses. Two exceptions concern Na by G03 and Mg by M04. Rigourously LTE and NLTE abundances should not be combined because they rely on different physics and may lead to systematic offsets depending on the spectral lines considered and the parameter range of the stars. We have looked for such inconsistencies by comparing NLTE [Mg/H] by M04 and NLTE [Na/H] by G03 to their LTE couterparts by the other authors for stars in common (Figs. 1 and 2). The plots do not reveal systematic effects. For Mg, the mean difference is null with a dispersion of 0.13 dex for 126 stars in common. For Na, the mean differ-ence is also null with a dispersion 0.07 dex for 130 stars in common. The lack of an offset between these abundances led us to keep Na and Mg NLTE determinations in the catalogue in order to enlarge our sample.
The case of oxygen is more complex. Oxygen abun-dances can be determined either from the forbidden [OI] lines at 6300˚A and 6363˚A or from the IR triplet OI lines at 7774˚A . The lines at 7774˚A are strong and clean but affected by NLTE effects, whereas lines at 6300˚A and 6363˚A are weak and blended but unaffected by NLTE effects. According to the IAU recommendations, the lat-est lines are the blat-est indicators. We have thus selected in the considered papers only oxygen abundances on the
LTE 6300˚A scale, obtained either directly or with a cor-rection. E93 have calibrated a correction to pass from the LTE oxygen abundances derived with the 7774˚A line to those derived with the 6300˚A line. C00 have used this transformation, and we have also used it to correct the LTE 7774˚A determinations by N97 and P00. A04 and B04a have used directly the 6300˚A lines. Finally G03 have provided LTE 6300˚A abundances for 22 stars and NLTE 7774˚A determinations for 68 stars. We have only kept the 22 LTE ones. Fig. 3 shows the typical dispersion that af-fects oxygen abundances determined by different authors, even if they are on the same scale. The standard devia-tion of the plotted distribudevia-tion is 0.19 dex (132 values, 0.14 dex when outliers are removed). There are 3 out-liers : HD172051 with [O/H]=+0.47 (A04) and [O/H]=-0.18 (B04a), HD109303 with [O/H]=+0.11 (R03) and [O/H]=-0.40 (C00), HD210027 with [O/H]=+0.60 (A04) and [O/H]=-0.01 (C00). A04 determinations are systemat-ically higher than the others by 0.11 dex and several stars have unexpectedly high values of [O/H] (HD157214 and HD144579 for instance). Considering that the total dis-persion of differences between authors decreases to 0.13 dex (85 values) without A04, we have not considered the oxygen abundances by A04 in the final catalogue. This is beyond the scope of this paper to analyse why A04 doesn’t seem to be on the same [O/H] scale than the other authors.
Fig. 1. Comparaison of [Mg/H] computed under NLTE approximation by M04 and LTE [Mg/H] computed by the other authors. No systematic trend can be observed. The mean difference is null, the dispersion 0.13 dex for 126 stars in common.
We have continued our verification by comparing [Fe/H] and abundance ratios of the different studies having at least 10 stars in common. We have observed the largest systematic differences, ranging from 0.08 to 0.10 dex, for [Ti/Fe] and [Mg/Fe] (A04 vs E93), and for [Mg/Fe] (A04 vs C00). The median offset between the studies which could be compared is 0.02. The largest dispersions con-cern E93 vs C00 for [Ti/Fe] and [Al/Fe] (0.10 dex), and M04 vs A04 for [Fe/H] (0.11 dex). The median dispersion is 0.045 dex (a 3σ rejection of a few outliers was performed to compute these statistics). These values are reasonable, considering realistic error bars 0.10 dex on [Fe/H] and 0.06 dex on abundance ratios. We have thus constructed our
Fig. 2. Comparaison of [Na/H] computed under NLTE approximation by G03 and LTE [Na/H] computed by the other authors. No systematic trend can be observed. The mean difference is null, the dispersion 0.07 dex for 130 stars in common.
Fig. 3.Differences between [O/H] on the LTE 6300˚A scale derived by authors having stars in common.
catalogue of abundances by combining the results of the eleven selected papers, adopting a simple average when several determinations were available for a given star. The final catalogue consists of 743 stars, only available in elec-tronic form at the CDS, Strasbourg. Table 3 gives the number of stars available per element.
Table 3.For each element, number of stars with a deter-mination of abundance
Fe O Na Mg Al Si Ca Ti Ni 743 415 568 725 509 743 641 630 739
2.2. Abundance trends in the whole sample
For each element X, Fig. 4 represents the distribution of the sample in the plane [X/Fe] vs [Fe/H].
As expected, α elements (Mg, Si, Ti and Ca) show a similar behaviour with a decreasing trend as ity increases, the distribution being flat at solar metallic-ity. There are however some differences between these ele-ments : Mg presents a higher dispersion at low metallicity, contrary to Ca which deacreases more regularly. Oxygen,
which is also an α element continues to decrease in the metal rich regime and exhibits a large spread. The large dispersion of [O/Fe] might be cosmic, but also due to mea-surement errors and inhomogeneities in the studies which were combined.
Interestingly, it seems that Al has the same behaviour as α elements, a similarity which has already been re-ported by E93 and B03. The two main features concern-ing Na are a change of dispersion at [Fe/H]≃-0.70, the metal-rich part showing a very low dispersion, and a rise at super-solar metallicities. The remarkable low dispersion of [Ni/Fe] in the whole range of metallicity, measured to be 0.04 dex implies (1) that the different studies of our compilation are in excellent agreement for this element, (2) that the cosmic scatter is very low. As an iron peak el-ement, Ni follows very well the metallicity. Most elements, except oxygen, show a rise of enhancement with respect to iron at [Fe/H]>0. Oxygen is the only element which is depleted in the metal rich regime. According to current models of chemical evolution of the Galaxy, α elements like O and Mg have the same source of production, hence should have the same trends. This is not observed in the metal rich regime but an interpretation falls outside the scope of this paper.
The Sun appears to be slightly deficient in all elements compared to stars with similar metallicity. The peculiarity of the solar abundance ratios was previously noticed by A04 and E93 with a tentative explaination related to its larger age.
3. Velocities, orbits and ages
In order to compute accurate velocities (U,V,W) we have first cross-correlated the abundance catalogue with Hipparcos, selecting stars with π >10 mas and σπ
π <0.10.
Then we have searched radial velocities in the follow-ing sources : Prugniel & Soubiran (2001), Nidever et al. (2002), Nordstr¨om et al. (2004), Gratton et al. (2003), Barbier-Bossat et al. (2000). Positions, distances, proper motions and radial velocities have been combined to com-pute the 3 components (U,V,W) of the spatial velocities with respect to the Sun. For most stars the uncertainty on the components of the spatial velocity is lower than 1
km s−1 .
We have been tempted to adopt the ages derived by Nordstr¨om et al. (2004) for 447 stars that we have in com-mon with this catalogue. However their isochrone ages have been computed with photometric metallicities, of much lower accuracy than the spectroscopic ones that are available for our stars. Instead the derivation of ages was very kindly done for us by Fr´ed´eric Pont making use of the Bayesian method of Pont & Eyer (2004) together with the high quality data (Hipparcos luminosities and spectro-scopic temperatures and metallicities) that we have com-piled and the theoretical isochrones from Padova (Girardi et al. 2000). Unfortunatly the current version of the soft-ware does not use α-enhanced isochrones. On average the α-enhancement of the most metal-poor stars of our
sam-Fig. 4.[X/Fe] vs [Fe/H]
ple is [α/Fe]=+0.3. Bensby et al (2004b) have shown how α-enhancement changes isochrone ages. In their example at [Fe/H]=-0.70 (see their Fig. 3), the shift between the isochrones at [α/Fe]=+0.3 and [α/Fe]=0.0 may reach 5 Gyr in the evolved parts. Ages may be overestimated when the α-enhancement is not taken into account. However it can be noticed in their Fig. 3 that the difference between enhanced and non-enhanced isochrones is equivalent at the first order to a temperature shift. As explained in Pont & Eyer (2004), the temperature match between observa-tions and models is one of the key point of the method.
The temperature shift which is performed to make the model match the observations at a given metallicity cor-rects also the effects due to the neglected [α/Fe] ratio. With the Bayesian method the most probable age is es-timated together with a probability distribution function which was used to define a subsample of well defined ages. Ages have been computed for all stars, but then we have eliminated those corresponding to stars showing a wide or asymetrical age probability distribution function, or with a position in the HR diagram far from the isochrones of
same metallicity. With those restrictions we have good es-timations of ages for 322 stars.
The orbital parameters have been computed by inte-grating the equations of motion in the galactic model of Allen & Santillan (1993). When available we have adopted the age of the star as the integration time, otherwise a de-fault value of 5 Gyr was adopted. The adopted velocity of the Sun with respect to the LSR is (9.7, 5.2, 6.7) km s−1 (Bienaym´e 1999, U positive towards the galactic center), the solar galactocentric distance R⊙ = 8.5 kpc and
circu-lar velocity Vlsr = 220 km s−1 . In order to focus on the
populations of the disk, we have eliminated from the sam-ple several stars with halo kinematics. The final samsam-ple with abundances, velocities and orbits includes 639 stars. Figs. 5 and 6 present the dispersion of the vertical ve-locities W and the eccentricities of the orbits in several bins of metallicity. Three regimes can be distinguished. The three bins of highest metallicity show a nearly flat distribution with σW ≃ 15 km s−1 and ecc ≃ 0.09
show-ing that this metallicity interval is dominated by the thin disk. Interestingly the bin at [Fe/H]=+0.26 has σW = 20
km s−1 suggesting that there are super metal rich stars with hotter vertical kinematics. The increase of σW and
ecc as metallicity decreases in the next three bins reflects the mixture of the thin disk and the thick disk, with a growing number of thick disk stars. The last two bins of lowest metallicity saturate at σW ≃ 45 km s−1 and
ecc ≃ 0.45. A smooth AMR is visible in Fig. 7. Several old super metal-rich stars are responsible of the jump and large dispersion in the last bin of metallicity. The same stars have also hot vertical kinematics.
Fig. 5. σW vs [Fe/H] of the whole sample in several bins
of metallicity. Error bars correspond to the standard error for σW(σW/
√
2N ) and standard deviation for [Fe/H].
4. Kinematical classification
In order to investigate the abundance trends in the thin disk and the thick disk separately, we have classified the stars into these populations, using the kinematical infor-mation. We have performed such a deconvolution in previ-ous studies (Soubiran et al. 2003 and M04) where we have noticed that metal rich stars with high eccentricity but low
Fig. 6. Eccentricity of the orbits vs [Fe/H] of the whole sample in several bins of metallicity. Error bars correspond to the standard deviations.
Fig. 7. Age vs [Fe/H] in several bins of metallicity for stars having well defined ages. Error bars correspond to the standard deviations.
scale height were assigned to the thick disk whereas they could have another origin. The recent study by Famaey et al. (2004) has confirmed that 6.5% of the stars in the solar neigbourhood belong to the Hercules stream, which has a mean rotational motion with respect to the Sun very similar to that of the thick disk (V = −51 km s−1 ) with a significant radial motion of U = −42 km s−1 . Famaey et al. (2004) have identified a total of six kine-matical structures in their sample of nearby giants : the background stars corresponding to the mixed population of the thin disk, the high velocity group corresponding to the thick disk, the Hercules stream, the young group, the Hyades-Pleiades supercluster and the Sirius moving group. The three later groups correspond to young stars with kinematics typical of the thin disk. As can be seen in their Fig. 9, these groups of young stars appear as con-centrations inside the velocity ellipsoid of the thin disk. They represent a peculiar class of thin disk stars and were not considered separately in this study. On the contrary the Hercules stream is of high interest for our probe of the thin disk to thick disk interface since its kinematics is exactly intermediate between to two populations. The authors explain that this stream has a dynamical origin.
Contrary to a moving group which involves stars which were born at the same place and at the same time, a dy-namical stream affects stars of any age and population. The effect of the bar in the central parts of the Galaxy is to move stars onto excentric orbits which tend then to mimic thick disk stars. Such stars, mainly thin disk stars with perturbed kinematics, could have polluted previous samples of thick disk stars selected on kinematical crite-ria and thus must be taken into account. The kinematical classification that we have performed is based on the as-sumption that our whole catalogue is dominated by three populations, the thin disk, the thick disk and the Hercules stream, all having gaussian velocity distributions.
We have computed for every star its probability to be-long to each of the three populations on the basis of its (U,V,W) velocity and the gaussian velocity ellispoid of the corresponding population (equations can be found in M04). The kinematical parameters (mean, standard devia-tion, vertex deviation) which define the velocity ellipsoids, as well as the proportions of the three populations in the sample, have to be known. We adopt for the kinematical parameters those determined by Soubiran et al. (2003) for the old thin disk and the thick disk and by Famaey et al. (2004) for the Hercules stream (Table 4). The frac-tion of each populafrac-tion in the sample is more difficult to evaluate. We are aware that our whole sample might be biased in favour of high velocity and metal poor stars due to the subject of the eleven studies we are based on. Consequently the proportion of thick disk and Hercules stars is expected to be higher than in the complete sam-ple of Famaey et al. (2004) which is more representative of the content of the solar neighbourhood. In a similar way as described in M04 we have applied to our sample of (U,V,W) a non-informative algorithm of deconvolution of gaussian distributions which showed that 72% of the stars have kinematics typical of the thin disk and 28% typical of the thick disk or the Hercules stream. Adopting the same ratio of thick disk to Hercules stream as Famaey et al. (2004), we have considered that 19% of our sample correspond to the thick disk, 9% to the Hercules stream.
Table 4.Kinematical parameters of the three considered groups and their proportion in our sample.
thin disk thick disk Hercules
p (%) 72 19 9 U ( km s−1) 0 0 -42 V ( km s−1) -12 -51 -51 W ( km s−1) 0 0 -7 σU ( km s− 1 ) 39 63 26 σV ( km s− 1 ) 20 39 9 σW( km s− 1 ) 20 39 17 lv(deg) 0 0 -5.7
According to the computed probabilities, we have se-lected three subsamples representative of the thin disk, the thick disk and the Hercules stream. The thin disk and the thick disk samples include respectively 428 and 84
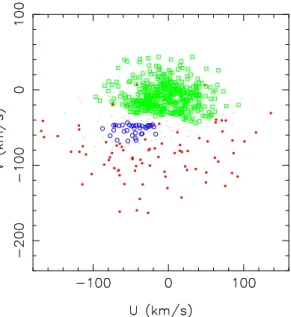
stars having a probability higher than 80% to belong to these populations. This probability cut was chosen as a compromise between having a sufficient number of thick disk stars and avoiding the contamination of the sample with stars with intermediate kinematics. It is more diffi-cult to isolate Hercules stars since their velocity distribu-tion is greatly overlaping that of the thin and thick disks. Consequently there are only 5 stars with a probability higher than 80% to belong to the Hercules stream. We had to lower the probability limit down to 50% to obtain 44 stars for the Hercules sample. Only 81 stars could not be classified into one of the three groups. These remaining stars represent a mixture of intermediate stars which are not considered in the following since our aim to work on samples as pure as possible. The (U,V) plane and Toomre diagram of the whole sample is shown in Fig. 8 and Fig. 9, the three subsamples being highlighted in different colours and symbols. The Hercules stream is clearly visible as a concentration between the two disks.
Fig. 8.The sample of 639 stars plotted in the (U,V) plane. Thick disk stars are represented by red dots, thin disk stars by open green squares and Hercules stars by open blue circles. The small dots correspond to stars which could not be classified into the 3 subgroups.
How does our kinematical classification compare with those previously performed in other works ? A04, E93, F00, G03 and N97 have not considered the thick disk specifically. P00 has selected 10 thick disk stars with -1.1 ≤ [Fe/H] ≤ -0.4 and Zmax > 600 pc and -20 ≤ VLSR≤ -100
km s−1 . Only 5 of them remain in our catalogue due to our restrictions on distances, all of them classified into the thick disk. If we apply P00’s criteria to our catalogue, we only select 22 thick disk stars. These criteria are thus very efficient to avoid intermediate or Hercules stars but they are far too restrictive to construct a large thick disk sam-ple. C00 have proposed their stars with [Fe/H] ≤ -0.6 and V ≤ -40 km s−1to be thick disk stars. The same criterion
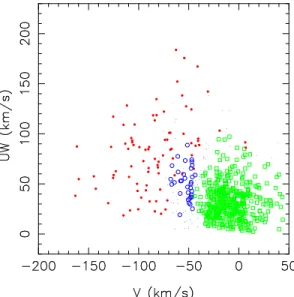
Fig. 9. Like Fig. 8, but in the Toomre diagram : U W = √
U2+ W2 km s−1
applied to our catalogue leads to a mixed sample including 58 thick disk stars, 13 Hercules stars, 1 thin disk star and 12 intermediate stars. R03 have performed a more com-plicated selection of thick disk stars involving metallicity, mean of peri- and apogalactic distances Rm, V velocity
and age. Doing the same without the age restriction (age > 10 Gyr), we select 25 thick disk stars and 4 Hercules stars. Taking the age restriction into account, only 3 thick disk stars are selected. These results show that a restric-tion on Zmax is more efficient than on V or Rmto isolate
pure thick disk stars. Nevertheless a restriction on [Fe/H] is incompatible with the study of the thick disk’s metal-licity distribution and abundance trends. The kinematical classification performed by B03 is the only one which is quite similar to ours in its principle although they have used probability ratios. Among their 21 thick disk stars, only 2 of them (HD210483 and HD212231) are not part of our thick disk sample because of our high probability cut (they have a probability of 78% and 75% respectively to belong to the thick disk with our classification). Among their 45 thin disk stars, HD003735 has a high probability to belong to the Hercules stream (73%) while HD210277 is intermediate between the thin disk (probability 55%) and the Hercules stream (probability 31%). The classifi-cation by M04 is strictly the same as ours, but without the Hercules stream. Among their 30 thick disk stars, 5 have moved into the Hercules stream, and 5 are transition stars which could not be classified.
The catalogue including abundances, kinematical and orbital parameters, ages, membership probabilities is available at the CDS, in the form of a single table. For each star it contains the following information (when avail-able) : Column 1 lists the name of the source, Column 2 gives the metallicity [Fe/H], Column 3 to 10 give the abun-dances relative to iron of O, Na, Mg, Al, Si, Ca, Ti and Ni, Columns 11 to 13 give the three components (U,V,W) of the heliocentric galactic velocity, Columns 14 to 17 give
the orbital parameters Rmin, Rmax, Zmax, eccentricity, Columns 18 and 19 give the age and its relative error, Columns 20 to 22 give the membership probability of the star to belong to the thin disk, the thick disk and the Hercules stream respectively.
5. Abundance trends
The abundance trends for each kinematical group are shown in Fig. 10. The number of stars involved in this study has allowed us to bin the data in metallicity to high-light the abundance features of each population. Table 5 gives the mean abundance, standard deviation and num-ber of stars in each metallicity bin. The observed features are the following :
– the thin disk and the thick disk overlap greatly in metallicity : there are stars with thin disk kinematics down to [Fe/H]=-0.80 and there are stars with thick disk kinematics at solar metallicity and above, with one of them in the super metal rich regime ([Fe/H] > +0.25).
– the α elements (Mg, Si, Ti and Ca), as well as Al show the same behaviour : at solar metallicity the three pop-ulations are confounded, from [Fe/H]≃ -0.3 to [Fe/H]≃ -0.7, the thin and thick disks show parallel trends with an enhancement of these elements with respect to Fe in the thick disk
– in the range -0.70 < [Fe/H] < -0.30, [Mg/Fe] and [Al/Fe] of the thick disk exceed that of the thin disk by ∼ 0.15 dex
– a change of slope (a ”knee”) is visible in the thick disk for Si and Ca, less clearly for Mg, at [Fe/H] ≃ -0.7 – the only α element showing a knee in the thin disk is
O at [Fe/H] ≃ -0.5, the decrease being steep above this value
– for O the three populations are confounded but the most metal-poor bin exhibits a large enhancement of [O/H]=+0.52
– for Na and Ni the three populations are confounded – in the range -0.60 < [Fe/H] < -0.20, [Na/Fe] declines
from ∼ +0.10 dex to ∼ 0.00 dex
– super metal rich stars of the thin disk exhibit a pro-nounced overabundance of Na and Ni
– there are Hercules stars in the whole range of metallic-ity, which exhibit abundances trends similar to those of the thin disk
The overlapping metallicity distributions of the thin disk and the thick disk has been previously established (B03, M04). A question which is not yet answered is where the metallicity distribution of two disks stop. Concerning the metal-poor side of the thin disk, we find 47 stars with [Fe/H] < -0.50 among the 428 thin disk stars, the low-est value ([Fe/H]=-0.83) being reached by HD134169. Our sample is biased and may exagerate the fraction of metal-poor thin disk stars, but the existence of such stars is real and cannot be explained by measurement errors only. The
Table 5.Mean abundance, standard deviation and number of stars in each metallicity bin
bin [Fe/H] [Si/Fe] [Ca/Fe] [Mg/Fe] [Ti/Fe] [O/Fe] [Na/Fe] [Al/Fe] [Ni/Fe] Thick disk [Fe/H] < -1.00 -1.12 0.35 0.29 0.45 0.23 0.51 0.00 0.26 0.03 0.07 0.07 0.05 0.07 0.05 0.12 0.11 0.10 0.02 8 8 8 7 8 8 8 6 8 -1.00 ≤ [Fe/H] < -0.75 -0.85 0.33 0.29 0.42 0.26 0.30 0.15 0.32 0.04 0.06 0.07 0.06 0.05 0.06 0.02 0.07 0.11 0.04 16 16 15 16 15 3 15 13 16 -0.75 ≤ [Fe/H] < -0.50 -0.63 0.24 0.20 0.35 0.23 0.27 0.11 0.30 0.05 0.07 0.09 0.06 0.10 0.07 0.10 0.06 0.11 0.04 31 31 28 31 28 13 28 27 31 -0.50 ≤ [Fe/H] < -0.25 -0.39 0.16 0.16 0.26 0.21 0.25 0.08 0.24 0.03 0.05 0.07 0.07 0.11 0.12 0.13 0.04 0.11 0.04 18 18 18 18 18 14 16 16 18 -0.25 ≤ [Fe/H] -0.05 0.07 0.03 0.09 0.09 0.11 -0.02 0.10 0.03 0.16 0.05 0.06 0.09 0.09 0.14 0.06 0.07 0.05 11 11 9 11 9 8 8 8 11 Thin disk [Fe/H] < -0.60 -0.68 0.18 0.14 0.22 0.16 0.29 0.12 0.16 0.03 0.07 0.10 0.06 0.10 0.10 0.09 0.08 0.12 0.03 21 21 21 19 21 14 20 16 21 -0.60 ≤ [Fe/H] < -0.45 -0.53 0.12 0.08 0.15 0.13 0.27 0.07 0.10 0.01 0.04 0.07 0.05 0.06 0.09 0.10 0.06 0.08 0.04 37 37 35 36 33 23 33 33 37 -0.45 ≤ [Fe/H] < -0.30 -0.37 0.07 0.06 0.10 0.07 0.24 0.04 0.08 0.00 0.04 0.04 0.05 0.07 0.08 0.13 0.05 0.07 0.04 86 86 81 85 80 65 79 77 85 -0.30 ≤ [Fe/H] < -0.15 -0.22 0.06 0.04 0.06 0.07 0.20 0.01 0.05 0.00 0.04 0.05 0.05 0.06 0.08 0.11 0.06 0.05 0.04 97 97 82 96 80 57 71 70 97 -0.15 ≤ [Fe/H] < 0 -0.08 0.06 0.04 0.04 0.05 0.14 0.00 0.06 0.01 0.04 0.04 0.05 0.06 0.08 0.13 0.05 0.05 0.04 72 72 53 69 50 34 38 39 71 0 ≤ [Fe/H] < 0.15 0.06 0.06 0.03 0.06 0.05 -0.01 0.04 0.08 0.03 0.05 0.04 0.05 0.06 0.06 0.09 0.07 0.07 0.05 83 83 65 81 65 38 53 49 82 0.15 ≤ [Fe/H] 0.24 0.10 0.04 0.06 0.08 -0.10 0.11 0.10 0.09 0.07 0.06 0.07 0.10 0.10 0.06 0.07 0.05 0.06 32 32 27 32 27 14 19 19 32 Hercules stream [Fe/H] < -0.50 -0.82 0.23 0.20 0.32 0.25 0.19 0.02 0.21 0.03 0.20 0.09 0.09 0.08 0.17 0.15 0.11 0.13 0.03 8 8 8 8 8 4 6 3 8 -0.50 ≤ [Fe/H] < -0.20 -0.34 0.11 0.06 0.14 0.07 0.23 0.05 0.10 0.02 0.08 0.07 0.05 0.09 0.07 0.13 0.04 0.08 0.04 17 17 13 15 13 11 12 11 17 -0.20 ≤ [Fe/H] 0.02 0.07 0.04 0.04 0.07 0.08 0.02 0.10 0.04 0.12 0.03 0.07 0.05 0.08 0.14 0.05 0.04 0.04 19 19 11 18 11 6 7 7 19
super metal rich part of the thin disk seems to have a dif-ferent chemical behaviour than the rest of the thin disk, the most obvious difference being observed for Na and Ni. This raises the question wether these stars have the same origin as the other thin disk stars. Looking in detail at their velocity shows that half of the thin disk stars with [Fe/H] > +0.20 have a motion consistent with that of the Hyades-Pleiades supercluster. Famaey et al. (2004) pro-pose this stream to have originated from a common large molecular cloud, radially perturbed by a spiral wave. Our observation of similar high metallicities and peculiar abun-dance ratios for these stars is indeed in good agreement with the hypothesis of their formation from common ma-terial.
Concerning the thick disk, our data clearly prove the existence of metal-rich high velocity stars. However there are arguments in favour and against the fact that the thick disk extends at solar metallicity and even beyond. M04 have discussed this issue and proposed the thick disk to stop at [Fe/H] ≃ -0.30 on the basis that more metal rich stars may belong to the Hercules stream (whose velocity ellipsoid was not clearly defined at that time). Here we have carefully eliminated Hercules stars from the thick disk sample but metal-rich stars remain. Moreover
Feltzing (2004) claims to have observed metal-rich stars at a large distance above the plane where the thick disk dominates. If the thick disk really extends at solar metal-licity then one has to explain why its α abundance trends are so different from the thin disk, except at solar metal-licity. The case of these metal-rich high velocity stars is further discussed in the next section.
The conclusion about the overlapping metallicity dis-tributions of the thin and thick disks is that [Fe/H] is a very bad parameter by itself to identify the disk popula-tions.
The α enhancement with respect to iron of the thick disk has been established a few years ago by Gratton et al. (1996) and Fuhrmann (1998) but evidence of the decreasing parallel trends for the thin and thick disks is more recent and results from a careful kinematical decon-volution of the two disks by B03 and M04. The ”knee”, ie the change of slope from a constant enhancement to a decreasing one, is interpreted by the typical signature of SNIa to the enrichment of the interstellar gas from which the later thick disk stars formed (Feltzing et al. 2003). Our contribution to this issue is to quantify the enhancement to be +0.14 dex in Mg, a value larger than the measurement errors. The enhancement of the other α
elements, Si, Ca and Ti, is lower but their dispersion in the thick disk is also lower. The very good correlation of Al and Mg has been discussed by E93 on the point of view of yields of supernovae of different kind. On the point of view of galactic structure and diagnosis to deconvolve the populations, [Al/Fe] turms to be a very good parameter. We have tested the efficiency of the parameters [Mg/Fe], [α/Fe]=0.25([Mg/Fe]+[Si/Fe]+[Ca/Fe]+[Ti/Fe]) and [Mg+Al/Fe]=0.5([Mg/Fe]+[Al/Fe]) by performing linear regressions with [Fe/H]. We obtain the following relations (restricted to -0.80 < [Fe/H] < -0.30) :
For the thin disk :
[Mg/Fe]=-0.37[Fe/H]-0.040, σ=0.067 dex [α/Fe]=-0.29[Fe/H]-0.029, σ=0.052 dex [Mg+Al/Fe]=-0.29[Fe/H]-0.021, σ=0.061 dex For the thick disk :
[Mg/Fe]=-0.41[Fe/H]+0.097, σ=0.092 dex [α/Fe]=-0.30[Fe/H]+0.071, σ=0.069 dex [Mg+Al/Fe]=-0.30[Fe/H]+0.128, σ=0.095 dex Comparing for each abundance ratio the offset (∆) between the thin and thick disks with the total disper-sion (σT), the most favourable ratio is [Mg+Al/Fe] with
∆ = 1.31σT (∆=0.148 dex, σT=0.113 dex), whereas
∆ = 1.20σT (∆=0.137 dex, σT=0.114 dex) is obtained
for [Mg/Fe] and ∆ = 1.16σT (∆=0.100 dex, σT=0.086
dex) for [α/Fe].
If there is a jump in the enhancement of oxygen at [Fe/H]<-1.0, mainly due to the contribution of G03, our data do not show any enhancement of [O/Fe] in the thick disk similar to the other α elements, a feature which was observed by B04a. As mentioned previously, the disper-sions are large and may reflect the larger uncertainties which affect O abundance determinations as compared to other elements. There is however a clear knee at [Fe/H]=-0.5, the decrease of [O/Fe] being steeper at larger metal-licites which suggests an abrupt change in the relative role of SN I and SN II.
The fact that the Hercules stream occupies a large range of metallicity with abundance trends similar to those of the thin disk is in good agreement with the dy-namical hypothesis described by Famaey et al. (2004) since the perturbation of a rotating bar is supposed to affect non contemporary but essentially thin disk stars.
6. AMR, vertical gradient, metal-rich stars
Fig. 11 and Fig. 12 show that the thick disk is older than the thin disk in the whole range of metallicity. Thick disk stars range from 7 to 13 Gyr with an average of 9.6 ± 0.3 Gyr (median 9.5 Gyr). Several thin disk stars are found
with ages greater than 10 Gyr, for instance HD127334 and HD190248 which are also metal-rich and appear as outliers. An AMR is visible in the thin disk, in the sense the most metal-poor thin disk stars are older than those with solar metallicity by 2.3 Gyr on average. The AMR in the thick disk is more difficult to establish : the statis-tic is poor, only 29 stars having an age determination. It depends also wether one classify the metal-rich stars into the thick disk or not. Bensby et al. (2004b) have observed an AMR in the thick disk from a larger sample kinemat-ically selected, but with ages determined from photomet-ric metallicities. They obtain median ages of 13.0 Gyr at [Fe/H]=-0.60 and 11.2 Gyr at [Fe/H]=-0.40. Our age scale is lower but we obtain a similar difference of age in the same metallicity bins (10.1 Gyr and 8.1 Gyr). The metal-rich bin of the thick disk does not follow the same trend. If one consider this bin to be really part of the thick disk, then the AMR hypothesis is not valid anymore. However we have several arguments against the metal rich high ve-locity stars to be part of the thick disk (see below) and thus we interpret our data as consistent with the existence of an AMR in the thick disk. Bensby et al. (2004b) have estimated that star formation was active in the thick disk during 5 Gyr, but this result is based on a wide metallicity distribution up to [Fe/H]=0. Our results favour a shorter timescale for star formation, of the order of 2-3 Gyr.
Our data are also compatible with a hiatus in star for-mation between the forfor-mation of the thick disk and the thin disk. In the range -0.80 < [Fe/H] < -0.30, the mean age of the two disks differs by 4 Gyr. The reality of this off-set is related to the scatter of the age distribution in each population. The comparison with the Hercules stream is very interesting in that sense. According to Fig. 11, the Hercules stream is made of stars of all ages. Consequently the age dispersion in its metallicity bins is very large. On the contrary, the thin and thick disks show much lower dis-persions. The age dispersion in each bin results from the convolution of the cosmic scatter and the measurement er-rors of individual ages. We are aware that the uncertainty on ages is large despite the care we took to construct a clean sample. The median of the estimated errors is 2.7 Gyr. This means that the cosmic scatter of ages in each metallicity bin is quite low and the age offset between the two disks significant, pointing to a possible interruption of star formation at the end of the thick disk formation and the beginning of the thin disk formation. Incidentaly the large age dispersion of the Hercules stream favours the dynamical hypothesis proposed by Famaey et al. (2004) as its origin.
The existence of a vertical gradient of metallicity in the thick disk has important consequence for the choice of the most probable scenario of its formation. The relation be-tween the maximal height above the plane, Zmax, and the metallicity is shown in Fig. 13. As previously mentioned in Soubiran et al. (2003) and M04, a transition occurs at [Fe/H]=-0.3. For stars more metal-poor than this value, the relation Zmax vs [Fe/H] is flat, consistent with no vertical gradient.
Fig. 10.Averaged [X/Fe] vs [Fe/H] per bin of metallicity in the thin disk (green squares) in the thick disk (red filled circles) and in the Hercules stream (blue open circles). Errors bars correspond to the standard deviations around the mean value in each bin.
The question wether the stars assigned to the thick disk in the highest metallicity bin are real thick disk stars is important to clarify the extent of the metallicity distri-bution of the thick disk and the existence of an AMR. It can be seen that thick disk stars with [Fe/H] > -0.3 are of two kinds : 8 stars have a flat distribution (Zmax < 300 pc) which is suspect for thick disk stars, whereas 3 stars appear as outliers with Zmax > 1 kpc. The 8 stars come from A04, B03, M04 and R03. Therefore their distribu-tion is not due to a peculiar selecdistribu-tion bias of one of the
eleven papers used to construct our sample. The 3 outliers have also been studied by several authors : HD003628 by B03, F00 and G03, HD145148 by B03 and HD190360 by B03 and M04. It is worth noticing that the combination of the eleven papers used to construct the catalogue of abun-dance did not fill the gap of thick disk stars having [Fe/H] > 0 and 300 pc < Zmax < 1 kpc. Finally stars with [Fe/H] > -0.3 assigned to the thick disk differ from the rest of the thick disk on three points : their vertical distribution is inhomogeneous, their α abundances are similar to that of
Fig. 11.Age vs [Fe/H] for stars having well defined ages. As in Fig. 8 and Fig. 9, the different symbols indicate thin disk, thick disk and Hercules stars.
Fig. 12.Age vs [Fe/H] for stars having well defined ages. As in Fig. 8 and Fig. 9, the different symbols indicate thin disk, thick disk and Hercules stars.
the thin disk, they do not follow the AMR of the thick disk. Their nature has still to be clarified with a complete sample.
7. Summary
We have compiled a large catalogue of high quality stel-lar parameters of FGK stars to probe the properties of the thin disk and the thick disk in the metallicity inter-val -1.30 < [Fe/H] < +0.50. This catalogue includes 743 stars with abundance ratios of several α and iron peak elements, 639 stars with abundance ratios and accurate (U, V, W) velocity and orbits, and 322 stars with abun-dance ratios, kinematical data and age estimations. All these data are available in a form of a single electronic table at the CDS. We have used these data to investigate the metallicity, abundance ratios and age distributions of three kinematical groups with well defined velocity ellip-soids. Three subsamples have been selected on the basis of (U, V, W) velocities to be representative of the thin disk
Fig. 13.Zmax, the maximal distance to the plane reached by the orbit, in several bins of metallicity for thick disk stars.
(428 stars), of the thick disk (84 stars) and the Hercules stream (44 stars).
Our results confirm well established previous findings :
– The thin disk and the thick disk overlap in metallic-ity and exhibit parallel slopes of [α/Fe] vs [Fe/H] in the range -0.80 < [Fe/H] < -0.30, the thick disk being enhanced.
– The thick disk is older than the thick disk.
We bring new constraints on more controversial issues :
– The thin disk extents down to [Fe/H]=-0.80 and ex-hibits low dispersions in its abundance trends. – The thick disk also shows smooth abundance trends
with low dispersions. The change of slope which reflects the contribution of the different supernovae to the ISM enrichment is visible in [Si/Fe] vs [Fe/H] and [Ca/Fe] vs [Fe/H] at [Fe/H] ≃ -0.70, less clearly in [Mg/Fe] vs [Fe/H].
– An AMR is visible in the thin disk, the most metal-poor stars having 6.2 Gyr on average, those with solar metallicity 3.9 Gyr.
– Ages in the thick disk range from 7 to 13 Gyr with an average of 9.6 ± 0.3 Gyr. There is a tentative evidence of an AMR extending over 2-3 Gyr.
– We do not find any evidence of a vertical metallicity gradient in the thick disk.
– [O/Fe] decreases in whole metallicity range with a change of slope at [Fe/H]=-0.50.
– The most metal rich stars assigned to the thin disk do not follow its global trends. They are significantly enhanced in all elements (particularly in Na and Ni) except in O which is clearly depleted. They have also a larger dispersion in age. Half of these stars are proba-ble members of the Hyades-Pleiades supercluster, two others are surprisingly old.
– The slope of [α/Fe] vs [Fe/H] in the interval -0.80 < [Fe/H] < -0.30 has been estimated for the two disks. The enhancement of α elements in the thick disk has been quantified to be +0.10 dex. [Mg/Fe] is more ef-ficient than [α/Fe] to separate the two disks with an offset of +0.14 dex. Combining [Al/Fe] and [Mg/Fe] is even better with an offset of +0.15 dex between the two disks and a lower dispersion.
– The age difference between the thin and thick disks has been quantified to be 4 Gyr suggesting an interruption in star formation between their formation
– The Hercules stream is found to span the whole metal-licity and age range. Its chemical properties are similar to those of the thin disk. This favours the dynamical hypothesis for its origin, related to the influence of the central bar of the Galaxy which affects non contempo-rary stars.
– Metal-rich stars assigned to the thick disk do not follow its global trends. The nature of these stars has to be clarified.
In this paper we have focussed on observational facts. The next step is to confront them with predictions of mod-els. We believe that this dataset and our findings bring new strong constraints to models of formation of the two components of the galactic disk, and to models of chemical evolution.
Acknowledgements. We warmly thank Fr´ed´eric Pont who kindly computed the ages with his Bayesian method. This re-search has made use of the SIMBAD and VIZIER databases, operated at CDS, Strasbourg, France. It has used data from the ESA Hipparcos satellite (Hipparcos and Tycho–2 catalogues).
References
Allen, C., Santillan, A., 1993, RMxAA, 25, 39
Allende Prieto, C., Barklem, P.S., Lambert, D.L., Cunha, K., 2004, A&A, 420, 183 (A04)
Alonso A., Arribas S., Martinez-Roger C., 1996, A&AS, 117, 227
Barbier-Brossat, M., Figon, P., 2000, A&AS, 142, 217 Bensby, T., Feltzing, S., & Lundstr¨om, I, 2003, A&A, 410, 527
(B03)
Bensby, T., Feltzing, S., & Lundstr¨om, I, 2004a, A&A, 415, 155 (B04a)
Bensby, T., Feltzing, S., & Lundstr¨om, I, 2004b, A&A, 421, 969
Blackwell, D.E., Lynas-Gray, A.E., 1998, A&AS, 129, 505 Bienaym´e O., 1999, A&A 341, 86
Chen, Y.Q., Nissen, P.E., Zhao, G., Zhang, H.W., and Benoni, T., 2000, A&AS, 141, 491 (C00)
di Benedetto, G.P., 1998, A&A, 339, 858
Edvardsson, B., Andersen, J., Gustafsson, B., Lambert, D.L., Nissen, P.E., & Tomkin, J., 1993, A&A, 275, 101 (E93) ESA, 1997, The HIPPARCOS and TYCHO catalogues.
Noordwijk, Netherlands: ESA Publications Division, 1997 Famaey, B., Jorissen, A., Luri, X., Mayor, M., Udry, S.,
Dejonghe, H., Turon, C., 2005, A&A 430, 165
Feltzing, S., Bensby, T., & Lundstr¨om, I., 2003, A&A, 397, L1
Feltzing, S., 2004, Chemical Abundances and Mixing in Stars in the Milky Way Galaxy and its Satellites, ESO Astrophysics Symposia, ed. L. Pasquini & S. Randich (Springer-Verlag Press), astro-ph/0411172
Fuhrmann, K., 1998, A&A, 338, 161 Fulbright, J.P., 2000, AJ, 120, 1841 (F00)
Girardi L., Bressan A., Bertelli G., Chiosi C., 2000, A&AS 141, 371
Gratton, R.G., Carretta, Claudi, R., Lucatello,S., and Barbieri, M., 2003, A&A, 404, 187 (G03)
Gratton, R.G., Carretta, E., Mateucci, F., and Snenden, C., 1996, in formation of the Galactic Halo...Inside and Out, ed. H. Morisson, & A. Sarajedini, ASP Conf.Ser., 92, 307 Mishenina, T.V., Soubiran, C., Kovtyukh, V.V., Korotin, S.A.,
2004, A&A, 418, 551 (M04)
Nidever, D.L., Marcy, G.W., Butler, R.P., Fischer, D.A., Vogt, S.S., 2002, ApJS, 141, 503
Nissen, P.E., Schuster, W.J., 1997, A&A 326, 751 (N97) Nordstr¨om, B., Mayor, M., Andersen, J., Holmberg, J., Pont,
F., Jørgensen, B. R., Olsen, E. H., Udry, S., Mowlavi, N., 2004, A&A, 418, 989
Pont, F., Eyer, L., 2004, MNRAS, 351, 487
Prochaska, J.X., Naumov, S.O., Carney, B.W., McWilliam, A., & Wolfe, A.M., 2000, ApJ, 120, 2513 (P00)
Prugniel, P., Soubiran, C., 2001, A&A, 369, 1048
Reddy, B.E., Tomkin, J., Lambert, D.L., & Allende Prieto, C., 2003, MNRAS, 340, 304 (R03)
Soubiran, C., Bienaym´e, O., & Siebert, A., 2003, A&A, 398, 141

![Fig. 3. Differences between [O/H] on the LTE 6300˚ A scale derived by authors having stars in common.](https://thumb-eu.123doks.com/thumbv2/123doknet/14609233.545192/5.918.102.405.372.564/fig-differences-scale-derived-authors-having-stars-common.webp)
![Fig. 5. σ W vs [Fe/H] of the whole sample in several bins of metallicity. Error bars correspond to the standard error for σ W (σ W / √](https://thumb-eu.123doks.com/thumbv2/123doknet/14609233.545192/7.918.462.755.67.271/fig-sample-bins-metallicity-error-correspond-standard-error.webp)

![Fig. 10. Averaged [X/Fe] vs [Fe/H] per bin of metallicity in the thin disk (green squares) in the thick disk (red filled circles) and in the Hercules stream (blue open circles)](https://thumb-eu.123doks.com/thumbv2/123doknet/14609233.545192/12.918.142.750.62.838/averaged-metallicity-squares-filled-circles-hercules-stream-circles.webp)
![Fig. 11. Age vs [Fe/H] for stars having well defined ages.](https://thumb-eu.123doks.com/thumbv2/123doknet/14609233.545192/13.918.454.753.69.316/fig-age-fe-stars-having-well-defined-ages.webp)
