Design and Implementation of Small Satellite Inspection
Missions
by
Michael Christopher O'Connor
B.S., Astronautical Engineering and Mathematical Sciences (2010) United States Air Force Academy
Submitted to the Department of Aeronautics and Astronautics RCHIVgg in partial fulfillment of the requirements for the degree of MASSACHUSETTS INSTI E
V)OLGY Master of Science in Aeronautics and Astronautics
at the
MASSACHUSETTS INSTITUTE OF TECHNOLOGY B
R
ES
June 2012
@
Massachusetts Institute of Technology 2012. All rights reserved.Author ...
Department of Aeronautics and Astronautics
May 24, 2012 Certified by... ... Alvar Saenz-Otero Research Scientist Thesis SuDervisor Certified by... ... David W. Miller
Professor of Aeronautics and Astronautics Thesis Supervisor
Accepted by ...
Eytan H. Modiano Professor
of
Aeronautics and Astronautics Chairman, Department Committee on Graduate ThesesDesign and Implementation of Small Satellite Inspection Missions
by
Michael Christopher O'Connor
Submitted to the Department of Aeronautics and Astronautics on May 24, 2012, in partial fulfillment of the
requirements for the degree of
Master of Science in Aeronautics and Astronautics
Abstract
For a variety of missions, vision-based navigation and similar architectures provide the advantage of detailed measurements for a fraction of the size and complexity of ground-based imagers. This thesis provides a simple navigation algorithm using no more than a visual centroid measurement to enable in-situ inspection of space objects.
This work evaluates those inspection maneuvers using the Synchronize Position Hold Engage Reorient Experimental Satellites, known as SPHERES. Evaluation of hardware performance was done using data from the International Space Station, in concert with ground-based simulations. Ultimately, this work is in preparation for future experimenta-tion using the VERTIGO vision-navigaexperimenta-tion payload for SPHERES.
The first step presented is an analysis of the measurement capabilities of the SPHERES system and the predicted performance of the VERTIGO system. Using this analysis it is shown that tests run using the former system are applicable to the latter in terms of accuracy, precision, and observability.
The second step is an analysis of the tests run on the Space Station, a comparison to those predicted by simulation, and an extension of those results to simulations of more complex maneuvers. Further, a determination of the robustness of the control to distur-bances is also performed.
Finally, this thesis reflects on the technical and programmatic challenges of develop-ing the VERTIGO payload. From these challenges, lessons are drawn which may guide future developers and program managers, particularly in the university engineering envi-ronment.
Thesis Supervisor: Alvar Saenz-Otero Title: Research Scientist
Thesis Supervisor: David W. Miller
Title: Professor of Aeronautics and Astronautics
DISCLAIMER: The views expressed in this article are those of the author and do not reflect the official policy or position of the United States Air Force, Department of
Acknowledgements
While this work may be of my own hand, there were many along the way who contributed: technically, emotionally, and even so far to make sure I didn't electrocute myself. I'd like to first thank my parents for their constant support throughout my educational journey, all the way to becoming an Air Force officer. You two are the ones who spent so much time in the air that flight seems to be the natural state for the family. Mom and Dad, thank you both for your guidance, my education, and starting me on this journey. To my sister, Jessica, thank you for keeping me honest and ensuring when I do something crazy, it's not
too crazy. Here's to more years of that and more adventures around the world.
To Maria, thanks for making sure I didn't just study while at MIT, and for the support and understanding you've shown throughout my two quick years here. I have enjoyed so much more because of you. I'll see you in California.
To my advisors, Professor David Miller and Dr. Alvar Saenz-Otero, thank you for your support and advice about my research. More importantly, thank you for your leadership guidance. Whether I recognized it at the time or not, you kept me and the program on track. To Paul Bauer, thanks for making sure I never broke anything too expensive.
To Matt K., thanks for always having leftovers. You've been a great roommate and helped keep me sane through the whole MIT experience. To the VERTIGO team at MIT and Aurora, thank you for bearing with me as I learned how to properly manage an engi-neering program. Thanks for pushing to make VERTIGO a success. Brent and Konrad in particular, thank you for your help bringing the project to where it is today.
To Colonel Condit, thank you always for your support, kind words, and for enabling some of the great opportunities that I know lay ahead and for making sure that I always have the best role models as I go forward in my Air Force and engineering career. I still remember what you wrote those two years ago, and seek to be that professional. And in spite of the stress, I'd consider myself one of the happiest people I know.
To the SEA officers past and present, thanks for your friendship and everything else that comes with being a member of the SEA team. Thanks to Bruno and the rest of the SSL as well. And thanks to the MIT fencing team for letting me join you for the past two years.
I'd also like to thank the individuals and organizations who have enabled me to further
Contents
1 Introduction 17
1.1 M otivation . . . . 17
1.1.1 Relevance of Spacecraft Relative Navigation and Inspection . . . . . 17
1.2 O bjectives . . . . 19
1.2.1 Develop Relative Navigation and Inspection Algorithms . . . . 19
1.2.2 Characterize System Performance and Sensor Noise . . . . 20
1.2.3 Quantify Algorithm Performance . . . . 20
1.3 Previous Work . . . . 21
2 Relative Navigation 23 2.1 Vision System Outputs . . . . 23
2.2 Simulation of Vision Measurements . . . . 24
2.3 Relative Navigation about Unknown Objects . . . . 26
2.3.1 Addition of Dead Reckoning . . . . 27
2.3.2 Addition of Target Rotation Information . . . . 28
3 Inspection 31 3.1 Coverage Quantity . . . . 32
3.2 Fuel/Time Tradeoff . . . . 33
3.3 Inspection of an Unknown Target . . . . 35
3.3.1 Expected Improvements using Rotation Information . . . . 35
3.3.2 Path Optimality . . . . 36
4 Application to the SPHERES System 37 4.1 The SPHERES System . . . . 37
4.1.1 What is SPHERES? .3
4.1.2 W hat is VERTIGO? ... 4.2 Measurement Fidelity ...
4.2.1 Vision System Fidelity ... 4.2.2 Metrology System Fidelity ...
4.3 Tests and Test Design ... 4.3.1 Target Translation. ... 4.3.2 Vision System Noise ... 4.3.3 Inspector M otion ...
4.3.4 Use of Rotation Information. . . . . 4.4 Success M etrics ... .. ... ... .. .. . .. ... ..
4.4.1 Coverage. ...
4.4.2 Fuel Use & Time ... ...
5 Results
5.1 Simulation and Station ...
5.1.1 Station Results ...
5.1.2 Simulation Results ...
5.1.3 Simulation and Station Comparison... 5.1.4 Simulation Only ...
5.2 Maneuver Comparisons and Inspection Performance
5.2.1 Target Behavior ... 5.2.2 2- and 3-D Motion ... 5.2.3 Use of Rotation Information ...
5.3 Conclusion ...
6 Project Management of the VERTIGO Payload 6.1 Design Principles ...
6.1.1 Product Design ...
6.1.2 Process Design ...
6.2 Timeline and Earned Value Analysis ... 6.2.1 Initial Design Period ...
6.2.2 Design Completion ... 39 42 43 48 49 50 51 51 52 53 53 55 57 . . . 57 . . . 58 . . . 66 . . . 73 . . . 79 . . . 88 . . . 88 . . . 90 . . . 93 95 97 98 98 109 119 120 121 . . . . . 37
6.2.3 Initial Build and Test ... ... ... . .. ... .. ... . . . . .. . 6.2.4 Flight Hardware ... ... .. . . . ... .. .. . .. ... .. 6.3 Lessons Learned. ... .. . . . . .... .. .. . .. .. . .. 7 Conclusion 7.1 Conclusions ... 7.2 Future Work ...
A VERTIGO Inspection Maneuver Codes A.1 Simple Maneuvers ...
A.2 Advanced Maneuvers ... A.3 Example Code using Video Data
B VERTIGO System Requirements
123 125 125 129 129 130 133 . . . 133 .. . 141 .. . 152 169
. . . .
. . . .
List of Figures
2-1 Inertial and relative frames
2-2 Filtering and Centroiding . . . .
3-1 Feature Tracking and Reacquisition by Angle .
3-2 Shortest Inspection Path on a Sphere . . . .
4-1 A SPHERES satellite . . . . 4-2 SPHERES Global Metrology System . . . . 4-3 VERTIGO "Goggles" Assembly . . . . 4-4 VERTIGO Basic Inspection Path . . . . 4-5 VERTIGO System Block Diagram ...
4-6 Pinhole camera model, X-Z plane ... 4-7 Pinhole camera model, X-Y plane ... 4-8 Stereo Camera Combined Field of View ....
4-9 Target Object Surface Visibility ...
5-1 5-2 5-3
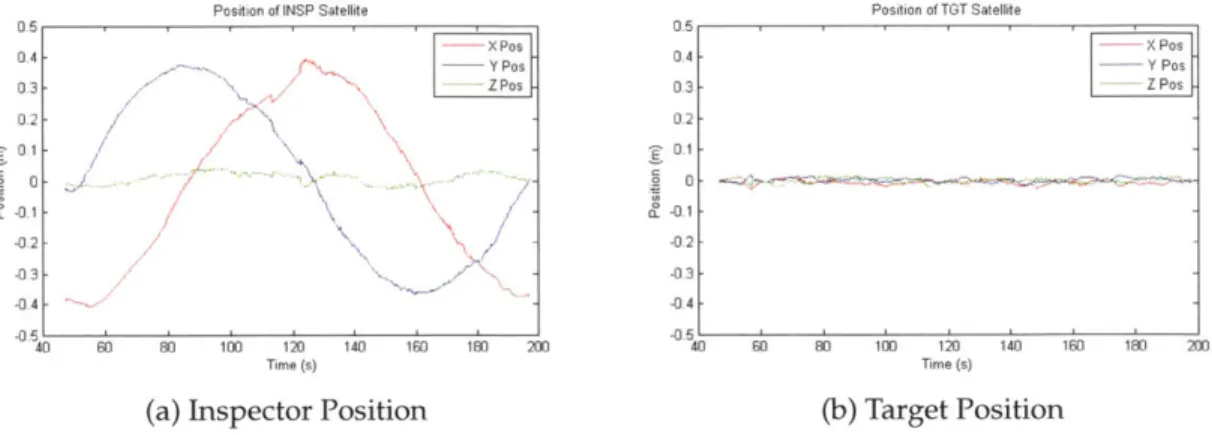
Planar Inspection: Position Data during Stationary Target Test . . Planar Inspection: Relative Position during Stationary Target Test Planar Inspection: Relative Velocity during Stationary Target Test 5-4 Planar Inspection: Inspector Rate during Stationary Target Test
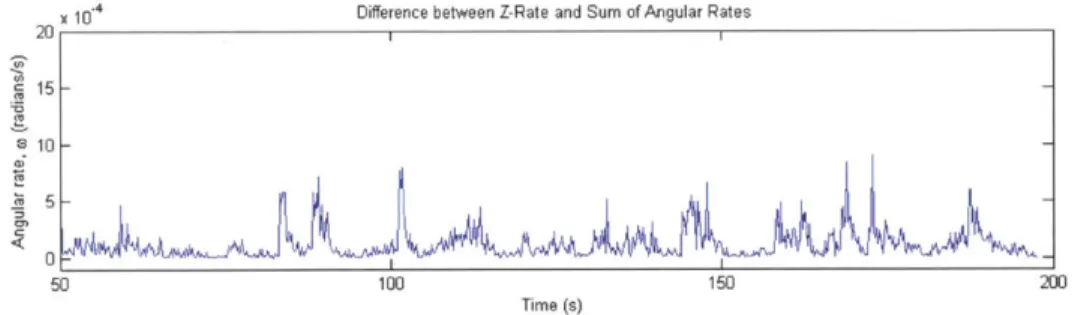
5-5 Planar Inspection: Difference between Z-Rate and Total Angular Rate dur-ing Stationary Target Test . . . .
5-6 Planar Inspection: Target Rate during Stationary Target Test . . . .
5-7 Planar Inspection: Position Data during Moving Target Test . . . .
5-8 Planar Inspection: Relative Position during Moving Target Test . . . . 5-9 Planar Inspection: Relative Velocity during Moving Target Test . . . .
. . . . 2 5 27 . . . . 3 3 . . . . 3 6 . . . . 3 8 . . . . 3 8 . . . . 3 9 . . . . 4 2 . . . . 4 3 . . . . 4 4 . . . . 4 6 . . . . 5 4 . . . . 5 4 59 59 60 . . . . 61 61 62 62 63 64
5-10 Planar Inspection: Inspector Rate during Moving Target Test . . . . 64
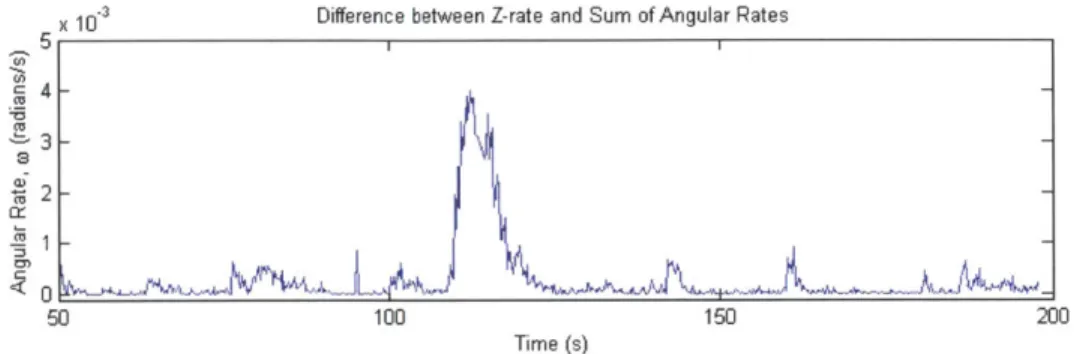
5-11 Planar Inspection: Difference between Z-Rate and Total Angular Rate dur-ing M ovdur-ing Target Test . . . . 65
5-12 Planar Inspection: Target Rate during Stationary Target Test . . . . 65
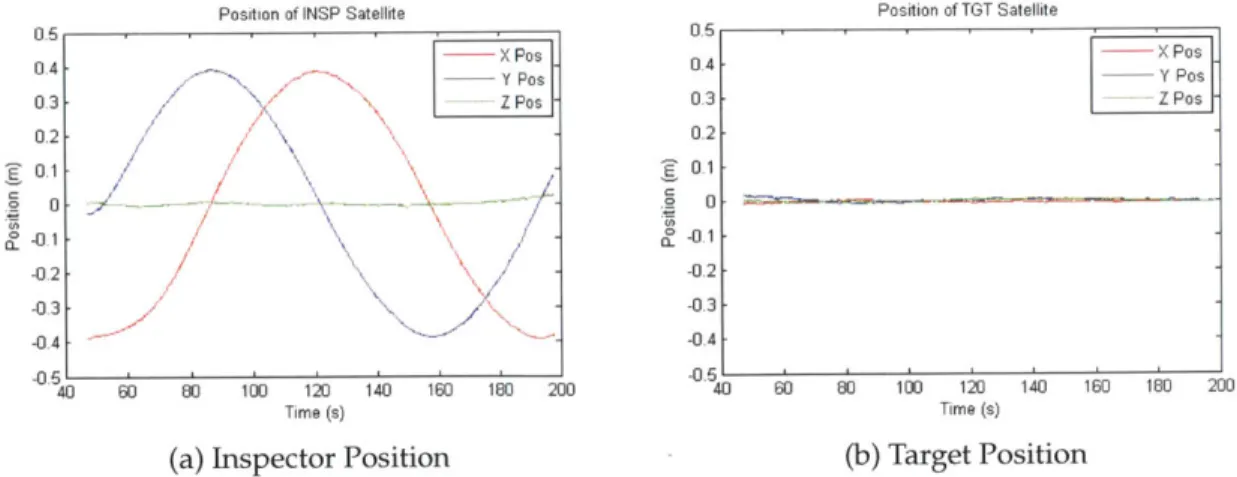
5-13 Planar Inspection: Position Data during Moving Target Simulation . . . . . 67
5-14 Planar Inspection: Relative Position during Moving Target Simulation . . . 67
5-15 Planar Inspection: Relative Velocity during Moving Target Simulation . . . 68
5-16 Planar Inspection: Inspector Rate during Moving Target Simulation . . . . . 68
5-17 Planar Inspection: Difference between Z-Rate and Total Angular Rate dur-ing Movdur-ing Target Simulation . . . . 69
5-18 Planar Inspection: Position Data during Moving Target Simulation . . . . . 70
5-19 Planar Inspection: Relative Position during Moving Target Simulation . . . 71
5-20 Planar Inspection: Relative Velocity during Moving Target Simulation . . . 71
5-21 Planar Inspection: Inspector Rate during Moving Target Simulation . . . . . 72
5-22 Planar Inspection: Difference between Z-Rate and Total Angular Rate dur-ing Movdur-ing Target Simulation . . . . 73
5-23 Planar Inspection: Position Data during "Additional Motion" Simulation. . 81 5-24 Planar Inspection: Relative Position during "Additional Motion" Simulation 81 5-25 Planar Inspection: Inspector Rate during "Additional Motion" Simulation . 82 5-26 Planar Inspection: Position Data during 3D Inspection Simulation . . . . 83
5-27 Planar Inspection: Relative Position during 3D Inspection Simulation . . . . 84
5-28 Planar Inspection: Inspector Rate during 3D Inspection Simulation . . . . . 84
5-29 Planar Inspection: Position Data during Long Duration Simulation . . . . . 85
5-30 Planar Inspection: Relative Position during Long Duration Simulation . . . 85
5-31 Planar Inspection: Inspector Rate during Long Duration Simulation . . . . . 86
5-32 Planar Inspection: Position Data during "Rotation" Simulation . . . . 87
5-33 Planar Inspection: Relative Position during "Rotation" Simulation . . . . 87
5-34 Planar Inspection: Inspector Rate during "Rotation" Simulation . . . . 88
5-35 Coverage: ISS Stationary Test . . . . 90
5-36 Coverage: ISS Motion Test . . . . 91
5-37 Coverage: Simulated Additional Motion Test . . . . 91
5-39 5-40 5-41 6-1 6-2 6-3 6-4 6-5 6-6 6-7 6-8 6-9 93 94 94
Coverage: Simulated Long Duration Test . . . . Coverage: Simulated Using Rotation Information Test . . Fuel Use: Rotation Information vs Baselines . . . . Project and Process for Successful Design . . . . Understanding your Design . . . . Building your Hardware . . . . Testing the Product . . . . Control Measurable Performance through Advocacy . .
Improving the Process by Learning from Failure . . . . . Developing Project Margin Estimates . . . . Cost/Schedule/Performance Weighting at Contract Start Schedule and Spending Progression . . . .
6-10 Cost/Schedule/Performance Weighting at During Hardware Build . . . . .
. . . . 98 . . . 101 . . . 103 . . . 106 . . . 109 .. .... 111 . . . 116 . . . 119 . . . 123 124
List of Tables
5.1 Mass Properties of Modified Target Satellite . . . . 58
5.2 Estimated Navigation Accuracy . . . . 95
6.1 VERTIGO PDR Software Schedule ... 99
6.2 VERTIGO CDR Software Schedule ... 100
6.3 VERTIGO Revised (Dec. 2011) Software Schedule ... 100
6.4 Post-CDR Hardware Delivery Schedule ... 104
6.5 VERTIGO Initial Delivery Schedule ... 119
6.6 VERTIGO Post-PDR Delivery Schedule ... 121
6.7 VERTIGO Post-CDR Delivery Schedule ... 123
6.8 VERTIGO Testing Schedule (Spring 2012) ... 124
Chapter 1
Introduction
1.1
Motivation
Since the launch of the first artificial satellites over 50 years ago, there has always been a na-tional interest in maintaining the high ground in every sense of the phrase. In resource con-strained environments, certain advanced concepts provide value disproportionate to their costs. Vision-based navigation, especially on small servicing satellites hold the promise of being one such concept that delivers value in a way no other type of small system can.
1.1.1
Relevance of Spacecraft Relative Navigation and Inspection
Spacecraft design, launch, and operation are expensive and often risky undertakings. A major space-based observatory such as the Hubble Space Telescope, which has a lifetime cost estimated at $11 billion represents a significant investment of human and financial capital[1]. Hubble's successor, the James Webb Space Telescope is expected to cost even more[2]. In the latter case, as Lagrange point orbit puts it far out of the reach of current manned spacecraft and therefore would need to be serviced robotically if a problem were to arise. The signal delays associated with such an orbit, coupled with complex orbital dynamics about a Lagrange point preclude teleoperated systems. In order to effectively diagnose failures, a free-flying spacecraft must be able to autonomously inspect the dam-aged craft.
This ability to observe and repair a damaged spacecraft via a small inspector presents a risk mitigation strategy for future missions. Commercial ventures may also be more cost
effective in the case of servicing and attendant volume savings[3], while in-situ spacecraft salvage is currently an open research field[4]. In each case, solving the problem requires the ability to inspect a spacecraft of unknown condition from a distance that is far enough away to preclude a collision risk, but close enough to provide accurate resolution.
Long duration missions in earth orbit, such as those on the space station, lend them-selves to human EVA to repair and maintenance. Missions travelling out of Earths mag-netic field which require repairs would put astronauts at greater risk on two fronts: in-creased environmental risk to the spacewalker and an inability to return injured astronauts quickly to Earth. Autonomous inspector vehicles with the ability to identify problems through computer vision or other sensor systems provide a safer alternative for diagnosis, with the potential for follow-up repairs by crew.Before that can be realized, the inspection problem should first be solved in the relative safety of low earth orbit.
Large modern spacecraft are designed with significant redundancies as the forces of time and the space environment combine to cause part and system failures. Redundancy provides an element of reliability, but at the cost of increased mass and complexity as entire systems and subsystems must be duplicated. The ability to repair or replace single failed parts rather than design backup systems into a satellite has the potential to reduce costs
by reducing the launch mass. Commercial systems on the ground often take this approach
- after all, a car has but one engine. Even if redundancy is built in, the ability to install replacements, as was done during Hubble servicing missions can extend mission lifetimes many times the design lifetime for a fraction of the cost of a new system.
In each of the potential applications of in-situ inspection described above, the operat-ing environments are very different. In each, however, the use of relative measurements between inspector and target are preferable to more global sensors or any earth-based ob-servatories. In GEO orbits GPS measurements suffer from position errors on the orders of meters to tens of meters[5], errors which are compounded by solar fluctuations and their attendant ionospheric disturbances[6]. Forclose inspections such errors are unac-ceptably large, especially when collision avoidance is a high priority. Additional problems arise when an inspection target is uncooperative and GPS measurements or other global measurements are therefore unavailable[7]. Star trackers may be problematic in determin-ing relative position to a target: if they are not overwhelmed by reflected solar light from the inspection target, their view of the starfield may be obstructed by a complex shape.
Ground-based radars are also of limited utility because of the distances and perspective involved. When the inspector eclipses the ground station, the problem is only further complicated. As mentioned before, using ground-based sensors also introduces time de-lays due to light-speed propagation and processing time[81. In GEO this delay is on the order of seconds; for missions beyond that point, the delays grow significantly longer in proportion to the increased distance.
These physical constraints point to the need for space-based inspector vehicles using relative measurements to maneuver around a target object, and to do so safely (without colliding) and uncooperatively (no information passed from target to inspector). Further-more, in contrast to other methods[9], the inspection should be performed with no a priori knowledge of the target.
1.2
Objectives
To satisfy the mission requirements for a space-based inspector, there are a handful of tasks which this thesis aims to address.
1.2.1
Develop Relative Navigation and Inspection Algorithms
The first objective is to develop algorithms to perform inspections of an unknown, poten-tially spinning and tumbling, target object in order to build up a 3D map of the target. This task is split into two parts:
1. Relative Navigation The ability to move about using measurements of a target object
in the body frame of the inspector. These measurements must not be in reference to any "global" frame, but instead must be described as movements of the target in the inspector's field of view.
2. Inspection The movement of the inspector about the target object for the purpose of providing a vision payload with a view of the target.
An algorithm which combines these two approaches should enable an inspector to view all surfaces of a target object, and do so with no reference other than target itself, as well as onboard inertial navigation sensors like gyroscopes and accelerometers. The
combination of Inspection and Relative Navigation elements should allow for planning of paths around an unknown object.
Additionally, the algorithm should be as simple as possible to reduce the processing burden and make the algorithm applicable to as many space systems as possible.
Notionally, the algorithm should not require any information about the target object's rotation states. By discarding or not collecting this information, the algorithm should allow for inspections on a larger set of objects, including those that are rotating at high rates.
1.2.2 Characterize System Performance and Sensor Noise
This thesis must also develop a model of the vision system to be used and to compare that model with the existing SPHERES satellite system, both in simulation and in ISS testing.
Characterizing sensor noise allows for the application of the SPHERES system to the to-be-launched vision system that this thesis seeks to support. By comparing the noise sources and noise characteristics of the SPHERES metrology and inertial sensors to those predicted in a vision system, an understanding of the expected performance of the inte-grated inspection system can be gained.
1.2.3
Quantify Algorithm Performance
In order to apply the navigation and inspection algorithms that this thesis develops, the performance of the inspector system must be assessed with a number of characteristics in mind. The most significant of those performance characteristics are:
1. Fuel Efficiency Minimizing fuel use in an inspection maneuver is preferred. This
will be measured in the amount of CO2 fuel used by the test satellites.
2. Time Efficiency Faster inspections are desired, though more inspection time pro-vides better coverage. Algorithms which minimize the time to complete an inspec-tion are preferred.
3. Coverage Each algorithm must provide a full view of an unknown target object to
the inspector satellite. This serves as a constraint on each maneuver. It can also be used to discriminate between inspection paths based on the quality of inspections
-better inspections provide less oblique views of the target object's surfaces, and may provide multiple views of the same surface.
These factors will be quantified, and used to compare the performance of different algo-rithms against one another, as well as the reactions of the given algoalgo-rithms to target object behaviors. Additional factors, such as the complexity of the algorithm, code size, and col-lision risk may also be taken into account, but only to discriminate when the three above qualities are insufficient.
1.3
Previous Work
Previous work done with vision systems has been used for purposes that vary from space station assembly (Canadian Space Vision System[10]) to autonomous rendezvous and dock-ing (DARPAs Orbital Express[11], among others[12]). Relative navigation usdock-ing vision sensors may also be the control of autonomous underwater vehicles, with applications in iceberg-relative navigation[13],[14] and benthic surveys[15],[16]. Research with appli-cation to vision is ongoing in rendezvous to a tumbling object[17], formation flight[18]. What is well understood is the use of vision and other sensing methods to safely approach a target prior to a rendezvous maneuver[19]. The success of these methods has been inte-gral to the US space program, especially in the Shuttle/Station era. Difficulties, however, arise when the inspection target has an unknown form and no fiducials for easy reference in navigation. Studies addressing this problem often rely on pre-planned trajectories[20] around the object or are not easily adaptable to modification of the inspection path based on the tumbling motion of the target object.
This thesis will outline an algorithm for use in vision-based navigation applications to perform inspections while maintaining a safe keep-out distance. The algorithm makes use of range and bearing data which would be available to calibrated stereo cameras, along with a 3-axis gyroscope onboard the inspecting satellite. The approach will be based on a rotating inspector that maintains a body-fixed orientation with respect to a target object. Success will be evaluated primarily on the ability to maintain a safe distance, to maintain a closed planar path, and demonstrate robustness to certain disturbances. The algorithm is tested on the SPHERES satellite simulation and onboard the International Space Station
(ISS). The ultrasonic, time-of-flight based navigation system is used on the ISS for truth
measurements.
development of a simple inspection algorithm for use in a wide range of systems in which the control system may be computationally constrained and to experimentally demon-strate the effectiveness of that algorithm in a microgravity environment.
The first contribution of this thesis is the development of an algorithm for inspection that only requires a vision system to compute the range and range rates using a simple stereo algorithm that can easily be implemented in an embedded system with limited pro-cessing power. The computational simplicity of this algorithm is due to the fact that it does not need to compute the relative orientation[22], between frames. Instead, it dead reckons its position on a spherical surface surrounding the target object using its gyroscopes. The secondary contribution of this paper is an experimental validation of this algorithm in a microgravity environment (i.e. the International Space Station) using a gyroscope and simulated range measurements. This experiment showed that the amount of vertical drift during a 3 minute test was less than 10 degrees for a stationary target, with 25-minute simulations showing less than 12 degrees. The third contribution of this paper is an error analysis to compare the estimation accuracy between the simulated range measurements and what is expected of an actual stereo vision system.
Chapter 2
Relative Navigation
2.1
Vision System Outputs
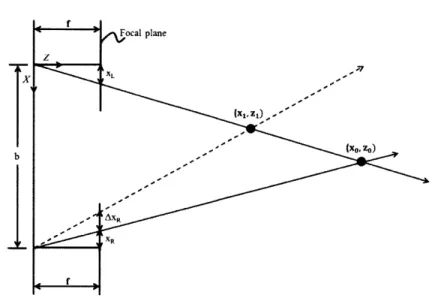
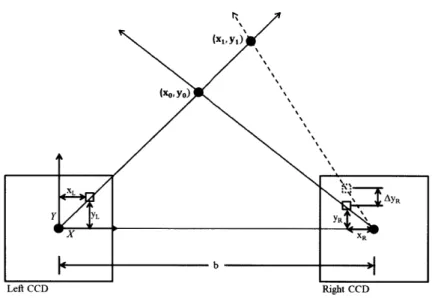
Stereo cameras, LIDAR/RADAR, structured light systems, and other "vision" systems provide information about objects in their field of view that include depth, motion, and a host of surface properties. Each of these systems addresses the same problem using different hardware, but the principles are the same. Just as LIDAR provides relative dis-tance measurements to a target's surface, a two-camera (or more) system will provide 3-dimensional measurements from a reference point to surface features on the target object that are in view. This is achieved by triangulating a feature which appears in the field of view of both cameras using knowledge of the distance between the two cameras and where the object falls on the focal plane of both imagers. Using trigonometric relation-ships, each feature can be assigned an estimated distance with respect to some pre-defined reference point. This reference point is customarily placed in the upper left of the leftmost camera, and range and bearing to a target are the set of 3-D measurements provided by the cameras. As they are later implemented in the relative navigation algorithm, this range and bearing is translated into range and horizontal translation measurements.
A typical stereo vision system provides synchronized images from each camera. Each
camera and lens, however, distorts the true image. Therefore, in order to accurately de-termine the range and bearing to features, the cameras must first be calibrated. This is accomplished by providing a set of known features, most commonly a checkerboard pat-tern, and taking a set of images. Since the image of the checkerboard is distorted by the lenses and cameras, a recursive batch algorithm can be applied to the image set to provides
a least-squares estimate of the distortion parameters. After determining these parameters and creating matricies to undo the distortion, future images can be quickly adjusted to remove their effects. This process, the particulars of which will not be described in signifi-cant detail in this thesis, results in image pairs which are undistorted and rectified and are able to be used for the aforementioned ranging.
After the calibration, since distortions may be considered removed, the images can be treated as the output of a pinhole camera.
2.2
Simulation of Vision Measurements
Because of the launch schedule of the vision system hardware (described later, in Chapter 4), we do not yet have the capability to use the VERTIGO Goggles stereo cameras on orbit. Instead, the SPHERES global metrology system was used to simulate stereo vision mea-surements. It uses a time-of-flight ultrasonic ranging system system. Using measurements from a set of five ultrasonic beacons placed around the ISS test volume, the satellites are able to determine their position. Background telemetry over a wireless link allows each SPHERE to find the location of others in the test area. Differentiating (via an Extended Kalman Filter) provides velocity measurements, while the time of flight difference be-tween faces of the SPHERE provides pointing information. To translate from the global to relative frame, there are a few steps.
The first step is to convert the global position measurements into the body frame. The process is illustrated in Figure 2-1, which shows the Inspector, Target, and the Inspector's body frame. The vector difference allows us to find the length and direction of rB in the inertial ISS frame:
rB(ISS) rA(ISS) (2.1)
rTGT - rINSP
iB(ISS) =A(ISS) (2.2)
iTGT - fINSP
The origin of the coordinate frame, though not important to the relative state, is located at a point in the center of the test volume framed by the SPHERES ultrasonic beacons. Using the quaternion calculated by the ultrasonic metrology system, a rotation matrix from the
Figure 2-1: Inertial and relative frames
ISS (global) frame to the body, RG2B, places rB, which is the vector from the inspector to
the target in the body-fixed reference frame of the inspector.
B= rA
(2.3)
= RG2BT[rB(ISS)
Since B is a rotating frame, the velocity measurement is not as straightforward, and again requires gyroscope measurements to measure the rotation rate. Using the rules for differ-entiation in a coordinate frame,
rA RG2B(fB(ISS)) (2.4)
iB =A - W X rB
(2.5)
= RG2B(fTGT - rINSP) - W x RG2B(rTGT - rINSP)
These measurements are then differenced with the desired states to determine the state error. A standard linear PD controller was then used to calculate thruster inputs for the position error, and a nonlinear PD controller was used to control only for the rotation rate (though the controller is effectively proportional as implemented). While more optimal controllers are available, the use of PD controllers allows the implementation of the algo-rithm on a wider range of computing platforms, achieving the stated goal of maintaining simplicity in implementation. An additional feedforward term was used to maintain the circular motion. This thrust, applied in the inspector's body +X direction (nominally
to-ward the target), provided the centripetal force to ensure a circular path:
r
= mrx,goal * Wgoal (2.6)
Forces and torques were then mixed by the propulsion system, which schedules thruster opening times for a period of up to 200ms every during each 1-second control period.
Once the VERTIGO Goggles are launched to the station, the output from the cameras will be processed using the Goggles single-board computer. This computer will process the images and will output the range, rB, and range-rate, i'B, using previously developed thresholding and centroiding algorithms and eliminating the need for the transformations described in equations 2.1 through 2.5. Initial prototypes of this technique have demon-strated the capability to provide such relative measurements.
2.3
Relative Navigation about Unknown Objects
The nature of unknown objects means that they may have certain qualities that preclude simple tracking of features in order to navigate. Quickly rotating objects in particular pose difficulty to certain classes of algorithms. Systems which have a low framerate compared to the rotational rate of the target will have difficulty tracking a given feature from frame to frame. Take for instance, an image processing algorithm that can account for 10 degrees of angular motion between frames or less, and a system that operates at 10 frames per second. Since the maximum rotational speed, Wtarget, is defined by
Wtarget (FPS)(Oiimit) (2.7)
An algorithm dependent on feature tracking for relative navigation will fail if the target object spins faster than 100 /s, or about 17 RPM in a single axis. Of course higher framer-ates or more advanced tracking and estimation tools could be used, but to do so would be computationally intensive, requiring a larger, more complex system and all of the atten-dant support systems from thermal control to power storage and distribution. For complex motion, multifaceted or complicated shapes, unfavorable surface textures, or poor lighting conditions, processing requirements might push the maximum allowable frame-to-frame angular displacement far lower.
Alternatively, a tracking algorithm which does not require tracking of features from frame to frame could be used in order to move relative to the rotating target. This is the approach taken by the VERTIGO team.
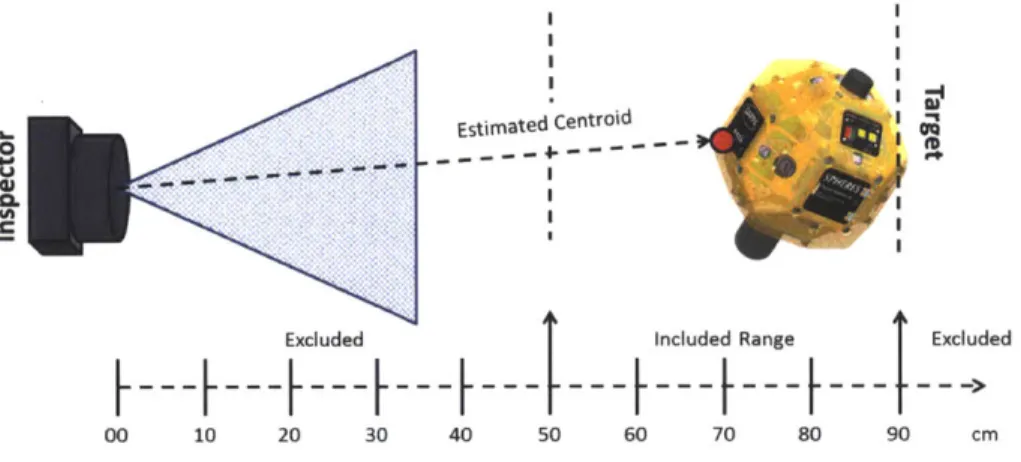
First, operating at about 5 frames per second, the system identifies features in each image. Next, a filter is applied to the image to exclude those features outside of a set range (typically beyond 1m from the Inspector, while the size of the baseline excludes those too close to be observed simultaneously in both cameras). This is done to eliminate background features associated with testing in an enclosed volume like the International Space Station, a problem not encountered in an "outdoor" orbital environment where a starfield at effectively infinite distance is the only background. Next, features are blurred or blended together and a centroid is calculated. This centroid is then used to estimate range and translation to the target. The specifics are beyond the scope of this thesis, but the process unfolds as shown in Figure 2-2.
Estimated Centroid
0.
Excluded included Range Excluded
00 10 20 30 40 50 60 70 80 90 cm
Figure 2-2: Filtering and Centroiding
2.3.1
Addition of Dead Reckoning
If the only goal of an inspection was to maintain orientation and relative distance, then
processed vision information would be all that is needed. However, in order to perform maneuvers around a target object, dead reckoning is necessary. Single integration of gyro-scopes is particularly useful when estimating the motion of the Inspector about the target. This is because if control is maintained with regards to range and pointing, calculating the rotation of the Inspector will provide an estimate of the location in an inertial frame whose origin is co-located with the center of the target object. This inertial location can be used to
develop paths which are most likely to provide global coverage of the target object. The addition of dead reckoning is straightforward: as gyroscopes typically operate at a high frequency, measurements can be averaged or filtered over short periods. Given the estimation of the rotational rate of the Inspector, a simple integrator
(
in frequency domain, E in time) may operate on the filtered rates to estimate the angular displacement. Since the rotational displacement is so closely related to the linear displacement in a well-controlled system, the motion in inertial space also falls out. A conversion from spherical to Cartesian coordinates shows this relationship:T (2.8) t=o T = owy (2.9) t=o x = rcos#sinO (2.10) y = rsin#sinO (2.11) z = r cos 9 (2.12)
Should the rotation rate about the body X-axis not be kept to zero, additional terms would need to be included to account for multi-axis coupling.
Inverting the relationships allows for planning of any trajectory in a coordinate frame that is body-centered and non-rotating with respect to the target object. This method, it should be noted, is sensitive to gyroscope noise, and will drift accordingly over extended periods of time. Tracking features on the target object may in some cases be able to aug-ment gyroscope measureaug-ments, and be filtered to provide better accuracy over longer pe-riods of time. The addition of target object rotations will allow for additional planning, but that is beyond the problem scope.
2.3.2 Addition of Target Rotation Information
The addition of the rotation of the target has two implications. The first is that by in-tegrating the rotation of the target object and combining that information with the dead reckoning estimation from the Inspector's gyroscopes, maneuvers and navigation can be designed to take place in the target's body frame rather than in an arbitrary inertial frame.
This is of particular import for optimal design of inspections, as well as ensuring full cov-erage. Without the knowledge of the rotation of the target relative to the Inspector, there may be segments of the target which remain uninspected. Indeed, in certain cases where the inspection motion matches the target's rotation an inspection may fail to view more than a single side of the object of interest.
The knowledge of rotation can be two-tiered. A precise, accurate estimation of the rotation rates of a target are necessary if that information is to be used actively and con-tinuously for the purposes of path planning. Such an approach is processor-intensive and decidedly not simple. It will not be dealt with in this thesis.
On the other hand, the use of a general estimation of the rotation of the target object can be used to improve efficiency of inspections (this will be discussed in a later section), as well as for insuring better coverage by fixing the inertial frame in a fourth degree of freedom, rather than just the original three.
Chapter 3
Inspection
Inspection is the movement about an object for the purpose of observing its surface and developing an estimate of its form, function, or other qualities. For the purpose of the VERTIGO program, the goal of an inspection maneuver is to build a 3-dimensional map of the target by collecting, storing, and processing information about its surface features.
Four inspection maneuvers were developed for implementation on the SPHERES sys-tem (and later use on the SPHERES-VERTIGO combined syssys-tem). Those maneuvers follow paths described by the following:
1. Stationary This maneuver holds the Inspector satellite stationary in the relative frame,
only maintaining distance and pointing.
2. Planar This inspection is done by imparting a rotation in one axis, causing the In-spector to move in a plane.
3. X-shaped This maneuver requires integration of the Inspector's gyros to estimate
movement about the target in an inertial frame. Rotations are imparted into inspector body axes one at a time, switching after 900 and 360' of rotation.
4. Hemispheres This maneuver uses gyroscopes onboard the inspector and an estimate of the target's rotation. Using the rotation estimate, the inspector aligns with the rotational axis, then performs inspections in the "northern" rotational hemisphere, followed by the "southern" hemisphere and equator, switching when the sum of the estimated rotation of the target and the Inspector indicates 360' of the target have passed in front of the camera.
While the first was developed merely for demonstration purposes and would fail to provide significant coverage unless the target satellite was rotating and tumbling between multiple axes, the latter three maneuvers are compared based on their performance ac-cording to coverage, fuel use, and time to completion metrics.
3.1 Coverage Quantity
Coverage is the measure of the surface of a target object that is "visible" to an inspector satellite. Given a surface mesh, we can therefore assign a binary 'coverage' state: 1 if the mesh section is visible, 0 if it is not. In order to determine if a section of the mesh has been
seen by the inspector, we must check the following qualities:
Viewing angle: Test data from initial Phase II (image processing) algorithms shows difficulty matching features in consecutive frames if the feature lies on a surface angled more than 30 degrees from perpendicular relative to the camera boresight. Therefore, to be considered "viewed," a point should lie on a surface inclined less than 30 degrees (see Figure 3-1[23]).
Obstruction: Because we are working with the visible spectrum and solid, opaque objects, we should omit those which are behind another object. Fortunately, the SPHERES system does not have any self-occluding surfaces or geometries, save very small sections around the CO2 tank and the regulator knob, which will be ignored
for this thesis. For our purposes, this excludes only surfaces on the opposite side of the SPHERE from the inspector.
In view: Clearly, to be considered viewed, the surface should be in view of the
cam-era. Given the camera and lenses selected for the VERTIGO project, as well as the loss of the edges of the images due to distortion, an assumption of a 30 degree field of view (half cone) is reasonable.
Because the goal of the VERTIGO inspection is to create a 3-D map of a target ob-ject, obtaining 100% coverage is desired. This requirement therefore determines when an inspection is completed. For the cost analysis, coverage serves as a constraint on the optimization. Considering the likelihood of some sensing and approximation error, an inspection shall be considered complete when 95% of the surface has been inspected.
100
80
80
40
Matching location and scale Matching location, scale, and orientation Nearest descriptor in database
0
0 10 20 30 40 50
Viewpoint angle (degrees)
Figure 3-1: Feature Tracking and Reacquisition by Angle
3.2
Fuel/Time Tradeoff
In any satellite, fuel is at a premium, and so any evaluation of the efficiency of an inspection should take into account the fuel used for maneuvering.
In order to estimate the amount of fuel used in a particular inspection maneuver, there are two methods available. The first, most accurate way is to measure the amount of time a thruster is held open and how many thrusters are open simultaneously. Based on previous work[24], we know that the fuel used follows:
mthruster (-0.033n
+
0.5555) (3.1)mftotal (-0.033n +
0.5555)n
(3.2)Where n is the number of thrusters open simultaneously. Using this equation as well as the thruster firing times, we can get a good estimate of the total fuel used. For station tests, however, this data was not collected, and simulation does not normally collect this information. What is collected, however, is an estimate of the thruster firing times called
"thruster counts" (c). With 1 count equivalent to a singe thruster open for 1ms, and a full tank approximately equal to 500,000 counts, we find that each count is equivalent to:
c = nopen * tmslopen
(3.3)
500000 * c = 170mfuezIg
(3.4)
where nopen is the number of open thrusters, tmslopen is the time each thruster is open
-(in units of ms), and c is a count. Fuel mass, nfuelig, is the mass of fuel (in g) in a full CO2
tank.
For the majority of the inspection, 3 thrusters are expected to fire at any given time, and we assume they operate for about 30% of their 200ms control period every second. This yields 2942 counts per gram of fuel. Counts are reported in both simulation and state of health data returned during SPHERES tests. Therefore, by tracking the thruster counts, we may estimate the rate of fuel use.
Fuel, however, should not be the only consideration: in two of the most applicable in-spection scenarios, fuel for a small inspector spacecraft would be a small portion of the overall mission fuel. In "hosted" spacecraft inspecting a "host" spacecraft like the Inter-national Space Station or an exploration mission, the host would likely hold large fuel reserves compared to what is required for relatively simple inspection maneuvers of the inspector about the host and refueling might be possible. For missions requiring the ren-dezvous of one spacecraft with another from different orbits, the fuel cost required to attain and maintain a proper orbit would be significantly larger than maneuvering fuel needs. With inspections similar to those used for SPHERES, the total AV is on the order of cen-timeters or meters per second, compared to orbital maneuvers which may range in the 10s to 1000s of m s- 1 depending on object size and inspection speed. In each of these cases, the criticality of failures that demand a close visual inspection may hint at an element of time-criticality. Indeed, in the case of the Space Shuttle, such maneuvering thrusters (RCS) were even used for attitude control during launch, implying on-orbit maneuvering fuel was a minor part of the fuel needs [25].
Therefore, time should also be taken into account alongside fuel use. After all, in most orbits, over an extended period of time, station keeping requirements would cause fuel use to grow. Furthermore, if an inspection is non-time critical, the use of orbital dynamics are more fuel efficient and better suited for most inspections than active inspection and navigation methods. However, if a spacecraft is damaged enough to require an inspection, or other mission requirements dictate an inspection to be completed before the completion of one orbit, the inertial methods presented in this paper are better suited than others. Certainly in missions requiring long-duration transfers, active control is the only option.
As time grows linearly and is always non-negative, conversion for a cost function is straightforward. Fuel use is also non-negative and monotonically increasing.
Combining the two, we get the cost function,
J(m5 fel, t) Qmfuel + Rnt (3.5)
With the constraint
C(x, t) = 0.95 (3.6)
Where C(x, t) is the ratio of coverage of the target object to its total surface area. The con-stant n is equal to 0.063g s-1 and is used to compare time and mass under the assumption that a typical SPHERES will finish a full tank of fuel in 45 minutes of test time.
Given n, weights
Q
and R are then selected to weigh fuel consumption and time, re-spectively. If both are equal to 1, then fuel use and time are equally weighted when com-pared to a typical SPHERES test.3.3
Inspection of an Unknown Target
3.3.1
Expected Improvements using Rotation Information
Of the three inspection paths tested, only the last takes the rotational state information of
the target into account. By doing so, it is expected that this path will minimize the cost function compared to the other options. Most of the efficiency is expected to come from the fact that the Inspector can actively take advantage of the rotation of the target rather than moving in potentially inefficient paths. For instance, if both satellites are have their body Z axes aligned, if the target rotates about its +Z axis, if the Inspector rotates about its
- Z axis at half the rate, it will see the be able to observe the entire "equator" of the Target
in a third of the time it would take should they rotate in the same direction.
Additionally, the Inspector will be able to use that knowledge to not only perform faster and more fuel efficient motions, but it may perform transitions quicker because it allows the integration of the target's rotation to estimate coverage rather than only the Inspector's gyro information.
As noted earlier, it should be emphasized that the use of rotation information from the target object is not, nor should it be, required for a successful inspection. Such infor-mation can only improve an inspection, and shouldn't be the difference between success and failure. Without the information of the rotation states, however, full coverage
can-not be guaranteed without additional precautions, especially in cases where the rotation rates of the two satellites match in direction, and particularly those where they match in magnitude. Such cases can be avoided by varying the inspection speeds in order to elimi-nate potential resonances between inspector and target. Those approaches and the trades which inform their selection are, however, beyond the scope of this thesis.
3.3.2
Path Optimality
The paths that were developed are unlikely to be truly optimal, but only improvements compared to the baseline planar inspection. Indeed, a maneuver designed to follow the shortest path[26] would likely follow one like the that shown in Figure 3-2[27] rather than the currently implemented paths.
Shortest Inspection Path over a Sphere
-1 -1
Figure 3-2: Shortest Inspection Path on a Sphere
Further complicating the solutions for true optimal paths are the rotation and nutation of the target object, which distort the "baseball seam" path, which is the shortest inspection course about a stationary target. Therefore, these results should only be considered first as relative value comparisons, and second as approximations of true optimal paths, not rigorously defined and derived fuel and time-optimal paths.
Chapter 4
Application to the SPHERES System
4.1
The SPHERES System
The Synchronize Position Hold Engage Reorient Experimental Satellites, or SPHERES for short, are the hardware upon which the navigation and inspection algorithms were de-veloped and tested. To better understand the constraints of the research, as well as the realistic nature of the dynamics that are simulated, we first take a look at the current and future SPHERES program.
4.1.1 What is SPHERES?
The SPHERES satellite testbed was initially developed as part of a capstone design course in the MIT Space Systems Laboratory (SSL). Since its first launch in 2006 the system has been hosted aboard the ISS and as of May 2012 has conducted over 30 test sessions in such varied areas as formation flight, rendezvous and docking, online planning, and STEM education and outreach. In the 7 years of testing, SPHERES has provided valuable experi-mental data in a persistent microgravity environment and proven themselves as a valuable control and navigation testbed.
The system itself consists of ground and space segments, each able to operate in-dependently of one another. Algorithms are first developed and validated in a high-fidelity simulation with a MATLAB interface. This simulation, which is constantly be-ing improved and updated, allows for rapid prototypbe-ing of code for control and navi-gation algorithms. Based on the simulation results, scientists and engineers working on
the project verify and validate their code on a flat floor or glass table. After 2-D test-ing with the SPHERES hardware on ground, the code is packaged and sent for testtest-ing on the ISS. On ground and on station, up to three satellites may typically be used, each with internal gyroscopes and accelerometers, as well as an external ultrasonic of-flight measurement system[28][29]. The metrology system (Figure 4-2) provides time-of-flight measurements from five beacons with known locations, to microphones on six faces of the SPHERES. This data is used for position, velocity, and attitude estimation.
Each satellite has 12 cold gas thrusters, enabling full 6-DOF motion. As neces-sary, batteries and CO2 tanks are changed by the operator. At a 5Hz frequency the satellite receives updates from the ultrasonic beacons, allowing it to de-termine its location in the test vol-ume. At a frequency of 1Hz, the SPHERE may perform control actions for up to approximately 200ms. Through-out a test program, state data is sent in a test over a wireless link back to
20D, 10 50, 250 200 0 50
I
00 150 0 200 ;Figure 4-2: SPHERES Global Metrology Sys-tem
Figure 4-1: A SPHERES satellite from each of the satellites participating
a station laptop for post-test analysis. During the design of the system, forward-looking designers added one im-portant functionality: an expansion port. The expansion port allows for the physical mounting of additional payloads and pro-vides adequate connectivity for commu-nication between a payload and the host SPHERE. The expansion port also provides data lines for expansion of the metrology system as well as a handful of other health and status lines that a payload may use.
enough to allow for payloads to interface with the satellite with minor changes to the core communication software.
These early design choices, particularly the ability to allow for expansion of the satel-lite capabilities were a critical enabling factor in achieving the vision-navigation mission that is discussed in this thesis. Much is owed to the design philosophy that nothing on the satellite should ever be a "terminator". The combination of this approach and past expan-sion experiments on SPHERES paved the way for the addition of the first flight-qualified expansion on the experiment: the VERTIGO vision navigation payload.
4.1.2
What is VERTIGO?
In 2010, DARPA began the InSPIRE program to upgrade the satellites to enable, among other things, vision-based navigation. As part of this program, in 2011 MIT and indus-try partner Aurora Flight Sciences began developing the Visual Estimation and Relative Tracking for Inspection of Generic Objects (VERTIGO) payload. Attaching to the expan-sion port built onto SPHERES, the VERTIGO Goggles Assembly consists of an avionics and processing upgrade, a set of stereo cameras, a high-bandwidth communication system and supporting elements (additional system requirements can be found in Appendix B). Due to launch vehicle and programmatic constraints, the Goggles will not be operational until the fall of 2012. The experiments described in this paper therefore use the SPHERES ultra-sonic global metrology system to simulate range measurements that otherwise would be obtained from stereo cameras.
Figure 4-3: VERTIGO "Goggles" Assembly
At its roots, however, the VERTIGO hardware, however, is more than just a year old. Its roots lie in a program run in the MIT Space Systems Lab (SSL) one summer prior called
the Low Impact Inspection Vehicle (LIIVe). LIIVe prototyped many of the initial subsystem elements that would be inherited by VERTIGO, and served as a proof of concept for the project. A Naval Research Laboratory (NRL) project, it tested many of the critical trades, from power consumption to processing needs and architecture, allowing VERTIGO to pro-ceed much faster. Without the LIIVe heritage [30], the VERTIGO program would not have been able to maintain the compressed schedule it was contracted for.
In the initial launch, two VERTIGO units will be sent to station. Each unit (Figure 4-3) is really two separate pieces - the avionics stack and the optics mount. In keeping with the design philosophy of expandability, the stack replicates nearly all of the connections pro-vided to it by the satellite to enable other payloads to use the increased processing power granted by the onboard processor. The processor itself is a 1.2GHz single-core processor with a relatively low power draw for its processing capability. In order to take advantage of flight-qualified resources while still maintaining a low mass and realistic dynamics, the system has been designed to use onboard Li-ion batteries. These batteries provide between
1 and 1.5 hours of operational time, while keeping the mass below the limits which require
significant changes to the SPHERES control algorithms. VERTIGO's thermal management system consists of a fan included on the single-board computer which forces convection across a heat sink. This cooling mechanism combines with motion-induced flow and ther-mal radiation to maintain a sufficiently low operating temperature for the electronics while keeping the package cool enough for astronauts to handle. The vent design minimizes dis-turbance torques from the airflow.
The optics mount, unlike the PEEK-encased avionics stack, is milled from 6061 alu-minum designed to survive the launch vehicle vibration and acceleration loads with min-imal distortion. The optics structure, purposely overdesigned, was built as such in order to reduce the chance of the cameras moving out of calibration between hardware delivery and on-orbit operations. Between then, the cameras must remain rigidly locked through shipping, handling, a train ride, packing, and finally, a rough 10-minute ride to the ISS. The structure hosts a pair of HD cameras, illuminating LEDs, additional metrology sensors, as well as the electronics required to run them and communicate with the avionics stack.
The two elements are designed for simple nominal operation by astronauts, with only power and reset switches available as well as an LED on/off switch. Should an anomaly present itself in development or on station, there are additional access panels for replacing
hard drives and a breakout connector which allows for mouse and keyboard inputs. Both wifi and ethernet connections are available for high speed communication between the Goggles and the commanding computer, bypassing the considerably slower SPHERES RF communications. This connection allows for real-time streaming video and download of large data files between the Goggles and the ISS computers.
That communication is managed, as are all operations, by a GUI running on a laptop on the ISS. The GUI allows for the astronaut operator to select, load, and operate test programs and monitor their progress. The VERTIGO plug-in to the SPHERES GUI also handles the aforementioned video feed to the astronaut crew. This provides additional feedback beyond what is typically available to ground observers, and provides a more interesting experience for operators.
Each of these design elements was built to achieve a two-fold mission. The first was to maintain the flexibility and usability of the SPHERES system as a student-usable, expand-able testbed. The second, more particular goal, was to support the development of con-trol, navigation, and other vision-based navigation investigations with space applications. With VERTIGO, MIT hopes to test out algorithms with application to on-orbit inspection, failure diagnostics, rendezvous and docking, assembly, and a host of other missions that vision sensors enable.
The profile for the current VERTIGO mission calls for three phases. The first phase (cre-atively named Phase I) includes an initial inspection of an unknown object which gathers information about that object from a "safe" distance with an expectation of near-global coverage of the target object. The second phase (Phase II) is a pause to allow the Goggles to process the inspection data to build a 3D map of the target using techniques such as bundle adjustment[31] or simultaneous localization and mapping(SLAM)[32]. The third and final phase (Phase III) consists of relative navigation using the 3D map to perform a closer inspection or to use the object as a stepping-stone or reference point to inspections further afield. This thesis primarily addresses the first phase.
The phase begins with the target object in view of the cameras of the inspector satellite (it is assumed that the lost in space problem has been solved on the SPHERES platform and is beyond the scope of the VERTIGO project). With the target in view, the inspector may make an estimation of the center of the object using thresholding and centroiding algorithms[33]. For now, we begin with an assumption that the target object is stationary;
Inspector
SPHERE
Target
Object
r
Figure 4-4: VERTIGO Basic Inspection Path
that is, it is not translating, though it may be rotating. The inspector, however, is rotating and translating as it expects to circumnavigate the target to build up a feature map of the object. The path taken by the inspector around the target object lies on a sphere with the target object at the center, and is ideally circular, as shown in Figure 4-4. The figure shows the constant radius that should be maintained by the inspector, which is equivalent to maintaining a constant range to the target.
This simple planar path forms the basis of the initial investigation into inspection paths.
By examining the performance of the navigation algorithm to adjustments in the target
object conditions, as well as modifications to the inspection algorithms, this thesis will make an assessment of the performance and robustness of those algorithms.
4.2
Measurement Fidelity
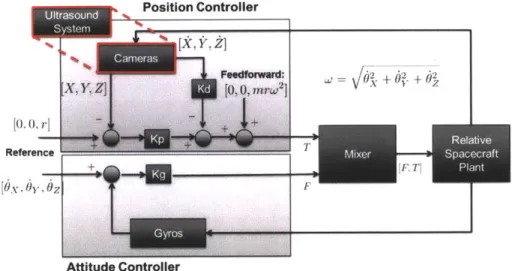
The block diagram formulation in Figure 4-5 describes the inspection estimation and con-trol approach that will be taken by the VERTIGO Phase I inspection. In addition to the inspector rotation rate data coming from the gyroscope on the SPHERES satellite, the
VER-TIGO Goggles gathers images of the target object. From the images, the cameras can
cal-culate X-, Y-, and Z-positions and rates of the target relative to the inspector. Because that hardware is not yet available on the ISS, the SPHERES ultrasound system is used to mimic the camera outputs. The use of a simple PD control law allows the algorithm to be used on nearly any system, regardless of computing capability.