HAL Id: hal-00302219
https://hal.archives-ouvertes.fr/hal-00302219
Submitted on 18 Oct 2006HAL is a multi-disciplinary open access
archive for the deposit and dissemination of sci-entific research documents, whether they are pub-lished or not. The documents may come from teaching and research institutions in France or abroad, or from public or private research centers.
L’archive ouverte pluridisciplinaire HAL, est destinée au dépôt et à la diffusion de documents scientifiques de niveau recherche, publiés ou non, émanant des établissements d’enseignement et de recherche français ou étrangers, des laboratoires publics ou privés.
Free radical modelling studies during the UK TORCH
Campaign in summer 2003
K. M. Emmerson, N. Carslaw, D. C. Carslaw, J. D. Lee, G. Mcfiggans, W.
Bloss, T. Gravestock, D. E. Heard, J. Hopkins, T. Ingham, et al.
To cite this version:
K. M. Emmerson, N. Carslaw, D. C. Carslaw, J. D. Lee, G. Mcfiggans, et al.. Free radical modelling studies during the UK TORCH Campaign in summer 2003. Atmospheric Chemistry and Physics Discussions, European Geosciences Union, 2006, 6 (5), pp.10523-10565. �hal-00302219�
ACPD
6, 10523–10565, 2006 TORCH 1 modelling team K. M. Emmerson et al. Title Page Abstract Introduction Conclusions References Tables Figures J I J I Back CloseFull Screen / Esc
Printer-friendly Version Interactive Discussion
EGU
Atmos. Chem. Phys. Discuss., 6, 10523–10565, 2006 www.atmos-chem-phys-discuss.net/6/10523/2006/ © Author(s) 2006. This work is licensed
under a Creative Commons License.
Atmospheric Chemistry and Physics Discussions
Free radical modelling studies during the
UK TORCH Campaign in summer 2003
K. M. Emmerson1,*, N. Carslaw1, D. C. Carslaw2, J. D. Lee3, G. McFiggans4, W. J. Bloss5, T. Gravestock5, D. E. Heard5, J. Hopkins3, T. Ingham5, M. J. Pilling5, S. C. Smith5, M. J. Jacob6,**, and P. S. Monks6
1
Environment Department, University of York, York, YO10 5DD, UK
2
Institute for Transport Studies, University of Leeds, Leeds, LS2 9JT, UK
3
Department of Chemistry, University of York, York, YO10 5DD, UK
4
School of Earth, Atmospheric and Environmental Science, University of Manchester, Manchester, M60 1QD, UK
5
School of Chemistry, University of Leeds, Leeds, LS2 9JT, UK
6
Department of Chemistry, University of Leicester, Leicester, LE1 7RH, UK
*
now at: School of Earth and Environment, University of Leeds, LS2 9JT, UK
**
now at: I ¨OZ (Interdisciplinary Environmental Research Centre), TU Bergakademie Freiberg, Brennhausgasse 14, 09599 Freiberg, Germany
Received: 31 August 2006 – Accepted: 13 October 2006 – Published: 18 October 2006 Correspondence to: N. Carslaw ([email protected])
ACPD
6, 10523–10565, 2006 TORCH 1 modelling team K. M. Emmerson et al. Title Page Abstract Introduction Conclusions References Tables Figures J I J I Back CloseFull Screen / Esc
Printer-friendly Version Interactive Discussion
EGU
Abstract
The Tropospheric ORganic CHemistry experiment (TORCH) took place during the heatwave of summer 2003 at Writtle College, a site 2 miles west of Chelmsford in Essex and 25 miles north east of London. The experiment was one of the most highly instrumented to date. A combination of a large number of days of simultaneous,
collo-5
cated measurements, a consequent wealth of model constraints and a highly detailed chemical mechanism, allowed the atmospheric chemistry of this site to be studied in detail. The concentrations of the hydroxyl radical, the hydroperoxy radical and the sum of peroxy radicals, were measured between 25 July and 31 August using laser-induced fluorescence at low pressure and the peroxy radical chemical amplifier techniques.
10
The concentrations of the radical species were predicted using a zero-dimensional box model based on the Master Chemical Mechanism version 3.1, which was constrained with the observed concentrations of relatively long-lived species. The model included a detailed parameterisation to account for heterogeneous loss of hydroperoxy radicals onto aerosol particles. Quantile-quantile plots were used to assess the model
per-15
formance in respect of the measured radical concentrations. On average, measured hydroxyl radical concentrations were over-predicted by 24%. Modelled and measured hydroperoxy radical concentrations agreed very well, with the model over-predicting on average by only 7%. The sum of peroxy radicals was under-predicted when com-pared with the respective measurements by 22%. OH initiation was dominated by the
20
reactions of excited oxygen atoms with water, nitrous acid photolysis and the ozone re-action with alkene species. Photolysis of aldehyde species was the main initiation route for HO2 and RO2. Termination, under all conditions, primarily involved reactions with NOxfor OH and heterogeneous chemistry on aerosol surfaces for HO2. The OH chain length varied between 2 and 8 cycles, the longer chain lengths occurring before and
af-25
ter the most polluted part of the campaign. Peak local ozone production of 17 ppb hr−1 occurred on 3 and 5 August, signifying the importance of local chemical processes to ozone production on these days. On the whole, agreement between model and
ACPD
6, 10523–10565, 2006 TORCH 1 modelling team K. M. Emmerson et al. Title Page Abstract Introduction Conclusions References Tables Figures J I J I Back CloseFull Screen / Esc
Printer-friendly Version Interactive Discussion
EGU
measured radicals is good, giving confidence that our understanding of atmospheres influenced by nearby urban sources is adequate.
1 Introduction
The hydroxyl radical (OH) is an important species in the atmosphere, which can react with almost all other species, oxidising them eventually to carbon dioxide and water.
5
OH has a short lifetime (<1 s in the mid-latitude continental boundary layer) and so its concentration is not directly affected by transport. Rather, the budget of OH is controlled by local concentrations of ozone (O3), water, sunlight, volatile organic com-pounds (VOCs), carbon monoxide (CO) and oxides of nitrogen (NOx).
In polluted, urban environments, high levels of anthropogenic VOCs cause OH to
10
be rapidly cycled to hydroperoxy (HO2) and organic peroxy (RO2) radicals, which in turn can react with NO to reform OH. The reaction of HO2 with NO also forms NO2, which can be photolysed, leading to the creation of O3. A single OH radical can initiate the degradation of many molecules of trace gases leading to not only their eventual removal from the atmosphere but also the formation of tropospheric O3. Clearly the
15
OH radical plays a pivotal role in photochemistry, and a complete understanding of the sources, sinks and cycling of OH is essential to understanding the chemistry of the atmosphere. For a more detailed review of radical chemistry in the boundary layer, the reader is referred to the review by Monks (2005).
Under clean conditions where NOx concentrations are low, the most important
20
source of OH tends to be the photolysis of O3 at wavelengths ≤340 nm. This reac-tion may yield an excited state oxygen atom (O1D), which can react with ambient water vapour to form two OH radicals. In polluted atmospheres, other photolytic sources be-come significant. Nitrous acid (HONO) can increase in concentration during the night in the presence of high levels of NO2 (Kurtenbach et al., 2001). The HONO formed
25
overnight can then be photolysed at wavelengths of light below 400 nm producing OH radicals at dawn. This reaction can be an important OH source in the early morning
ACPD
6, 10523–10565, 2006 TORCH 1 modelling team K. M. Emmerson et al. Title Page Abstract Introduction Conclusions References Tables Figures J I J I Back CloseFull Screen / Esc
Printer-friendly Version Interactive Discussion
EGU
hours, when high solar zenith angles prevent short wavelength UV light from pene-trating the lower troposphere and hence production of OH by photolysis of O3is sup-pressed. In addition, the photolysis of formaldehyde (HCHO), can lead to the formation of two HO2radicals: the photolysis of HCHO and other aldehydes occurs further into the visible region of the spectrum than that of ozone to produce OH, so allowing these
5
processes to become relatively more important at the ends of the day (Alicke et al., 2003).
OH and HO2 radicals also undergo propagation reactions. For instance, OH can react with CO or O3 to produce HO2, whilst its reactions with hydrocarbons lead to the formation of RO2. In the presence of NO, RO2 radicals are converted into HO2,
10
which can go on to react with NO (polluted atmospheres) or O3 (clean atmospheres) to reform OH.
Termination reactions also vary depending on the level of pollution. In clean atmo-spheres, the main sinks for HOx(sum of OH and HO2) are the self and cross-reactions of peroxy and hydroperoxy radicals, whilst in polluted atmospheres, most HOx is lost
15
through the reaction of OH with NO2to form nitric acid, HNO3.
This paper describes the use of a zero-dimensional photochemical box model to establish the sources and sinks for OH, HO2 and RO2 during the recent UK NERC (Natural Environment Research Council) TORCH (Tropospheric Organic Chemistry Ex-periment) campaign in Writtle, south-east England. The model incorporates a detailed
20
chemical mechanism (the Master Chemical Mechanism, MCM), which is essential to understand the complexities of radical processing in urban areas. This technique has been used frequently at remote marine boundary layer sites and in rural continen-tal environments, where models constrained with observations of longer-lived species have been used to predict radical concentrations for comparison with measurements
25
(Carslaw et al., 1999a, b, 2001, 2002; Martinez et al., 2003; Konrad et al., 2003; Ren et al., 2003; Sommariva et al., 2004).
Polluted environments have also been studied. During BERLIOZ (Berliner Ozone Ex-periment) in July and August 1998, good agreement was obtained between modelled
ACPD
6, 10523–10565, 2006 TORCH 1 modelling team K. M. Emmerson et al. Title Page Abstract Introduction Conclusions References Tables Figures J I J I Back CloseFull Screen / Esc
Printer-friendly Version Interactive Discussion
EGU
and measured OH at NOxconcentrations greater than 5 ppb for the 2 days studied, but modelled OH and HO2 was over-estimated by 100 and 40% respectively at low NOx (Konrad et al., 2003). Modelled RO2 was in good agreement with the measurements over the full range of observed NOxconcentrations. During the Los Angeles Free Rad-ical Experiment in September 1993, OH and HO2 concentrations were overpredicted
5
by ∼25–50% on average (George et al., 1999). The PM2.5 Technology Assessment and Characterisation Study (PMTACS) program was held in New York City in the sum-mer of 2001, and the measured to modelled ratio was 1.1 for OH, and 1.2 for HO2 (Ren et al., 2003). The model under estimation was attributed to a combination of a missing propagation route from HO2to OH (Tan et al., 2001) and to missing sources
10
for OH, although the chemical reaction scheme used in the model was highly simpli-fied (the RACM (Stockwell et al., 1997) scheme was used which adopts a lumping technique). In winter 2004, the OH measured to modelled ratio was 1.2, but HO2was under-predicted by a factor of 6 (Ren et al., 2006). This under-prediction was conjec-tured to be a lack of HOx production and/or propagation terms, which do not involve
15
the production or loss of OH.
Observed concentrations of OH and HO2during the Southern Oxidants Study (SOS) in Nashville, Tennessee in midsummer 1999, were factors of 1.3 and 1.6 higher than modelled OH and HO2, respectively (Martinez et al., 2003). The authors speculated that an unknown OH production route which occurred both day and night and was well
20
correlated with HO2, O3and HCHO, could go some way to explaining the model under-prediction of OH and HO2. The Mexico City Metropolitan Area (MCMA) study during April 2003 showed that under very polluted conditions, modelled OH and HO2 were under-predicted at night and during the morning rush hour, but over-predicted by 30% at noon (Shirley et al., 2005).
25
The Pollution of the Urban Midlands Atmosphere (PUMA) campaign (Emmerson et al., 2005a, b; Harrison et al., 2006; Heard et al., 2004) took place in Birmingham city centre during summer 1999 and winter 2000. Whilst there was generally good agreement between the modelled and measured OH concentrations, the model tended
ACPD
6, 10523–10565, 2006 TORCH 1 modelling team K. M. Emmerson et al. Title Page Abstract Introduction Conclusions References Tables Figures J I J I Back CloseFull Screen / Esc
Printer-friendly Version Interactive Discussion
EGU
to under-predict during daylight hours (between 11:00 and 15:00 h), with modelled to measured ratios of 0.6 and 0.5 for OH during summer and winter respectively. However, the average model under-predictions were greatly skewed by a few occasions where the measured values became very high with no obvious explanation (Emmerson et al., 2005a). Measurements of HO2 were over-predicted by the model by a factor of
5
2 during the day, although only a very simple parameterisation was used to treat loss of HO2to aerosol surface. A rate of production analysis carried out to investigate key radical sources and sinks indicated that oxygenated VOCs could be important in urban atmospheres, both for radical initiation (through photolysis of carbonyls for instance) and also in terms of radical propagation from OH to RO2(Emmerson et al., 2005b).
10
The TORCH campaign took place during July and August 2003, in the grounds of Writtle College in the southeast of England. Writtle is ideally placed to examine the chemical processes occurring within air parcels travelling from the continent and over London, situated as it is some 25 miles north east of London. During the campaign measurements were made of 52 gas-phase species as well as physical and
chemi-15
cal aerosol characteristics, meteorological parameters and various photolysis rates. In particular, following the identification of the potential role of oxygenated VOCs in pro-cessing radicals during the PUMA campaign (Emmerson et al., 2005b), measurements of several of these species were made including methanol, ethanol, propanol, acetone, formaldehyde, acetaldehyde, methyl vinyl ketone and methacrolein (Lee et al., 2006).
20
Southern England experienced a heat wave during August 2003, with temperatures peaking at 38.5◦C in Kent. A widespread, regional smog enveloped the southern UK, as well as northern parts of France, Germany and the Netherlands. During this period, over 2000 excess deaths occurred in England and Wales, with ∼800 thought to be related to the high ozone and PM10 concentrations (Stedman, 2004).
25
One of the major objectives of the TORCH campaign was to compare measured radical concentrations with results from comprehensive chemical mechanisms. In this paper, the TORCH experiment has been used to provide a test of in situ chemistry in partially processed polluted air, by comparing measured hydroxyl (OH), hydroperoxy
ACPD
6, 10523–10565, 2006 TORCH 1 modelling team K. M. Emmerson et al. Title Page Abstract Introduction Conclusions References Tables Figures J I J I Back CloseFull Screen / Esc
Printer-friendly Version Interactive Discussion
EGU
(HO2) and organic peroxy (RO2) radical concentrations with those predicted by mod-els constrained by a comprehensive experimental dataset of organic and inorganic species. In addition, a rate of production analysis (ROPA) has been used to study the ∼14 000 reactions in the model, to identify which reactions and species are key for driving the radical chemistry.
5
2 Experimental
TORCH was a consortium project involving 8 UK universities (Aberystwyth, Bristol, Im-perial, Leeds, Leicester, Manchester, UEA and York), and took place from 25 July to 31 August 2003. Simultaneous measurements were made of meteorological condi-tions, aerosol size distribution and composition, OH, HO2, HO2+ ΣRO2, non-methane
10
hydrocarbons (NMHC), O-VOCs, CO, NO, NO2, H2O, O3and the photolysis rates of ac-etaldehyde, acetone, hydrogen peroxide, formaldehyde, nitric acid, nitrous acid, PAN, NO2and ozone (→O1D). A brief summary of the main measurements used to constrain or compare with the model follows.
The site at Writtle in Essex is surrounded by crop-based agriculture (sunflowers and
15
grain), and the area in the immediate vicinity of the site is a meadow field normally used as an overflow car park for the college during term time. The college was not busy during the fieldwork. There were gaps in the measured data owing to instrument downtime (HOxmeasurements in particular between 6–18 August) and a power failure on 11 August. With the exception of the given dates, data coverage was very good,
20
enabling modelling studies of the radicals to be undertaken for most of the period between 27 July and 30 August.
Ozone was measured on site using a UV absorption detector (Thermo Environmen-tal Instruments, Model 49C). The estimated uncertainty in the O3 concentrations was ±2 ppbV. NO was measured using a NO/O3chemiluminescence analyzer (Thermo
En-25
vironmental Instruments, Model 42C – trace level), with the instrument sequentially measuring NO and NOx(NO+ NO2) by use of a heated Molybdenum converter. The
ACPD
6, 10523–10565, 2006 TORCH 1 modelling team K. M. Emmerson et al. Title Page Abstract Introduction Conclusions References Tables Figures J I J I Back CloseFull Screen / Esc
Printer-friendly Version Interactive Discussion
EGU
detection limit for the instrument was approximately 0.1 ppbV for NO and total NOx. Calibrations for NO and NO2were carried out using a gas standard (Air Products) and a resulting uncertainty for NO and NO2measurements was estimated to be ±0.2 ppbV. C2 – C7 NMHCs and C2 – C5 oxygenated volatile organic compounds (O-VOCs) including alcohols, aldehydes and ketones were measured using a two-column, gas
5
chromatograph (GC) with flame-ionisation detector as described in detail by Hopkins et al. (2002) and in Lee et al. (2006). The entire analysis process took around 1 h (including a 10-min sampling period), and was fully automated. Detection limits were between 1 and 10 pptV for NMHCs and 10–40 pptV for O-VOCs.
Measurements of OH and HO2radicals were made by the University of Leeds using
10
on-resonance, low pressure laser-induced fluorescence (LIF) at 308 nm, through the FAGE (Fluorescence Assay with Gas Expansion) technique (Heard and Pilling, 2003 and references therein). The instrument was based upon the design deployed in pre-vious campaigns, most recently described in Smith et al. (2005). In brief, the Leeds FAGE system employs a solid-state, Nd:YAG pumped Ti:Sapphire laser to generate
15
308 nm radiation for LIF excitation (see Bloss et al., 2003 for a full description of the laser system) which is directed into two low pressure fluorescence cells using fibre op-tic cables. Thus, using two separate fluorescence cells it is possible to simultaneously detect OH and HO2(the latter through chemical conversion to OH via addition of NO), by collecting the resultant OH fluorescence, at ∼308 nm, using gated photomultipliers.
20
Calibrations were carried out daily during the campaign using the photolysis of water vapour at 185 nm coupled with O3actinometry, with average daytime detection limits of 3.75×10⁵and 2.77×10⁶molecule cm−3 for OH and HO2respectively. The accuracy in the reported measurements is determined by the calibration accuracy and is 22% and 25% respectively (1σ) for OH and HO2(Smith et al., 1995). The precision of the
instru-25
ment (quoted as a percentage) will depend upon the concentration measured, and is controlled by fluctuations in the background signal (solar and laser-induced). The stan-dard deviation of the background signal was ±2.6 counts s−1, and hence for [OH] = 3×10⁶molecule cm−3, the precision is 20%, giving a total uncertainty in quadrature of
ACPD
6, 10523–10565, 2006 TORCH 1 modelling team K. M. Emmerson et al. Title Page Abstract Introduction Conclusions References Tables Figures J I J I Back CloseFull Screen / Esc
Printer-friendly Version Interactive Discussion
EGU
30% (Smith et al., 1995). For [HO2]= 1×10⁸molecule cm−3(4 pptv), the corresponding 1σ uncertainty is 28% (Smith et al., 1995).
Measurements of peroxy radicals (HO2+ ΣRO2) were carried out using the PEr-oxy Radical Chemical Amplifier (PERCA) technique (Fleming et al., 2005). Briefly, the method relies upon the HO2 and OH radical-catalysed conversion of NO and CO into
5
CO2and NO2respectively, through addition of NO and CO into the inlet region. Organic peroxy radicals are converted into HO2 in the presence of NO to produce NO2 with varying efficiencies. The yields of both CO2and NO2are equal to CL * ([RO2]+ [HO2] + [OH]), where CL is the chain length, i.e. the number of HO2/OH inter-conversion
cy-cles that occur before radical termination. The yield of NO2was measured using
com-10
mercial LMA-3 detectors, which was converted into [HO2+ ΣRO2] using∆[NO2]/CL. The detector signal consists of a small NO2 enhancement from peroxy radical con-version on a much larger signal from ambient NO2 and titration of ambient O3 by NO added in the inlets. The detectors were calibrated each day by plotting minute values of this background signal with ambient measurements of NO2 and O3 from
commer-15
cial instruments (see earlier in this section), which were sampling air close to where the PERCA inlets were located. The chain length was calculated using a calibration source based upon the photolysis of CH3I at 253.7 nm to yield CH3O2 at varying concentra-tions (Clemitshaw et al., 1997). A humidity correction factor equation (using ambient humidity and inlet temperatures) was applied to all PERCA data following Salisbury et
20
al. (2002). Raw data were captured at a frequency of 1 Hz and peroxy radical mixing ratios were derived on a 1-min basis with a 1σ error of 35%.
The rates of photolysis of a variety of species were measured using a 2π sr spectral radiometer. The spectral radiometer used an imaging spectrograph and a diode array detector to spectrally resolve sunlight in the range 285–710 nm and raw intensities
25
were converted to actinic fluxes using primary irradiance standards (NIST) at 1nm intervals. Photolysis frequencies were then calculated using these fluxes and tabulated absorption cross-sections and photodissociation quantum yields (Edwards and Monks, 2003; Monks et al., 2004).
ACPD
6, 10523–10565, 2006 TORCH 1 modelling team K. M. Emmerson et al. Title Page Abstract Introduction Conclusions References Tables Figures J I J I Back CloseFull Screen / Esc
Printer-friendly Version Interactive Discussion
EGU
3 The model
The Master Chemical Mechanism version 3.1 (MCM, available online at (http://
www.chem.leeds.ac.uk/Atmospheric/MCM/mcmproj.html) contains near-explicit chem-ical degradation schemes for 135 primary emitted VOCs, based on the most impor-tant species in the UK National Atmospheric Emissions Inventory (Jenkin et al., 2003;
5
Saunders et al., 2003), resulting in ∼14 000 reactions involving ∼5000 molecular and free radical species. The MCM is a comprehensive mechanism treating each degra-dation step explicitly and as such, makes no simplifications through the use of lumping techniques or the adoption of surrogate species. The MCM is as closely linked as pos-sible to laboratory measurements and theoretical studies on component elementary
10
reactions and so is more directly linked to available experimental data than are lumped mechanisms. The rates of three body reactions within the MCM were updated following recent recommendations (IUPAC, 2005).
The TORCH model utilises measurements of longer-lived species and physical pa-rameters (such as meteorological data and photolysis rates) as input constraints at
15
15-min intervals. Predicted concentrations of the short-lived radical species are then compared with measurements. There were measurements of 39 VOC species from the field campaign that are primary emitted species with degradation mechanisms avail-able in the MCM. These included 13 C2-C8 alkanes, 11 C2-C5 alkenes, 6 aromatic species, acetylene, 1-3-butadiene, isoprene, formaldehyde, acetaldehyde, methanol,
20
ethanol, propanol and acetone. A further 74 VOC species were introduced to the model via straight-line relationships with benzene, o-xylene and acetone, which were all mea-sured. These relationships were derived by running a trajectory model containing the same MCM chemistry and driven by emissions suitable for polluted conditions, and using the output to derive relationships between benzene, o-xylene and acetone and
25
the unmeasured species (with r2 varying between 0.83 and 1). Consequently, there are model inputs for 84% of the primary emitted species in the model that are directly or indirectly based on measured values. In addition, the model was constrained with
ACPD
6, 10523–10565, 2006 TORCH 1 modelling team K. M. Emmerson et al. Title Page Abstract Introduction Conclusions References Tables Figures J I J I Back CloseFull Screen / Esc
Printer-friendly Version Interactive Discussion
EGU
measured values of NOx, O3, PAN and CO, as well as temperature and water vapour concentration.
Many of the important photolysis rates were determined experimentally during TORCH, as detailed in the previous section. The remaining photolysis rates in the model were evaluated using the 2-stream isentropic approach used by Hough (1988),
5
which assumes clear sky, summertime conditions. A cloud attenuation factor (CAF) was derived to normalise the calculated photolysis rates, by comparing the measured j(O1D) rate with the theoretical maximum calculated by the model for the specific lat-itude and time of year. The CAF was then used to correct the calculated photolysis coefficients.
10
Dry deposition rates were assigned to 1105 species and applied over the depth of the mixing layer, which varies in the model between 300 m at nighttime, increasing to 1300 m as the boundary layer collapses in the morning. The values were taken from Derwent (1996) for HNO3 (2 cm s−1), NO2 (0.15 cm s−1), PAN (0.2 cm s−1, assumed the same for 216 PAN-type species), O3 (0.5 cm s−1) and SO2 (0.5 cm s−1) and from
15
Brasseur et al. (1998) for methyl- and ethyl-nitrate (1.1 cm s−1, assumed the same for 286 organic nitrates), HCHO (0.33 cm s−1 and assumed the same for 222 organic aldehydes), H2O2 (1.1 cm s−1) and CH3OOH (0.55 cm s−1 and assumed the same for 976 organic peroxides).
The concentrations are calculated every minute using Facsimile for Windows
soft-20
ware and averaged to 15 min to be consistent with the time interval of the input con-straints, before being compared with the radical data. The model was run with the same input data for 4 consecutive days in order for the calculated radical concentra-tions to achieve steady state. The final 24 h of the model run were then used as the “model day” for comparison with the measurements. Running the model for longer than
25
4 days made no appreciable difference (<0.6%) to the predicted results.
Unlike in our previous work in urban areas (Emmerson et al., 2005a, b), a loss route of HO2onto aerosol surfaces has been calculated using measurements of aerosol size and number distributions (following Haggerstone et al., 2005), and takes into account
ACPD
6, 10523–10565, 2006 TORCH 1 modelling team K. M. Emmerson et al. Title Page Abstract Introduction Conclusions References Tables Figures J I J I Back CloseFull Screen / Esc
Printer-friendly Version Interactive Discussion
EGU
diffusion of HO2 to the particle surface and interfacial mass transport. Using the ap-propriate aerosol measurements, heterogeneous loss of HO2was treated using a rate coefficient, kt, integrated over all bin sizes of particles up to 768 nm (1):
kt= Z∞ 0 d V (r) dr r2 3Dg + 4r 3νγ !−1 dr (1)
where kt is the rate of loss of HO2to the aerosol surface, V is the volume of aerosol,
5
r is the particle radius (in a particular size bin), Dg is the gas diffusivity constant, ν is
the mean molecular velocity and γ is the accommodation coefficient for uptake of HO2 onto the aerosols. In the atmosphere, γ is a function of the aerosol composition and radius: the composition of the aerosol surface is assumed to be homogeneous for the purposes of this parameterisation.
10
There are few measurements of the accommodation coefficient of HO2: the limited measurements available suggest a value in the range from 0.01–0.8, with a strong de-pendence on the surface characteristics and temperature (Haggerstone et al., 2005; Thornton and Abbat, 2005). Haggerstone et al. (2005) carried out a review of the available literature, and found that a value of 0.2 was most appropriate for conditions
15
experienced during a clean air campaign in the marine boundary layer at Cape Grim in Tasmania. It has been suggested that the value of the accommodation coefficient for HO2 may approach unity in urban areas (Saylor, 1997). In this work we have some-what arbitrarily assumed a value of 0.5, somewhere in the middle of reported values. The model sensitivity to the range of values was tested and it was found that the HO2
20
concentrations decreased by ∼18% when γ was changed from 0.02 to 1.0. These results stress the need for further laboratory based measurements of the accommoda-tion coefficient for HO2 on a range of surfaces applicable to the urban and suburban atmosphere.
A heterogeneous production rate for HONO, as recommended by Kurtenbach
25
et al. (2001) has been parameterised in the model. By considering the rela-tionship with NO2 concentrations, Kurtenbach et al. (2001) derive kHONO to be
ACPD
6, 10523–10565, 2006 TORCH 1 modelling team K. M. Emmerson et al. Title Page Abstract Introduction Conclusions References Tables Figures J I J I Back CloseFull Screen / Esc
Printer-friendly Version Interactive Discussion
EGU
(2.9±1.8)×10−3m min−1. This assumes that HONO is formed when NO2 reacts with H2O in the presence of an aerosol surface. This route, rather than a HONO source from the ground surface is appropriate because the FAGE measurement inlet (and hence the model box height) is 6–7 m from the ground.
As well as predicting radical concentrations, the model was used to carry out a rate
5
of production analysis (ROPA). The first stage in the ROPA involved isolating all reac-tions that play a part in the initiation, propagation or termination of OH, HO2and RO2. The rates of the key reactions for OH (reaction with SO2, NO2, NO, H2, HO2, H2O2, O3, CO and HCHO and production from HNO3, HONO and H2O2photolysis along with the reaction of O(1D) with water) and for HO2 (reaction with NO, HO2, O3 and loss
10
on aerosol and production from formaldehyde photolysis) were considered individually, but the remaining reactions were grouped to aid interpretation. For instance, the re-action rate for the production of HO2from the photolysis of HCHO was studied as an individual reaction, but the rate of HO2production from the photolysis of all other alde-hyde species was grouped. A complete list of the groupings is detailed in Emmerson
15
et al. (2005b).
4 Results and discussion
The aim of the TORCH experiment was to sample partially processed, recently polluted air coming from London. This situation occurred for the early part of the campaign (28 July–3 August), when air parcels originated in the Atlantic, and then passed over
20
the Southern UK and London before reaching the site from a southerly/south-westerly direction. The air was also Atlantic in origin on the 4 and 5 August, but passed over northern France and the North Sea before arriving at the site from an easterly direction. A hot, stagnant period dominated from the 6–10 August (the heatwave period), when a high pressure weather system presided over the UK and much of Western Europe.
25
The high pressure system was associated with very low (westerly) wind speeds (0.5– 5 ms−1) and maximum daily temperatures of 26–37◦C. Concentrations of many species
ACPD
6, 10523–10565, 2006 TORCH 1 modelling team K. M. Emmerson et al. Title Page Abstract Introduction Conclusions References Tables Figures J I J I Back CloseFull Screen / Esc
Printer-friendly Version Interactive Discussion
EGU
increased at this time (Lee et al., 2006), although OH and HO2 measurements were unavailable. From the 13–24 August, the air was Atlantic in origin, and passed over the UK (via the Midlands) before arriving at the site in a westerly/north-westerly direction. Finally, the end of the campaign was dominated by air masses of an Arctic origin, which travelled over the North Sea before arriving at Writtle from a northerly/north-easterly
5
direction (see Lee et al., 2006) for more details). Thirty-two days of measurements were available to carry out modelling studies.
4.1 The hydroxyl radical, OH
Measurements of [OH] show a diurnal cycle with daytime maxima between 1.2– 7.5×10⁶molecule cm−3. There were six nights on which [OH] of up to 8.5×10⁵ were
10
measured (mean night-time detection limit 3.4×10⁴molecule cm−3) indicative of sig-nificant night-time sources of OH. The nighttime data will be the subject of a future publication and will not be discussed further here. The average [OH] profile shows a rise that starts early in the morning (∼05:00 h) and persists into the evening (∼18:30 h) when levels of j(O1D) are not significant. The 24 h mean [OH] for the entire campaign
15
(derived from hourly means) was found to be 1.4×10⁶molecule cm−3.
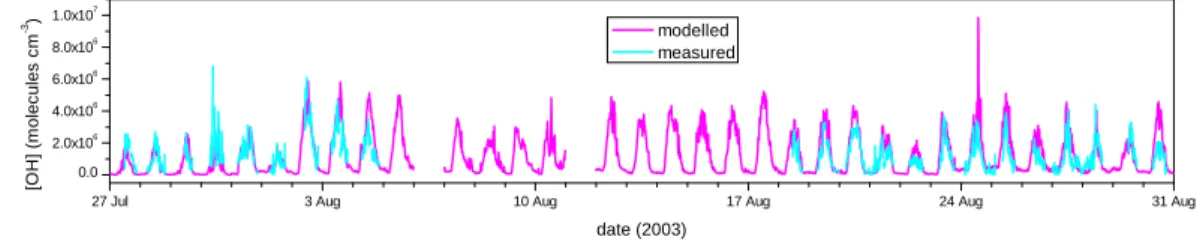
The time series of calculated and measured OH concentrations are shown in Fig. 1 (note that all figures and times referred to in the text are in GMT). The agree-ment between modelled and measured OH concentrations is generally good. Be-tween 27–29 July, peak modelled and measured concentrations are 2.6×10⁶ and
20
2.7×10⁶molecule cm−3, respectively. Agreement is also particularly good between 27– 29 August where peak OH concentrations are 4.4×10⁶molecule cm−3 for both model and measurements. There are two dates on which there are significant departures in the agreement; 30 July where the measurements are a factor of 1.4 higher than the modelled OH concentrations between 11:00–15:00 h, and on 24 August , where the
25
model over-predicts OH by a factor of 1.5 between 11:00–15:00 h.
Figure 2 shows the modelled and measured OH data as two diurnal plots. Each 15 min period of the day has been averaged for all the days where there are model
ACPD
6, 10523–10565, 2006 TORCH 1 modelling team K. M. Emmerson et al. Title Page Abstract Introduction Conclusions References Tables Figures J I J I Back CloseFull Screen / Esc
Printer-friendly Version Interactive Discussion
EGU
and measurement data available. Figure 2 shows that the greatest deviation between model and measurements occurs between 11:00–16:00 h and that agreement is gen-erally better before and after this period.
The deviation between 11:00–16:00 h is interesting: these hours are certainly those of maximum chemical processing and indeed, concentrations of ozone remain high
5
well into the afternoon. The model displays an asymmetric diurnal profile of OH, whilst that of the measurements appears to be centred around solar noon. In terms of OH initiation, the reaction of O(1D) with water, the group of reactions of ozone with alkenes and monoterpenes and photolysis of HONO are of similar importance (31, 21 and 21×105molecule cm−3s−1) averaged over the period from 11:00–15:00 h for the whole
10
campaign. With the exception of HONO photolysis, these initiation rates are based on measurements. Although the concentration of HONO is estimated by the model, its largest impact will be at dawn, when the overnight reservoir is rapidly photolysed. The agreement between modelled and measured OH is good at this stage, so the parameterisation adopted to calculate HONO concentration is unlikely to be the sole
15
cause of the observed deviation.
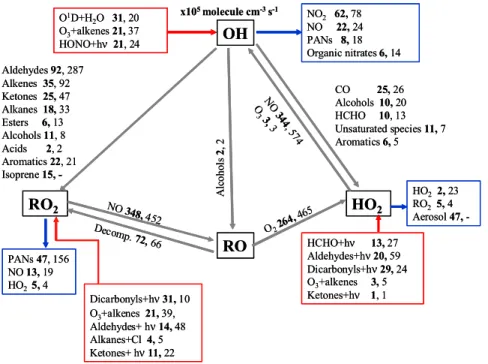
The rate of production analyses are summarised in Table 1, which shows reaction rates for all initiation (radical product(s), no radical reactants), termination (radical re-actant(s), no radical products) and propagation (radical to radical transformation) reac-tions of OH, HO2and RO2for each day of the campaign between 11:00–15:00 h where
20
measurements were available. Average concentrations of the key model input parame-ters NOx, O3, j(O1D) and ppbC (parts per billion of carbon in the form of VOCs) are also shown in Table 1 to aid interpretation of results. The O1D+H2O route dominates OH initiation (42%) on average, with the photolysis of HONO and O3+alkenes both making up 29%. During the heatwave period, 53% of OH initiation occurred via O1D+H2O and
25
43% from O3+alkenes. Only 3% of OH initiation occurred through HONO photolysis at this time. Production of OH from HONO photolysis during TORCH was greatest between 24 and 28 August.
ACPD
6, 10523–10565, 2006 TORCH 1 modelling team K. M. Emmerson et al. Title Page Abstract Introduction Conclusions References Tables Figures J I J I Back CloseFull Screen / Esc
Printer-friendly Version Interactive Discussion
EGU
157×105molecule cm−3s−1. 9 August was within the heatwave, when the average concentration of measured VOCs was 70 ppbC, with corresponding NOx and O3 con-centrations of 10 and 93 ppb, respectively (Table 1). Lowest OH initiation took place during a north Atlantic/northern UK trajectory path on 30 July with a production rate of just 21×105molecule cm−3s−1. Measured VOC concentrations on this day were
5
31 ppbC, with NOx at 7 ppb and an O3concentration of 37 ppb.
Radical termination via OH during TORCH was due mainly to reaction with NOx species, NO2(57%) and NO (16%). Average concentrations of NO and NO2over the TORCH campaign were 3 ppb and 8 ppb, respectively, giving an NO:NO2 ratio of 0.4, similar to that found for the summer PUMA campaign (Emmerson et al., 2005a). Other
10
important reactions were with various unsaturated species (9%), PAN species (8%) and organic nitrates (6%). The dominance of the nitrated species is clear, and shows how loss of the OH radical is almost entirely (88%) dependent on them.
Reaction with NO2is more important during the early part of the campaign causing termination of 71% of the OH radicals with a further 14% through reaction with NO.
15
During the heatwave period, 56% of OH is lost through reaction with NO2but only 4% lost due to reaction with NO. The air mass was stagnant under these conditions and therefore aged, containing mainly secondary oxidised species. Hence, PAN species account for 13% of OH termination, with unsaturated species 14% during the heatwave. Greatest OH termination takes place on 5 August with 299×105molecule cm−3s−1and
20
the lowest rate is 28×105molecule cm−3s−1on 27 July (Table 1). 4.2 The hydroperoxy radical, HO2
Diurnal profiles in [HO2] were much less pronounced than for [OH] and in sev-eral cases asymmetric about noon with secondary peaks in [HO2] occurring in the late afternoon/early evening. Noon-time maxima varied between 0.16–
25
3.3×10⁸molecule cm−3(0.6–13.5 pptV). There were night-time HO2radicals above the daily calculated time detection limit on nine nights of the campaign (mean
ACPD
6, 10523–10565, 2006 TORCH 1 modelling team K. M. Emmerson et al. Title Page Abstract Introduction Conclusions References Tables Figures J I J I Back CloseFull Screen / Esc
Printer-friendly Version Interactive Discussion
EGU
time detection limit 1.3×10⁶molecule cm−3) with concentrations of between 0.02 and 1.00×10⁸molecule cm−3(0.1–4.1 pptV). A peak in NO at ∼ 06:00 h (attributed to a com-bination of the collapse in the boundary layer and morning rush hour traffic) causes a concurrent suppression in HO2. Despite a rise in the rate of recycling of HO2 via re-action with NO, there is no rise in [OH] as this increased OH production is balanced
5
out by an increased destruction through reaction with NO2and other OH sinks that are expelled with NOx(e.g. VOCs). The 24-h mean [HO2] for the entire campaign (derived from hourly averages) was found to be 6.2×10⁷molecule cm−3 (2.5 pptV).
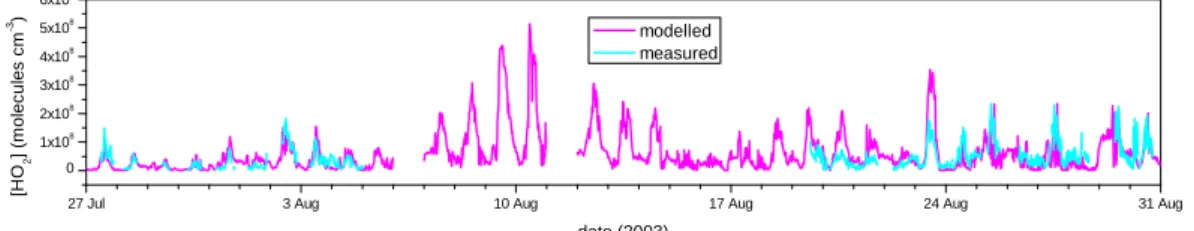
The time series of modelled and measured HO2concentrations is shown in Fig. 3. The model comparison with measurements is generally very good and particularly
dur-10
ing the early part of the campaign between 28–30 July and also after 25 August. Peak concentrations are 6.1×10⁷molecule cm−3for model and measured HO2between 28– 30 July and 2.1×10⁸and 2.4×10⁸molecule cm−3for model and measurements respec-tively, after 25 August. The model tends to over-predict during the westerly air parcels between 19 and 24 August, with the majority of the over-prediction occurring after
15
noon. Modelled HO2on 23 August is a factor of 2 higher between 11:00–15:00 h than the measurements and is the most significant departure in agreement for the whole campaign. Generally there is a slight model under-prediction of the measurements during the latter period of the campaign.
The agreement between model and measurements is very good. In previous
cam-20
paigns employing measurement-constrained models, HO2measurements have gener-ally been significantly over-predicted by the model (Emmerson et al., 2005a; Carslaw et al., 2001, 2002; Sommariva et al., 2004) or under-predicted (Martinez et al., 2003; Ren et al., 2006). An important difference in the current work is a better representa-tion of the heterogeneous loss of HO2 to aerosol surface reactions, which was found
25
previously to make a large difference in the marine boundary layer (Haggerstone et al., 2005). In addition, many more species are constrained than in most previous campaigns including more oxygenated species, some of which play a key role in HO2 radical initiation as shown subsequently.
ACPD
6, 10523–10565, 2006 TORCH 1 modelling team K. M. Emmerson et al. Title Page Abstract Introduction Conclusions References Tables Figures J I J I Back CloseFull Screen / Esc
Printer-friendly Version Interactive Discussion
EGU
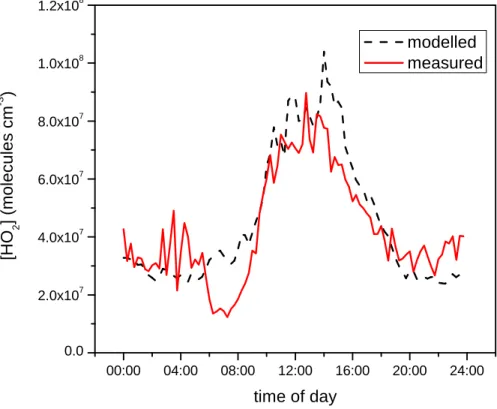
Figure 4 shows the modelled and measured HO2 data as two diurnal plots. Each 15 min period of the day has been averaged for all the days where there are model and measurement data available. The greatest deviation between model and measure-ments occurs between 06:00–08:30 but agreement is excellent before and after this period. HO2initiation at this time is dominated by the photolysis of carbonyl species,
5
so the model may be overestimating their impact early in the morning.
The reaction rates for initiation and termination of HO2radicals are shown in Table 1. During the first four days of the campaign, photolysis of HCHO produces 62% of new HO2 radicals, but becomes less important for the rest of the campaign (24%) as pho-tolysis of the groups of dicarbonyl and aldehyde species contributes 44% and 29% on
10
average, respectively. HO2initiation rates vary between 59×105molecule cm−3s−1on 30 July, to 1245×105molecule cm−3s−1on 9 August.
With the addition of the new heterogeneous loss mechanism via aerosols for HO2 in TORCH, aerosol surface was responsible for 83% of HO2 termina-tion reactermina-tions. Maximum termination of HO2 radicals took place on 9 August
15
(1397×105molecule cm−3s−1). The aerosol loss route is greatest during the early part of the campaign, when aerosol surface to volume ratios were largest (maximum value of the rate coefficient, kt was 0.8 molecule cm−3). This result demonstrates the need for an accurate determination of the accommodation coefficient for HO2 under typical urban and suburban conditions. The calculation of the termination rate owing to this
20
reaction depends critically on the accommodation coefficient used, the value of which is subject to significant uncertainty as discussed earlier.
The chemistry during the campaign differs in terms of the dominant HO2 initiation and termination reactions. As a campaign average, initiation via HO2 occurs mainly through dicarbonyl photolysis (44%), aldehyde photolysis (29%) and HCHO photolysis
25
(24%). During the heatwave period, there was a similar contribution from dicarbonyl species (42%), with less from the photolysis of formaldehyde (15%) and more from other aldehyde species (35%). Termination of HO2was always dominated by loss to aerosol particles in all regimes, (83% on average and 87% for the heatwave period).
ACPD
6, 10523–10565, 2006 TORCH 1 modelling team K. M. Emmerson et al. Title Page Abstract Introduction Conclusions References Tables Figures J I J I Back CloseFull Screen / Esc
Printer-friendly Version Interactive Discussion
EGU
These results confirm the suggestion of Saylor (1997), that under polluted conditions, the magnitude of heterogeneous HO2 loss may be a significant fraction of the gas-phase chemical loss.
4.3 HO2:OH ratios
15 min modelled and measured HO2:OH ratios are plotted against measured NO
con-5
centrations in Fig. 5. HO2 reacts with NO to regenerate OH; therefore the HO2:OH ratio will decrease at higher concentrations of NO (Stevens et al., 1997; Ren et al., 2003). On average NO concentrations were 2.8 ppb during the campaign, with a peak of ∼45 ppb on 28 July. Figure 5 shows much more scatter in the measured data with NO compared with the modelled as would be expected.
10
To highlight the relationships in Fig. 5, locally weighted regression smoothing (LOESS) lines have been fitted (Cleveland, 1979). These show that both the mea-sured and modelled ratios decrease with increasing NO as expected. However, the measured ratio shows a much shallower slope than the model. Modelled HO2:OH ra-tios also showed a stronger relationship with NO than measured, in the PUMA summer
15
campaign of 1999 (Emmerson et al., 2005a), at PMTACs (Ren et al., 2003), and during BERLIOZ (Konrad et al., 2003). The TORCH results are also similar to those found during a rural study in central Pennsylvania (Ren et al., 2005), except that the point where the measured and modelled slopes crossed was at ∼0.2 ppb NO ca. 2 ppb for TORCH. Ren et al. (2005) concluded that the HO2/OH ratio variation as a function of
20
NO was not well captured by their model and the same conclusion can be applied to the TORCH campaign and the other studies quoted. The reason for this discrepancy is not readily apparent, but clearly warrants further investigation.
4.4 Hydroperoxy and the sum of organic peroxy radicals, [HO2+ ΣRO2]
The time series of modelled to measured [HO2+ ΣRO2] is shown in Fig. 6. The
cam-25
mag-ACPD
6, 10523–10565, 2006 TORCH 1 modelling team K. M. Emmerson et al. Title Page Abstract Introduction Conclusions References Tables Figures J I J I Back CloseFull Screen / Esc
Printer-friendly Version Interactive Discussion
EGU
nitude to that from the BERLIOZ campaign (Volz-Thomas et al., 2003). In both cases concentrations have a broad midday to mid-afternoon peak before falling off to a min-imum at around 18:00 to 19:00 h. A smaller maxmin-imum occurs at 20:00 to 21:00 h followed by a gradual drop in concentrations to a minimum at 05:00 to 06:00 h. The daytime maximum mixing ratio is somewhat higher for TORCH than for BERLIOZ
al-5
though the agreement is much better if the values from the heatwave period are not included in the average.
There is an under-prediction in the modelled [HO2+ ΣRO2] when compared to the measurements, in contrast to the good agreement when HO2 radicals are consid-ered alone. The 15 min average diurnal sequence for the whole campaign is shown
10
in Fig. 7. Excellent agreement is observed over night between 00:00 and 03:45 h, with a departure following sunrise for the duration of the daylight period of the day. The measured RO2:HO2ratio (calculated by subtracting measured HO2by FAGE from the (HO2+ ΣRO2) concentrations measured by PERCA) is 6.8 as a campaign average over the 11:00–15:00 h period compared to 3.9 for the equivalent model value. Both of
15
these values are high compared to the BERLIOZ campaign, where the equivalent ratio was 1.0 (Holland et al., 2003).
The majority of RO2production between 11:00 and 15:00 h averaged over the cam-paign, occurs via the photolysis of dicarbonyl species (40%), O3+alkenes (22%) and the photolysis of aldehydes (17%). During the heatwave period this does not alter
sig-20
nificantly with 30% and 17% for the photolysis of dicarbonyl species and aldehydes respectively, and 29% RO2 production from O3+alkenes. RO2 sink mechanisms in-clude PAN production from RCO3(72%), with 20% occurring on reaction with NO for the whole campaign, but the PAN route represents 63% and NO route represents 12% of the heatwave RO2 sink, due to the stagnation of the air mass and therefore higher
25
NO2 concentrations. A further 17% of RO2 is lost via RO2+HO2 in the heatwave pe-riod, which corresponds to 5% over the whole campaign. On balance, the PAN species act as a net sink of RCO3radicals under the TORCH conditions.
One striking feature of the datasets is that the modelled HO2 and RO2 levels, and 10542
ACPD
6, 10523–10565, 2006 TORCH 1 modelling team K. M. Emmerson et al. Title Page Abstract Introduction Conclusions References Tables Figures J I J I Back CloseFull Screen / Esc
Printer-friendly Version Interactive Discussion
EGU
the measured RO2, are significantly higher during the heatwave period than for the rest of the campaign. Interestingly, the modelled OH does not appear to be elevated, suggesting that in the heatwave period, there were more sources and sinks of OH and so there was a degree of buffering of the resulting OH concentration. In fact, Table 1 shows that although OH initiation increased in importance under heatwave conditions,
5
the total flux of OH to RO2also increased acting as a counter-balance.
4.5 Radical propagation
The total average transfer of OH→HO2 radicals during the TORCH campaign is 66×105molecule cm−3s−1 and occurs mainly through reaction with CO (38%), with contributions from HCHO (16%), alcohols (15%), methane (13%), and aromatics (8%).
10
Table 1 shows the absolute reaction rates of transfer for daylight hours, and that the reverse route of HO2→OH (347×105molecule cm−3s−1on average) is approximately 5 times greater than the flux in the OH→HO2 direction. This reverse flux is dominated by reaction of HO2 with NO (∼99%), which produces around 80% of the OH radicals, slightly more than the 70% observed during BERLIOZ (Mihelcic et al., 2003).
15
On average across the whole campaign, the OH→RO2 flux
(254×105molecule cm−3s−1) is balanced by the RO2→HO2 flux (265×105molecule cm−3s−1). Isoprene, the main biogenic constituent measured during TORCH had an average concentration of 0.1 ppb (with a maximum of 1.3 ppb on 10 August and was responsible for 6% of OH→RO2, with additional contributions
20
from aldehydes (40%), alkenes (15%), ketones (10%), alkanes (9%) and aromatic species (8%).
As the closest example for comparison, the Pollution of the Urban Midlands Atmo-sphere (PUMA) summer campaign (Emmerson et al., 2005a, b; Harrison et al., 2006; Heard et al., 2004) took place in Birmingham city centre during 1999. The
percent-25
age contributions to OH initiation during the PUMA campaign were similar to the find-ings of TORCH in the current work. For example in the summer PUMA campaign,
ACPD
6, 10523–10565, 2006 TORCH 1 modelling team K. M. Emmerson et al. Title Page Abstract Introduction Conclusions References Tables Figures J I J I Back CloseFull Screen / Esc
Printer-friendly Version Interactive Discussion
EGU
46% of OH initiation came from the O3+alkenes reaction, 29% from HONO photol-ysis and 24% from O(1D)+H2O. Photolysis of ozone was not the dominant initiation reaction as for TORCH. Average concentrations of O3 were 26 ppb for PUMA and 47 ppb for TORCH; average j(O(1D)) was 3.6×10⁻⁶s−1for PUMA and 4.7×10⁻⁶s−1for TORCH; and average H2O concentrations were 3.6×10¹⁷molecule cm−3for PUMA and
5
3.7×10¹⁷molecule cm−3 for TORCH. In other campaigns, the reaction of O1D+H2O was a major source of OH during the Nashville Southern Oxidants Study (SOS) in the USA (Martinez et al., 2003), with photolysis of HONO and formaldehyde becoming more important as the UV light diminished at the ends of the day. By contrast, photoly-sis of HONO was the dominant source of OH in New York during the PM2.5Technology
10
Assessment and Characterisation study (PMTACs; Ren et al., 2003).
The reaction rate analyses are summarised in Fig. 8, which shows radical cycling between OH, HO2, RO2 and RO radicals. The values shown are average reaction rates over the whole campaign between 11:00 and 15:00 h. The corresponding PUMA summer campaign reaction rates are shown for comparison. The first thing to note is
15
that the magnitude of the reaction rates in the two campaigns is very similar. TORCH is a sub-urban site 25 miles from London, and has cleaner air, unless air parcels travel directly from the London direction. By contrast, PUMA was designed to measure the polluted urban atmosphere by nature of the site position near Birmingham city centre (Harrison et al., 2006). Average modelled concentrations of OH, HO2and (HO2+ΣRO2)
20
over the same time period for the TORCH (t) and PUMA (p) campaigns were as follows: OHt = 2.8×10⁶, OHp = 2.7×10⁶, HO2t=1.2×10⁸, HO2p = 1.4×10⁸, RO2t = 1.9×10⁸, RO2p= 1.5×10⁸molecule cm−3.
Figure 8 demonstrates that there were greater concentrations of hydrocarbons in the atmosphere during PUMA, shown by the larger reaction rates of OH→RO2 via
25
aldehyde species and through OH reactions with alkenes and ketones, for example.
ACPD
6, 10523–10565, 2006 TORCH 1 modelling team K. M. Emmerson et al. Title Page Abstract Introduction Conclusions References Tables Figures J I J I Back CloseFull Screen / Esc
Printer-friendly Version Interactive Discussion
EGU
4.6 Quantile-Quantile plots
A quantile-quantile (QQ) plot for modelled and measured radical concentrations is shown in Fig. 9. For ease of comparison OH, HO2 and [HO2+ ΣRO2] modelled and measured data have been shown on the same plot, with OH data multiplied by 100 and [HO2+ ΣRO2] divided by 3. Data have been averaged to 15 min, and then ranked
5
in ascending order. This process identifies potential systematic biases in the model or the measurements. If the model and measurements were exactly alike they would fall on the 1:1 line. At low concentrations of OH the model and measurements are similar, but the modelled data become greater than the measurements once concen-trations exceed 6.3×10⁵molecule cm−3. On average, the model over-predicts the OH
10
measurements by 24%. The plot moves closer to the 1:1 line again for concentrations greater than about 4×10⁶molecule cm−3. This observation ties in with the diurnal plot (Fig. 2) which showed that the best model agreement occurred at the ends of the day. The excellent model to measured HO2 agreement is evident in Fig. 9, where ranked 15-min average concentrations of modelled and measured HO2 are very
15
well matched. Modelled HO2 concentrations are greater than measured at around 1.7×10⁸molecule cm−3. On average the model over-predicts the measurements by just 7%. By contrast, [HO2+ ΣRO2] modelled data under-predicts – the measurements from PERCA on average by 22%.
4.7 OH radical chain lengths and local ozone production
20
The radical chain length can be defined as the ratio of the number of radicals prop-agated to the number of radicals formed through initiation. The chain length for OH is shown at the bottom of table 1 between 11:00 and 15:00 h, and corresponds to the HO2→OH route divided by OH initiation. The chain length is therefore a measure of the efficiency of the recycling of the OH radical once formed.
25
For TORCH, the modelled OH chain length varied between 2 (on 27 July, 8 and 9 Au-gust (29 and 30 on AuAu-gust). This is similar to chain lengths between 3 and 8 calculated
ACPD
6, 10523–10565, 2006 TORCH 1 modelling team K. M. Emmerson et al. Title Page Abstract Introduction Conclusions References Tables Figures J I J I Back CloseFull Screen / Esc
Printer-friendly Version Interactive Discussion
EGU
during the SOS campaign downwind of Nashville in the USA (Martinez et al., 2003). On a diurnal timescale, the maximum chainlength coincided with the maximum NOx concentration as noted by Martinez et al. (2003), although in the case of TORCH, the maximum occurred during morning rush hour rather than around midday as observed in Nashville.
5
8 and 9 August fall in the polluted period of the TORCH campaign, yet have very low radical chain lengths. This observation can be explained by investigating the effect of the NO:NO2 ratio on chainlength, as shown in Fig. 10. The lowest values of the chainlength coincide with lower NO:NO2 ratios, air masses which can be thought of as aged. The higher NO:NO2ratios, or air masses which have been subject to recent
10
emissions, have much higher chainlengths. During the heatwave, air was circulating round in stagnant conditions and it is likely that NO would have been converted to NO2 through reaction with O3. This observation agrees with the conclusions of Lee et al. (2006), who used hydrocarbon ratios to show that air reaching the site during the heat wave was highly processed and contained relatively high concentrations of
15
secondary products such as ozone rather than primary emissions.
It is also interesting to calculate the local ozone production rate using the model. A zero-dimensional box model is employed in this work which uses ozone as a model constraint. By summing all of the reaction rates for NO to NO2 conversions in the model, the O3 production rate from local chemistry can be calculated. The local O3
20
production rate is shown in Table 1, and varies between 0.5 ppb hr−1 on 27 July to 17 ppb hr−1 on 3 and 5 August. Dates on which the local O3production rate is higher than the campaign average (7.2 ppb hr−1) are 2–13 August, 17–18 and 24. The ozone concentration is generally higher on these days (>45 ppb) than on the other days of the campaign, suggesting that local production plays an important role on these days.
25
This issue is investigated in more detail by Carslaw et al. (2006).
ACPD
6, 10523–10565, 2006 TORCH 1 modelling team K. M. Emmerson et al. Title Page Abstract Introduction Conclusions References Tables Figures J I J I Back CloseFull Screen / Esc
Printer-friendly Version Interactive Discussion
EGU
5 Conclusions
The TORCH experiment was one of the most highly instrumented field campaigns to date and has resulted in the construction of a highly constrained photochemical box model to predict concentrations of radicals measured during the experiment. In general the model predicted the concentrations of all radicals well, over-predicting OH
5
and HO2concentrations by 24% and 7% respectively, and under-predicting measured [HO2+ ΣRO2] by 22%. Indeed, the degree of model agreement with measured HO2 concentrations is the best reported under such conditions.
OH radical initiation was dominated by the reaction of O1D with water, except during a short period where photolysis of HONO became the major initiation route. The OH
10
chain length varied between 2 and 8, with the smaller chain lengths corresponding to more aged air masses. The largest modelled O3production rate was 17 ppb hr−1on 3 and 5 August.
HO2 production in general is dominated by aldehyde species, in particular HCHO between 11:00 and 15:00 h. However, during the heatwave period, the reaction of
di-15
carbonyl species contributed more than the aldehydes. These results demonstrate the importance of measuring oxygenated species during field campaigns and highlight the need to speciate further species in future campaigns. Termination of HO2is governed by heterogeneous chemistry on the surface of aerosols, and depends on their number concentrations. A major difference between this work and others such as PUMA is
20
that termination of HO2 onto aerosol particles is a major pathway not previously con-sidered in any detail, and could be important for all field campaigns with large sources and/or production rates of aerosol. In addition, there is a need for relevant measure-ments of the HO2accommodation coefficient to confirm aerosol loss of HO2as a major termination route in more polluted areas.
25
RO2radicals are mainly produced via the photolysis of dicarbonyls and the reaction of O3and alkenes. Termination is controlled though PAN formation and peroxy-peroxy reactions.
ACPD
6, 10523–10565, 2006 TORCH 1 modelling team K. M. Emmerson et al. Title Page Abstract Introduction Conclusions References Tables Figures J I J I Back CloseFull Screen / Esc
Printer-friendly Version Interactive Discussion
EGU
The modelled radical initiation and termination budgets balanced very well. The propagation routes between OH→HO2 were governed by CO, HCHO and alcohol species. The reverse flux (HO2→OH) was 5 times greater than OH→HO2, and
domi-nated by the reaction of HO2with NO. The OH→RO2route was dominated by aldehyde and alkene species.
5
The level of agreement between measured and modelled radical concentrations, even at a quite complex site, has given confidence that the model employed in this work has a reasonable representation of the chemistry of the atmosphere. Having confidence in the model enables further elucidation of atmospheric processing through the rate of production analyses employed. Further analysis of the heatwave period of
10
this campaign is discussed in Carslaw et al. (2006).
Acknowledgements. K. M. Emmerson and N. Carslaw would like to thank all of the scientists
involved with the TORCH campaign, especially the groups of H. Coe (University of Manchester), A. Lewis (University of York), and S. Penkett (University of East Anglia), who made some of the measurements used to constrain or compare with the model. Some of the scientists involved
15
in this project would also like to acknowledge the NERC Centre for Atmospheric Science for underpinning support. The Leeds group would like to acknowledge the technical assistance of G. P. Johnson. The TORCH project was funded via NERC grant number NER/T/S/2002/00498.
References
Alicke, B., Geyer, A., Hofzumahaus, A., Holland, F., Konrad, S., P ¨atz, H.W., Sch ¨afer, J., Stutz,
20
J., Volz-Thomas, A., and Platt, U.: OH formation by HONO photolysis during the BERLIOZ experiment, J. Geophys. Res., 108, 8247, doi:10.1029/2001JD000579, 2003.
Atkinson, R.: Atmospheric chemistry of VOCs and NOx, Atmos. Env., 34, 2063–2101, 2000. Bloss, W. J., Gravestock, T. J., Heard, D. E., Ingham, T., Johnson, G. P., and Lee, J. D.:
Appli-cation of a compact all solid-state laser system to the in situ detection of atmospheric OH,
25
HO2, NO and IO by laser-induced fluorescence, J. Env. Monitoring, 5, 21–28, 2003.
Brasseur, G. P., Hauglustaine, D. A., Walters, S., Rasch, P. J., Muller, J.-F., Granier, C., and Tie,
ACPD
6, 10523–10565, 2006 TORCH 1 modelling team K. M. Emmerson et al. Title Page Abstract Introduction Conclusions References Tables Figures J I J I Back CloseFull Screen / Esc
Printer-friendly Version Interactive Discussion
EGU
X. X:. MOZART, a global chemical transport model for ozone and related chemical tracers. 1. Model description, J. Geophys. Res., 103, 28 265–28 289. 1998.
Carslaw, N., Creasey, D. J., Heard, D. E., Lewis, A. C., McQuaid, J. B., Pilling, M. J., Monks, P. S., Bandy, B. J., and Penkett, S. A.: Modelling OH, HO2and RO2 radicals in the marine boundary layer. 1. Model construction and comparison with field measurements, J. Geophys.
5
Res., 104, 30 241–30 255, 1999.
Carslaw, N., Creasey, D. J., Harrison, D., Heard, D. E., Hunter, M. C., Jacobs, P. J., Jenkin, M. E., Lee, J. D., Lewis, A. C., Pilling, M. J., Saunders, S. M., and Seakins, P. W.: Modelling OH and HO2radicals in a forested region of north-western Greece, Atmos. Env., 35, 4725–4737, 2001.
10
Carslaw, N., Carslaw, D. C., Emmerson, K. M., et al.: Chemical diagnostics during an excep-tionally hot pollution episode in 2003 during the TORCH campaign, Atmos. Environ., in press, 2006.
Clemitshaw, K. C., Carpenter, L. J., Penkett, S. A., and Jenkin, M. E.: A calibrated peroxy radical chemical amplifier for ground-based tropospheric measurements, J. Geophys. Res.,
15
102, 25 405–25 416, 1997.
Cleveland, W. S.: Robust Locally Weighted Regression And Smoothing Scatterplots, J. Am. Stat. Assoc., 74(368), 829–836, 1979.
Derwent, R. G.: The influence of human activities on the distribution of hydroxyl radicals in the troposphere, Phil. Trans. R. Soc. London, Series A, 354, 501–531, 1996.
20
Edwards, G .D. and Monks, P. S.: Performance of a single monochromator diode array spec-troradiometer for the determination of actinic flux and atmospheric photolysis frequencies, J. Geophys. Res., 108, 8546, doi:10.1029/2002JD002844, 2003.
Emmerson, K. M., Carslaw, N., Carpenter, L. J., Heard, D. E., Lee, J. D., and Pilling, M. J.: Urban Atmospheric Chemistry during the PUMA Campaign, 1: Comparison of Modelled OH
25
and HO2Concentrations with Measurements, J. Atmos. Chem., 52(2), 143–164, 2005a.
Emmerson, K. M., Carslaw, N., and Pilling, M. J.: Urban Atmospheric Chemistry during the PUMA Campaign. 2: Radical budgets for OH, HO2and RO2, J. Atmos. Chem., 52(2), 165– 183, 2005b.
Fleming, Z., Monks, P. S., Rickard, A. R., Heard, D. E., Bloss, W. J., Still, T., Sommariva, R.,
30
Pilling, M. J., Morgan, R. B., Green, T. J., Brough, N., Penkett, S. A., Lewis, A. C., Lee, J. D., Saiz-Lopez, A., and Plane, J. M. C.: Peroxy radical chemistry at Mace Head, Ireland during the summer of 2002, Atmos. Chem. Phys., 5, 12 313–12 371, 2005.


![Fig. 6. Time series in modelled (pink) and measured (blue) [HO 2 + Σ RO 2 ] concentrations during the TORCH 2003 campaign at Writtle](https://thumb-eu.123doks.com/thumbv2/123doknet/14555480.537439/40.918.62.651.243.361/time-series-modelled-measured-concentrations-torch-campaign-writtle.webp)
![Fig. 7. 15-min average modelled and measured [HO 2 + Σ RO 2 ] concentrations plotted as a diurnal time series](https://thumb-eu.123doks.com/thumbv2/123doknet/14555480.537439/41.918.101.607.96.502/fig-average-modelled-measured-concentrations-plotted-diurnal-series.webp)