HAL Id: hal-03164018
https://hal.sorbonne-universite.fr/hal-03164018
Submitted on 9 Mar 2021
HAL is a multi-disciplinary open access
archive for the deposit and dissemination of
sci-entific research documents, whether they are
pub-lished or not. The documents may come from
teaching and research institutions in France or
abroad, or from public or private research centers.
L’archive ouverte pluridisciplinaire HAL, est
destinée au dépôt et à la diffusion de documents
scientifiques de niveau recherche, publiés ou non,
émanant des établissements d’enseignement et de
recherche français ou étrangers, des laboratoires
publics ou privés.
Machine learning based white matter models with
permeability: An experimental study in cuprizone
treated in-vivo mouse model of axonal demyelination
Ioana Hill, Marco Palombo, Mathieu Santin, Francesca Branzoli,
Anne-Charlotte Philippe, Demian Wassermann, Marie-Stéphane Aigrot,
Bruno Stankoff, Anne Baron-van Evercooren, Mehdi Felfli, et al.
To cite this version:
Ioana Hill, Marco Palombo, Mathieu Santin, Francesca Branzoli, Anne-Charlotte Philippe, et al..
Machine learning based white matter models with permeability: An experimental study in cuprizone
treated in-vivo mouse model of axonal demyelination. NeuroImage, Elsevier, 2021, 224, pp.117425.
�10.1016/j.neuroimage.2020.117425�. �hal-03164018�
demyelination
Ioana
Hill
a,1,
Marco
Palombo
a,1,∗,
Mathieu
Santin
b,c,
Francesca
Branzoli
b,c,
Anne-Charlotte
Philippe
b,
Demian
Wassermann
d,e,
Marie-Stephane
Aigrot
b,
Bruno
Stankoff
b,f,
Anne
Baron-Van
Evercooren
b,
Mehdi
Felfli
b,
Dominique
Langui
b,
Hui
Zhang
a,
Stephane
Lehericy
b,c,
Alexandra
Petiet
b,c,
Daniel
C.
Alexander
a,
Olga
Ciccarelli
g,
Ivana
Drobnjak
aa Centre for Medical Image Computing and Dept of Computer Science, University College London, London, UK
b Institut du Cerveau et de la Moelle épinière, ICM, Sorbonne Université, Inserm 1127, CNRS UMR 7225, F-75013, Paris, France c Institut du Cerveau et de la Moelle épinière, ICM, Centre de NeuroImagerie de Recherche, CENIR, Paris, France
d Université Côte d’Azur, Inria, Sophia-Antipolis, France e Parietal, CEA, Inria, Saclay, Île-de-France
f AP-HP, Hôpital Saint-Antoine, Paris, France
g Dept. of Neuroinflammation, University College London, Queen Square Institute of Neurology, University College London, London, UK
a
b
s
t
r
a
c
t
Theintra-axonalwaterexchangetime(𝜏i),aparameterassociatedwithaxonalpermeability,couldbeanimportantbiomarkerforunderstandingandtreating
demyelinatingpathologiessuchasMultipleSclerosis.Diffusion-WeightedMRI(DW-MRI)issensitivetochangesinpermeability;however,theparameterhasso farremainedelusiveduetothelackofgeneralbiophysicalmodelsthatincorporateit.Machinelearningbasedcomputationalmodelscanpotentiallybeusedto estimatesuchparameters.Recently,forthefirsttime,atheoreticalframeworkusingarandomforest(RF)regressorsuggeststhatthisisapromisingnewapproach forpermeabilityestimation.Inthisstudy,weadoptsuchanapproachandforthefirsttimeexperimentallyinvestigateitfordemyelinatingpathologiesthroughdirect comparisonwithhistology.
WeconstructacomputationalmodelusingMonteCarlosimulationsandanRFregressorinordertolearnamappingbetweenfeaturesderivedfromDW-MRIsignals andgroundtruthmicrostructureparameters.Wetestourmodelinsimulations,andfindstrongcorrelationsbetweenthepredictedandgroundtruthparameters (intra-axonalvolumefractionf:R2=0.99,𝜏
i:R2=0.84,intrinsicdiffusivityd:R2=0.99).Wethenapplythemodelin-vivo,onacontrolledcuprizone(CPZ)mouse
modelofdemyelination,comparingtheresultsfromtwocohortsofmice,CPZ(N=8)andhealthyage-matchedwild-type(WT,N=8).WefindthattheRFmodel estimatessensiblemicrostructureparametersforbothgroups,matchingvaluesfoundinliterature.Furthermore,weperformhistologyforbothgroupsusingelectron microscopy(EM),measuringthethicknessofthemyelinsheathasasurrogateforexchangetime.HistologyresultsshowthatourRFmodelestimatesareverystrongly correlatedwiththeEMmeasurements(𝜌 =0.98forf,𝜌 =0.82for𝜏i).Finally,wefindastatisticallysignificantdecreasein𝜏iinallthreeregionsofthecorpus
callosum(splenium/genu/body)oftheCPZcohort(<𝜏i>=310ms/330ms/350ms)comparedtotheWTgroup(<𝜏i>=370ms/370ms/380ms).Thisisinlinewithour
expectationsthat𝜏iislowerinregionswherethemyelinsheathisdamaged,asaxonalmembranesbecomemorepermeable.Overall,theseresultsdemonstrate,for
thefirsttimeexperimentallyandinvivo,thatacomputationalmodellearnedfromsimulationscanreliablyestimatemicrostructureparameters,includingtheaxonal permeability.
1. Introduction
Theintra-axonalwaterexchangetime(𝜏i),aparameterassociated
withaxonalpermeability,isanimportantmicrostructuralpropertyof thetissue,whichhasbeenlinkedwithmyelinationinthecentral ner-voussystem(Nilssonetal.,2013a).Severalneurologicalconditionssuch as MultipleSclerosis(MS) cause a breakdownof themyelin sheath
∗Correspondingauthor.
E-mailaddress:marco.palombo@ucl.ac.uk(M.Palombo). 1 Theseauthorscontributedequallytothiswork.
throughaprocessknownasdemyelination, whichmaylead toa de-creasein theexchange timeastheintra-axonal watermolecules en-counter lessbarriers. Changesin permeabilityhave alsobeenlinked withpathologiessuchasParkinson’sdisease(Vollesetal.,2001)and cancer Huetal.(2006),leadingtoawidespreadinterestin develop-ingpermeability-basedbiomarkers.Duetoitssensitivitytothemotion ofwatermoleculeswithintissue,modellingofDiffusion-WeightedMRI (DW-MRI)dataenablestheestimationof𝜏i.However,measuringithas
https://doi.org/10.1016/j.neuroimage.2020.117425
Received24July2019;Receivedinrevisedform29September2020;Accepted30September2020 Availableonline6October2020
beenproblematicduetotheintractabilityofthemathematical expres-sionswhichaccuratelyincorporate𝜏iintoanalyticalmodels.
Sofar,thebiophysicalmodelsthatincorporatepermeabilityrelyon assumptionsthatareeithertoosimplistic(Callaghan,1997, Coddand Callaghan,1999, Vangelderenetal.,1994)ordonotholdinhuman tis-sue(Grebenkov etal.,2014, Kärgeretal., 1988).TheKärgermodel (Kärger et al., 1988) is themost widely used analyticalmodel that incorporatespermeability (Nilssonetal., 2010, Stanisz et al., 2005, Lättetal.,2009).However,itsassumptions(i.e.theindividualpools ofwaterarewellmixedandnotrestricted)donotholdinwhite mat-terandthemodelwasshowntofailwhenappliedtohighlypermeable tissue(Fieremansetal.,2010).Ameasurementtechniqueforaccessing exchangeistheapparentexchangerate(AXR)imaging,however,it re-quiresaspecialisedimagingprotocol(Lasič etal.,2011,Nilssonetal., 2013b).
Computational modelsbypass theneed foranalyticalexpressions andincorporatepermeabilitybycreatingamappingbetween simula-tionsoftheDW-MRIsignalandthegroundtruthmicrostructure param-eters. Nilssonetal.(2010)use MonteCarlosimulationswithknown groundtruthparametersincludingpermeabilitytogenerateasynthetic libraryofDW-MRIsignals.Givenapreviouslyunseensignal,they es-timatepermeabilityviaanearest-neighbouralgorithm.However,their approachrequiresnewlibrariestobegeneratedforeachacquisition pro-tocol-whichinsomecasesmayrepresentaproblem-andthe nearest-neighbouralgorithmingeneraldoesnothaveagoodgeneralisation ca-pacity.
Recently,Nedjati etal.(2017) applyforthefirsttimeamachine learningapproachusingarandomforest(RF)trainedonadatabaseof rotationallyinvariantfeaturesderivedfromtheDW-MRIsignals simu-latedusingsyntheticsubstratesofdenselypackedcylinders. Rotation-allyinvariantmetrics(e.g.MDandFAfromDTI)aremetricscalculated fromDW-MRIdatathatdonotdependontheparticularorientationof theunderlyingtissuewithrespecttothescannerreferenceframe,thus providingvaluablemetricsforinter-subjectandacross-platform anal-yses.ThemodelproposedbyNedjatietal.(2017)usesanRFinstead ofstandardmodel-fittingapproachesbasedon minimizationof (non-linear)least-squaresbecauseitismorecomputationallyefficient;itis lessprone tolocalminimumproblems;anditnaturallyencodeseven complex constraintson parametercombinations throughappropriate choiceof trainingdata, whileguaranteeinggood generalisation.The novelRFmodelisshowntooutperformtheKärger’smodelonsynthetic andin-vivohumandatabyprovidingmorereproducibleandrobust es-timatesof𝜏i(Nedjatietal., 2017).However,theirin-vivoapproachis
testedonlyqualitativelyonjusttwoMSpatients.Furthermore,Nedjati etal.(2017)hypothesisethat𝜏iislinkedwithdemyelinationinMS
le-sions,buttheydonotshowwhetherotherunderlyingprocessessuchas axonalswellingororientationdispersionaffecttheestimates.Here,we aimtoaddresstheselimitations.
Theaimofthisstudyistoexperimentallytestamachinelearning basedcomputationalmodelwithpermeabilityusingahighlycontrolled cuprizone-treated,in-vivomousemodelofdemyelination(CPZ),anda directcomparisontohistology.WeadopttheRFframeworkintroduced in Nedjatiet al(2017) toestimatetissue microstructureparameters. Priortoourin-vivoexperiments,weusesimulationsrepresentativefor ourmousedatatoinvestigatethesensitivityofthePGSEprotocolused toacquirethein-vivodatato𝜏i,andselectthemostinformativebshells
(i.e.bvaluesanddirections)withrespecttothisparameter.We addi-tionallyestablishabenchmarkperformanceforourmodelbytesting itsperformanceonsimulations.Totestthein-vivoperformanceofthe model,weusetwocohortsofmice:CPZandhealthyage-matched wild-type(WT),withDW-MRIscansandhistologydata.Ourdemyelination modelallowsustoinvestigatethedirectcorrelationbetweenthe esti-matedexchange timeandhistologicalmeasurementsofmyelin thick-ness.Furthermore,weinvestigatethepotentiallyconfoundingeffectsof dispersionandaxonalswellingtoeliminateanypotentialbiasinour
estimatesoftheexchangetime.Finally,weanalysethecorrelations be-tweentheestimationsofourmodelandhistologydata.
2. Methods
This sectionfirst describesthe imagingprotocol,in-vivo data ac-quisition,histologyanalysisandthemachinelearningmodelandthen outlinestheprincipalstepsofourexperimentalframework.Firstly,we investigateusingsyntheticdatathesensitivityofourimagingprotocolto changesin𝜏i.Secondly,weoptimiseourcomputationalmodelthrough
ashellselectionprocessandestablishabenchmarkperformanceforour modelinsimulations.Wefirstensurethereisagoodmatchbetweenthe syntheticandin-vivodataandweinvestigateanybiasinourmachine learningpredictionsof𝜏ibylookingattheeffectofpotential
confound-ingfactors. Finally,wetest thein-vivoperformanceof ourmachine learningmodelonacuprizonemousemodelofdemyelinationandwe analysethecorrelationsbetweenthepredictionsandtheex-vivo histo-logicalmeasurementsavailable.
2.1. Mousedata
2.1.1. In-vivodataacquisition
Weimagetwocohortsof8-weekoldC57BL/6Jfemalemice,CPZ (N=8)andWT(N=8),usingthesamescannerandacquisition proto-colaspresentedbelow. Allanimalexperiments areperformedin ac-cordance with the European Council Directive (88/609/EEC). Eight mice werefed0.2% cuprizonefor 6weeks,which corresponds toa demyelinationwithoutrecoveryphase,andeighthealthyage-matched wild-type(WT)miceofthesamebackgroundwerefedanormalchow diet andusedascontrols.AllmicearescannedonaBrukerBioSpec 11.7TscannerusingtheprotocoldescribedinSection2.1.2below.The WT data used in this study areavailable in the publicdomain and can be foundat https://zenodo.org/record/996889#.WgH5E9vMx24 (Wassermannetal.,2017).Theauthorsdonothavepermissiontoshare thedatausedinthisstudyfortheCPZtreatedmice.Allthecodeused fortheanalysisisavailableuponrequesttothecorrespondingauthors. Wepost-processtheimagesbycorrectingforeddycurrentsusing FSL-eddy(Smithetal., 2004).Nomotionartefactsareobserved.We restrict our analysisto whitematter voxelswithin the corpus callo-sum(CC).ToselecttheCCvoxels,wecomputemapsoflinearity(CL),
planarity(CP)andsphericity(CS)(Westinetal.,2002)fromthe diffu-siontensor(DT)fittotheshellatb=1241s/mm2.WecreatetheCC
mapsbyselectingthevoxelswithCL>0.3,CP<0.4,CS<0.5andfractional
anisotropy(FA)>0.40(valuechosentodistinguishWMformGMand CSFvoxelsalsointhecuprizonetreatedmice,whereFAvaluescanbe lowerthantheWTones).Followingthisprocedure,weobtainmasks ofthecorpuscallosumwhosethicknessvariesslightlyacrossallmice, randomlyandwithnostatisticallysignificantdifferences.Specifically, themean±s.d.of thenumberofvoxelscomprisingtheCCmaskin theWTgroupis161±13andintheCPZgroupis175±18.Followinga two-tailt-testwefindthisdifferencestatisticallyinsignificant(p>0.05). Previousstudies,suchas Wuetal.(2008),showedstatistically signif-icantincreaseinthevolumeofCCofCPZintoxicatedmicecompared toWT.However,wedonotmeasureastatisticallysignificantincrease andthefurtherinvestigationofthisobservationisoutofthescopeof thepresentstudy.
2.1.2. Diffusionimagingprotocol
WeusethesameDW-PGSEprotocolforsyntheticandin-vivodata, optimised tomaximisesignal reconstructionaccuracyunderrealistic timeconstraints(Filipiaketal.,2019).Our imagingprotocolhas25 shells,each withoneb=0measurementandadifferent combination ofdiffusiongradientstrengthGanddiffusiongradientseparationΔas summarisedinTable 1 .Theresultingprotocolhas345measurementsin total,diffusiongradientduration𝛿=5ms,|Gmax|=500mTm−1andshell
Fig.1. Schematicpipelineofthestereologicalanalysistocomputegratiosandaxonaldiametersinthecorpuscallosumofthemice.First,Tenequallyspacedslices arecutwithinthe1millimeterfromthemiddleofthecorpuscallosuminthesagittalsectiontowardstheedgeofthebrain(A).Then4slicesaresampledstarting fromarandomnumber.Inthiscase,therandomlychosenstartingnumberis1,andtheselectedslicesare#1,#4,#7and#10(B).Subsequently,theseslicesare usedtolocalisetheareasofinterest(e.g.,genu,bodyorspleniumasshowninC),andeachoneofthoseisslicedultra-thinly.Onarandomlychosenultra-thinslice foreachoftheROIs,30spotsarealsorandomlychosenovertheentireROIatsmallermagnificationtoassurethatimagesarenotintersected(Dshowsjust6ofthose)before acquiringthefinalEMimageat62Kmagnification.Eachofthe30randomspotsareselectedforstereologicalanalysisusingpointgridsof36regularlyspacedcrosses,each onerepresentinganareaof0.5𝜇m2(Eshowstwoofthose30spots,oneforWTandoneforCPZ).ThesepointgridsareusedforquantificationoftheWTandCPZmice.
Table1
DW-PGSEparameters withthe corresponding nominal b-values in s/mm2. 𝚫 (ms) 10.8 13.1 15.4 17.7 20 #grad dirs G (mT/m) 150 358 445 533 620 707 16 200 620 775 930 1086 1241 16 300 1384 1733 2083 2432 2781 8 400 2489 3110 3731 4352 4973 11 500 3892 4862 5833 6803 7773 13
b-valuesasshowninTable 1 .Additionalprotocoldetailsareasfollows: TE=33.6ms,TR=2s,FOV=16×16mm,matrixsize=160×160, num-berofslices=5,slicethickness=0.5mm.Totalacquisitiontime53min. 2.1.3. Histologysamples
TheWT(n=8)andCPZ(n=8)animalsaresacrificedbydeep anaes-thesiaandperfusedintracardiallywith1%paraformaldehydeand2.5% glutaraldehydeinphosphatebuffer0.12M,pH7.4attheendofthe 6-weekCPZtreatment.Theextractedbrainsarethenpost-fixedovernight at4°Cinthesamefixativeandrinsedinphosphatebuffer.Ten 100μm-thicksagittalsectionsarecutwithavibratome(ThermoScientific Mi-cromHM650VVibrationmicrotome)(Fig. 1 A).Theveryfirstsection closesttothebrainmidlineisconsideredas#1andsections#1,#4, #7,and#10 areselected (Fig. 1 B).Sections arepost-fixed with1% osmiumtetroxideinwaterfor1hatroomtemperature(RT°),rinsed
3×5minwithwaterandcontrasted“enbloc” for1hatRT° with2% aqueousuranylacetate.Afterrinsing,sectionsareprogressively dehy-dratedwith50%,70%,90%,and100%ethanolsolutionsfor2×5min each.Finaldehydration isachievedby immersingthesectionstwice in 100%acetonefor10min.Embeddingis performedinepoxy resin (Embed812,EMS,Euromedex,France)overnightin50%resin/50% acetoneat4°Cfollowedby2×2hinpureresinatRT°,and polymer-izationisachievedat56°Cfor48hinadryoven.Semi-thinsections (0.5𝜇m-thick)arecollectedwithanultramicrotomeUC7(Leica,Leica MicrosystèmesSAS,France)andstainedwith1%toluidinebluein1% boraxbuffer(Fig. 1 D).Ultra-thinsections(70nm-thick)arecontrasted withReynold’slead citrate(ReynoldES,1963),andobservedwitha transmissionelectronmicroscope(HITACHI120kVHT7700), operat-ingat70kV.Images(2048×2048pixels)areacquiredwithanAMT41B camera(pixelsize:7.4μmx7.4μm)(Fig. 1 E).
2.1.4. Post-mortemanalysis
Fromtheelectronmicroscopy(EM)samplesobtainedasoutlinedin
Section 2.1.3 ,weestimatethemeanandstandarddeviationofthegratio,
myelinthickness,axonaldiameterandtheintra-axonalvolumefraction oftheWTandCPZmice.Thestereologicalanalysisisperformedin iso-latedregionsoftheCC(genu,bodyandsplenium),where4random sec-tionswithuniformdistancearequantifiedperanimal(Fig. 1 B),with30 randomlylocatedimagesperregionandperanimalacquiredat62,000 magnification. Forvolumefraction(VF)weproceedaccordingtothe Delesseprinciple Mouton(2002):volumefractionsarecalculatedby
di-vidingthetotal numberofpoints hittingthestructure(P(Y)) bythe totalnumberofpointshittingthereferencevolume(P(ref)),following theequation:𝑉𝐹(𝑌,𝑟𝑒𝑓)= ∑𝑚 𝑖=1𝑃(𝑌)𝑖 ∑𝑚 𝑖=1𝑃(𝑟𝑒𝑓)𝑖 .
Agridof36regularlyspacedcrosses(Fig. 1 E)isgeneratedwithFiji, anopen-sourceplatformforbiologicalimageanalysis(Schindelinetal., 2012).Toidentifynon-perpendicularaxonsandremovethemfromthe analysis,wetakeintoaccounttheshapeoftheaxonsandthe micro-tubulesinsidethem.Perpendicularaxonshaveaminimallyelongated shapeandtheirmicrotubulesaresmallperfectlycircularstructures in-sidethem.Incontrast,non-perpendicular axonshavemoreelongated shapes(e.g.moreellipsoid-like)andtheirmicrotubulesappearlikelines, dependingontheangleofthesection.Stereologicalanalysisprovides MyelinVolumeFractions(MVF),Axon VolumeFractions(AVF),and thetotalAxon VolumeFractions(tAVF),whichincludesboth myeli-natedandunmyelinatedaxons.TotalAxonCount(tAxCount)is man-uallyquantified. Thegratio of myelinatedfibers isthencalculatedas
gratio=√ 𝐴𝑉𝐹
(𝑀𝑉𝐹 +𝐴𝑉𝐹) andthemeanaxondiameters(DAX)are
calcu-latedasDAX=2 × √
(𝑡𝐴𝑉𝐹 ×𝑠𝑢𝑟𝑓𝑎𝑐𝑒) (𝜋×𝑡𝐴𝑥𝐶𝑜𝑢𝑛𝑡) .
Theoutliersinducedbythenon-perpendicularaxonsintheimages arenottakenintoconsideration.FromthegratioandtheDAX,myelin
thicknessiscomputedas:myelinthickness= 𝐷𝐴𝑋
2𝑔𝑟𝑎𝑡𝑖𝑜(1−𝑔𝑟𝑎𝑡𝑖𝑜).
WecomparetheestimatesoftheRFwiththeEMmeasurementsby computingthegroup-wisemeanintheCCROIsofthemyelinthickness andintra-axonalvolumefraction(VF) andlookingatthecorrelation betweentheseandtheRFestimationsfor𝜏iandf.
2.2. Syntheticdata
Amachinelearningregressorcanbetrainedondifferentdatabases. Inthiswork,weaimtocomparetheperformanceoftrainingdirectly onsimulatedsignalsversustrainingonfeaturesobtainedbymodelling thosesignals.Therefore,weconstructtwotrainingdatabases:one com-prisedofsyntheticDW-MRIsignalsandtheotherofrotationally invari-antfeaturesestimatedfromthosesignals.
Eachentryin thedatabasecorresponds toaunique digital phan-tomwhichmimicsthein-vivodataandforwhichthegroundtruth mi-crostructureparametersareknown.Eachsyntheticdatabaseisusedto traina machinelearningalgorithm,here anRF,tobuilda mapping betweenthesignalorfeaturesandthecorrespondinggroundtruth mi-crostructureparameters.Pleasenotethatinthiscontextwereferto “fea-tures” inamachinelearningsense:measurablepropertiesor character-isticsoftheDW-MRIsignal,andsomeofthefeaturesusedmaydepend onsomeoftheothers.
2.2.1. Syntheticsignalsdatabase
WeuseMonteCarlosimulationsoftheDW-MRIsignaltobuildour synthetictrainingdatabase.Thesignalsaregeneratedusingtheopen source Camino(Cooket al., 2006; http://camino.cs.ucl.ac.uk) simu-lationframework HallandAlexander(2009)togetherwiththe imag-ingprotocolinTable 1 .UsingtheCaminotoolbox,wegenerated syn-theticsignalsbyfirstsimulatingthediffusionofmanyspinsas three-dimensionalrandomwalkusingMonteCarlomethodsforeachsynthetic substratecomposedofrandomlypackedstraightcylinders.Then,from thesimulatedspinstrajectories,thediffusion-weightedsignalwas com-putedusingthephaseaccumulationapproach,accordingtothespecific diffusion-sensitisinggradientschemechosentomatchtheexperimental acquisitionprotocol.Thus,eachsimulatedsignalcorrespondstoa digi-talphantomwhichmimicsthein-vivomousebraindataintroducedin
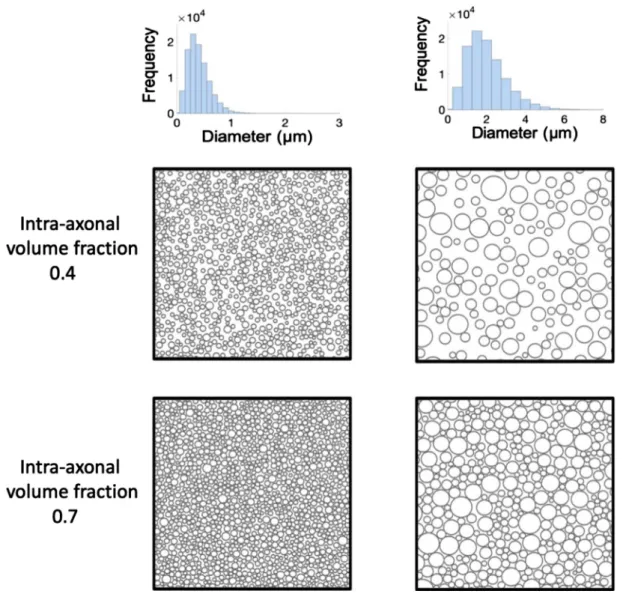
Section 2.3 .Thedigitalphantomsarerepresentedbysyntheticsubstrates thatmodelwhitematterasacollectionof100,000non-abutting,parallel cylinderswithgamma-distributedradii,acommonchoiceinthebrain literature(Aboitizetal.,1992).Thecylindersarerandomlypackedin thesubstratesasdescribedinHallandAlexander(2009),withexample substratesshowninFig. 2 .Weconstructadatabaseof11,000unique
tissuesubstratesandtheircorrespondingDW-MRIsignalsbyrandomly samplingfromarangeofhistologicallyplausiblesubstrateparameters forwhitemattertissue(Aboitizetal.,1992, Barazanyetal.,2009).A whitemattersyntheticsubstrateisdefinedthroughfiveparameters:the mean𝜇R∈[0.2,1]𝜇mandthestandarddeviation𝜎R∈[min(0.1,𝜇R/5), 𝜇R/2]𝜇moftheaxonradiidistribution,theintra-axonalvolume
frac-tionf∈[0.4,0.7],theintra-axonalexchangetime𝜏i∈[2,1000]msand
theintrinsicdiffusivityd∈[0.8,2.2]𝜇m2ms−1.Toensurethe
conver-genceandthehighprecisionofthesimulatedsignals,wegenerateour syntheticdatabaseusing100,000spinsand2,000timesteps(Halland Alexander,2009).TheMonteCarlosimulationsusedisplacements in continuousspace, withfixedstep sizein threedimensions𝑠=√6𝑑𝛿𝑡 Einstein(1905),with𝛿t=10𝜇s.Thepermeabilityofasubstrateis spec-ifiedwithintheCaminosimulationframeworkviatheprobability pa-rameter p.Thisparameter expressestheprobabilitythataspinsteps throughamembraneencounteredduringtherandomwalk(insteadof alwaysbeingreflectedbackwardsasitisthecaseforimpermeable sub-strates).Theprobabilitypisrelatedtothepermeabilitykthroughthe expression: 𝑝=2 3𝑘 √ 6𝛿𝑡 𝑑,
wheredistheintrinsicdiffusivityand𝛿tisthetemporalresolution.This expressionisobtainedbycombiningtheMonteCarlosteplength equa-tion𝑠=√6𝑑𝛿𝑡(HallandAlexander,2009)withthetransition proba-bilityequationasderivedin(ReganandKuchel,2000, Fieremansand Lee,2018).Here,wemeasurepermeabilitykviatheintra-axonalwater exchangetime𝜏i,whichisinverselyrelatedtokthroughtheexpression 𝑘= 𝑅
2𝜏𝑖 ,whereRistheaxonradius(Fieremansetal.,2010).
Tomaximisetheperformanceofourmachinelearningregressor,we aimtobuildatrainingdatabasethatresemblesascloselyaspossible thein-vivodata.Forthis,wegenerateanadditionalsetofsynthetic sig-nalstoaccountforthenoisepresentinthein-vivodata.WeaddRician noisewithastandarddeviation𝜎 correspondingtoanSNRof40,which reflectsthenoiseleveloftheb=0imageswiththelongest𝚫.
2.2.2. Syntheticfeaturesdatabase
Inordertomakethemethodgeneralizableacrossdifferentscansand scanners,wetraintheRFregressorusingaconvenientdatabaseof fea-turesextractedfromtheDW-MRIsignalsthatareindependentof the specificorientationofthebrainwithinthescanner(i.e.rotationally in-variantfeatures)(Novikovetal.,2018, Reisertetal.,2017).Towards thisgoal,weobtainanequivalentrotationallyinvariantdatabaseby com-putingforeachofthesyntheticsignalsgeneratedinSection 2.2.1 asetof 15rotationallyinvariantfeatures(seeTableA.1),asdoneinNedjatietal. (2017).WecomputetheDTandthe4thordersphericalharmonic(SH)
fitforeachbshellfromthesyntheticsignalsusingtheCaminotoolkit (Cooketal.,2006).Wethenderive15rotationallyinvariantfeatures foreachbshellandbuildanequivalentrotationallyinvariantsynthetic database.Thefirstfivesignal-derivedfeaturesarecalculatedfromthe DTfitandarethethreeeigenvalues𝜆1,𝜆2,𝜆3,themeandiffusivity(MD) andthefractionalanisotropy(FA).Theremainingtenfeaturesare de-rivedfromtheSHfit:themean,peak,anisotropy,skewnessandkurtosis oftheapparentdiffusioncoefficienttogetherwiththepeakdispersion (i.e.thestandarddeviationofthepeaksoftheSHfunctionsoverasetof evenlydistributedpointsinspace)andcombinationsofthefirst,second andfourthorderSH(Nedjatietal.,2017).SectionA.1intheAppendix presentsinmoredetailwhateachofthe15featuresrepresentsandhow itiscomputed.
2.3. Machinelearning 2.3.1. Randomforest(RF)
Due to theirinterpretability, robustnessto noiseand easiness of tuning (Criminisi etal., 2011),RFsarewidely usedasregressionor classificationtechniquesin themedicalfield(Alexanderetal.,2017,
Fig.2. ExamplesofthesynthetictissueusedforourMonteCarlosimulations.FromtwogivenexemplarGammadistributionsofaxondiameter(firstrow)four exemplardigitalsubstratesaregeneratedbypackingstraightnon-overlappingcylindersuptotwodifferentintra-axonalvolumefractions:0.4(secondrow)and0.7 (thirdrow).
Geremiaetal.,2011, Nedjati-Gilanietal.,2017).AnRFisanensemble technique,builtofacollectionofdecisiontrees,calledweaklearners.An RFregressormakesestimatesbyaveragingtheanswersofallitsdecision trees,whichareindividuallytrainedthroughatechniquecalledbagging. Thistechniqueensuresthediversityofthetreesbytrainingeachtreeon adifferentrandomtrainingsubset.Therandomnessanddiversityofthe treesensuretheirrobustnesstonoiseandgoodgeneralisation, result-ingintheRFactingasastronglearner Breiman(2001).Here,webuild anRFregressorthatlearnsamappingbetweenthesynthetictraining databaseofDW-MRIsignals/featuresandthegroundtruth microstruc-tureparametersofthecorrespondingsubstrates.Themappingislearnt throughagreedysplittingprocessoftheinputspace(thesynthetic sig-nals/features)guidedbytheassociatedtissueparametersprovidedas labelsduringtraining.
Duringthelearningphase,thetrainingdataispassedthroughthe de-cisiontree,startingattherootnodetowardstheterminalnodes.Ateach node,thedecisiontreesearchesforapartitionoftheincomingdatasuch thathavingseparatepartitionsoneithersideofthenodeimprovesthe estimation.Ifsuchapartitionexists,thenodeissplitandtwochildnodes areaddedonthelevelbelow.Thisprocedureisrepeatedforeverychild nodeuntilsplittingthedataintosmallerpartitionsdoesnotimprovethe estimationanymore.Ifnobetterpartitionisfound,thenodebecomes aterminalnode.Mathematically,thetrainingprocessisguidedbythe
optimisationofacostfunction,whichisusedtodeterminethebestsplit ateachnode.Theoptimisationsearchesforthefeature-thresholdpairs (fi,tfi)thatproducethebestsplit.Here,weusetheClassificationand
RegressionTree(CART)algorithmcostfunctionJ,definedas: 𝐽(𝑓𝑖,𝑡𝑓𝑖)=
𝑚𝑙𝑒𝑓𝑡
𝑚 𝑀𝑆𝐸𝑙𝑒𝑓𝑡+ 𝑚𝑟𝑖𝑔ℎ𝑡
𝑚 𝑀𝑆𝐸𝑟𝑖𝑔ℎ𝑡,
wheremleft/rightisthenumberoftraininginstancesintheleft/right sub-setand‘MSE’standsforthe’mean-squared-error’betweenthe ground-truthmicrostructureparameters(i.e.d,fand𝜏i)knownbydesignand
thepredictedones.
There aretwoimportantparametersthatneedtobeoptimisedto improvethelearningperformanceofanRF:thenumberoftreesandthe maximumtreedepth.Thenumberoftreesdeterminesthesmoothness of thedecisionboundary,andthetree depthparameterspecifiesthe maximumlevelsthateachdecisiontreecanhave.Toolargeavaluecan leadtooverfittingwhiletoolowavalueleadstounderfitting,depending onthecomplexityofthedata.Here,werunpreliminaryexperiments andoptimisethesetwoparametersforourtaskin ordertomaximise theperformanceofourmodel.
2.3.2. Trainingandtesting
WeimplementanRF regressorusingthescikit-learnopensource Pythontoolkit(Pedregosaetal.,2011).Followingpreliminary
experi-ments,webuildanRFwith200treesofmaximumdepth20andbagging, asthesettingthatmaximisestheperformanceofthemodel.More gen-eralimplementationdetailscanbefoundathttp://scikit-learn.org/.We traintheRFforamulti-parameterregressiontask:weestimatethe intra-axonalexchangetime𝜏itogetherwiththeintra-axonalvolumefraction fandtheintrinsicdiffusivityd.UnliketheapproachinNedjatietal. (2017),wedonotfittheaxonradiusindex(Alexanderetal.,2010)due tothelackofsensitivityofthesignaltothisparameterforourimaging protocol(Burcawetal.,2015,Drobnjaketal.,2016).
Thedimensionalityofoursyntheticdatabasesis11,000by345for thesignaldatabaseand11,000by375forthefeaturedatabase.Weset thesizeoftrainingsetto11,000aswedidnotfindanyimprovementsin performanceabovethisnumber.Thelengthofeachsynthetictraining sampleisreducedfurtherduringtrainingaccordingtothenumberof bshellsselectedineachtrainingscenario.WetrainandtesttheRFon thesyntheticdatabasesusingtheassociatedgroundtruthparametersas labelsforthesupervisedregressiontask.Whenpredictingtheparameter mapsforthein-vivodata,wetraintheRFusingthenoisydatabasesas theyareamoreaccuraterepresentationofthein-vivodata.Wesplit oursyntheticdatabaseintoatrainingsetof9,500randomlyselected signal/featurevectorsandatestsetformedoftheremainingpreviously unseen1,500signal/featurevectors.AsshowninNedjatietal.(2017), theRFis notbiasedbytherandomselectionofthetrainingdataas longasthereissufficientcoverageoftheparameterrange,whichwe alsoensure.Tobuildthetrainingset(tobe doneonlyonce) ittook approximately3days,using50nodesonourhigh-computingcluster ofCPUs.Thetrainingofthemachinelearningmodel(tobedoneonly once)took~1minandthepredictionofthemodelparametersfor~104
exemplarvoxelstook~1min,ona1.6GHzdual-coreIntelCorei5.Note thatthese times arejust indicative,andtheydependonthespecific hardwareused.
Inthisworkweexploretwopossiblewaysofusingmachine learn-ingformicrostructureestimation:usinga)signalsorb)featuresofthe signaltocreatethetrainingdatabase.The“signalstrainingdatabase” consistsofstandardDW-MRIsignalintensities(normalizedbytheb=0) forarangeofbvaluesandgradientdirections.The“Featurestraining database” iscreatedbyreplacingeachsignalatagivenbvalueinthe “signaltrainingdatabase” with15features,e.g.DTIandSHmetrics, cal-culatedusingallthegradientdirectionsforthatvoxelatthatbvalue, asdescribedinSection 2.2.2 .Whilethefirstapproachbuildsadirect mappingbetweentherawsignalsandthegroundtruthmicrostructure parameters,thesecondapproachintroducesanadditionalstepofmodel fittingandconstructsamappingbetweenDTandSHfeaturesoftheraw signalsandthemicrostructureparametersofinterest.Becausewechose touserotationallyinvariantfeatures,thesecondapproachis generaliz-ableacrossdifferentscansandscanners.
2.4. Experiments 2.4.1. Sensitivityanalysis
Firstly,weassessherethatintheanalyseddatathereissufficient in-formationaboutthetargetedmicrostructuralparameters,inparticular 𝜏i.Toensurethatthereisenoughinformationinthedata,we
investi-gatethesensitivityofourPGSEprotocoltotheintra-axonalexchange timebylookingattherangeof𝜏i valuesforwhich theDW-MRI
sig-nalcan be distinguishedfrom thatof animpermeablesubstrate.For this,weconsidertwosyntheticsubstratesrepresentativeofmousewhite mattertissue,withthefollowingproperties:themeanaxonaldiameter 𝜇D=0.4𝜇mand𝜇D=2𝜇m,mimickingsmallandlargeaxonsintheCC,
theintra-axonalvolumefractionf=0.7(Barazanyetal.,2009),andthe intrinsicdiffusivity=1.2𝜇m2ms−1(Wuetal.,2008).Thesesubstrates
areagoodrepresentationofourin-vivomicedata,asshownbythe his-tologicalmeasurementsof𝜇DinSection 3.5 ,allwithintherangeofthe
gamma-distributionsabove.Notethatthechoiceoffixingthediffusivity to1.2𝜇m2/msisonlymadeforthepurposeofthesensitivityanalysisto
assessthesuitabilityoftheprotocol.Foralltheothersimulationsinthe
machinelearninganalysis,thediffusivityisvariedintheinterval[0.8, 2.2]𝜇m2/ms,asdoneinNedjatietal.,2017,andasshowninWuetal.,
2008and Barazanyetal.,2009appropriateforrodents’brain.For ap-plicationonhumanbrain,higherdiffusivityof~2.2𝜇m2/msshouldbe
usedforthesensitivityanalysis,accordingtorecentestimatesof intra-axonalaxialdiffusivityin-vivointhehumanbrain(Dhitaletal.2019). UsingtheCaminotoolbox,wegeneratesyntheticsignalsforeach substrateanddifferentvaluesof𝛿,ΔandG,correspondingtothebshells inourPGSEprotocol.Thediffusiongradientsaresetperpendicularto thecylindersinthesubstratetomaximisesensitivityto𝜏i.We
inves-tigatewhetherexchangetimeeffectscanbedetectedinthesignalby lookingatthedifferenceinthenormalisedDW-MRIsignalbetween im-permeable(𝜏i=∞)andpermeablesubstrates.Moreover,weanalysethe
effectofnoisebylookingatarangeofdifferentSNRs:SNR=∞,SNR=40 andSNR=20,whereSNR=40correspondstothelevelofnoisepresent inourin-vivodata.Byusingsyntheticsubstratesrepresentativeofour in-vivodataandthesameimagingprotocol,weexpecttheanalysisin thissectiontoprovideanindicativerangeofexchangetimevaluesfor whichthereisreasonablesensitivityinourin-vivodata.
2.4.2. Shellselection
Asourimagingprotocolusesanexplorativerangeofimaging pa-rameters,weselectthebshellsthatmaximisetheperformanceofour RFmodelwithrespectto𝜏i.Forthis,weevaluatetheperformanceof
ourRFmodelforeverypossiblecombinationof4,9and16shellsoutof the25inourprotocol.Wefirstevaluatecombinationsof4shellsusing asabenchmarkthe4-shellSTEAMprotocol(Nedjatietal., 2017) opti-mised Alexander(2008)foratwo-compartmentmodelwithexchange andbiophysicallyplausibletissueparameters.Asthereare12650 pos-sible combinationsof4shells,wetraintheRF12650times,onceon eachdifferentshellcombination.Then,foreachtrainingscenario corre-spondingtoauniquecombinationofshells,wecomputethecorrelation coefficientR2forf,𝜏
ianddbetweenthegroundtruthandtheestimated
valuesinthetestset.Finally,wesortthedifferentshellcombinations accordingtotheirR2scorefor𝜏
iandchoosethecombinationwiththe
highestscoreastheonethatmaximisestheperformanceofthemodel. Furthermore,weinvestigatetheeffectofincreasingthenumberof shellsusedfortraining.Forthis,wealsolookatcombinationsof9shells, astheminimumnumberofshellsrequiredtosampleindependently ev-eryuniqueGand𝚫 valueinourPGSEprotocol.Additionally,welook atcombinationsof16shellsasamiddlevaluebetweenthe9-shelland thefullprotocolscenario.Forthisanalysis,weusethesynthetic feature-baseddatasetdescribedinSection 2.2.2 .Finally,weinvestigatetheeffect ofnoiseontheperformanceofourmodel.Forthis,welookatarange ofdifferentSNRs:SNR=∞,SNR=40andSNR=20.
2.4.3. Syntheticexperiments
ToassessthequalityoftheRFestimatesaftertrainingiscompleted, wecomputethePearsoncorrelationcoefficientR2betweentheground
truthvaluesandtheRFestimatesoftheparametersinthepreviously unseentestset.Toevaluateanypotentialbiasintheestimates,weuse Bland-Altmanplotsshowingthemeanoftheestimatedandgroundtruth valuesagainsttheirdifference.Wefirstanalysetheperformanceofthe modelonthenoise-freesyntheticdatabasestoestablishabenchmark givenourdataandimagingprotocol.Next,weapplyourmachine learn-ingmodeltotheSNR=40databaseforamoreaccurateapproximation of theperformanceweexpect,giventhenoisepresentin ourin-vivo data.Foreachexperiment,weanalysebothtrainingscenariosoutlined inSection 2.4.2 (signal-basedandfeature-based)totestwhetherthere areanydifferencesinperformancebetweenthetwoapproaches. 2.4.4. In-vivoimagingexperiments
Beforegeneratingin-vivoparametermapsusingourtrainedmachine learningmodel,wefirstperformadataqualitymatchtocheckthatthe datasetusedtotrainourmachinelearningmodelrepresentswellthe characteristicsofthein-vivodataset..Inadditiontothis,weinvestigate
Fig.3.DifferencesintheDW-MRnormalizedsignalbetweenimpermeable(𝜏i=∞)andtheequivalentpermeable(𝜏i∈[20,1000]ms)substratesatdifferentbvalues, fordifferentmeanaxonaldiameterandSNRsandintra-axonalvolumefractionf=0.7.A)resultsforasubstratewithmeanaxonaldiameter𝜇D=2𝜇m,representing largeaxonsinthemousebrain.B)resultsforasubstratewith𝜇D=0.4𝜇m,mimickingsmallaxonsinthebrain.Thelevelofsignaldetectabilityisdisplayedforthree SNRlevels(∞,40and20),representedbytheblackplanes,belowwhichanychangeinsignalisundetectable.
anypotentialbiasinourin-vivoestimatesof𝜏iduetochangesinthe
orientationdispersionbycomputingmapsoftheNODDIorientation dis-persionindex(ODI)(Zhangetal.,2012a)usingtheNODDIMatlab(The MathWorks,Inc,Natick,MA)Toolbox1.UsingtheCaminotoolbox,we additionallygenerateDTI mapsatb=1241s/mm2 ofaxialdiffusivity
(AD),fractionalanisotropy(FA)andradialdiffusivity(RD)asmeasures oftissuepropertiesthatcanbecomparedwithalreadypublishedworks incuprizonemodel(Boretiusetal.,2012,Songetal.,2005,Zhangetal., 2012b).
UsingtheRFtrainedonthenoisydatabase,wegenerateparameter mapsfortheCCsofthe16miceforthreeparametersofinterest:𝜏i,f
andd.Toinvestigatethedifferencebetweenthetwogroups(CPZand WT),wecomputebox-and-whiskerplotsofregion-specificcomparisons betweenWT(8mice)andCPZ(8mice)fortheDTIandNODDImetrics aswellasfortheRFestimates.Statisticalsignificanceisassessedbya two-tailedt-test,consideringp-values<0.05.Weruntheseexperiments usingthesignalsdatabase.TheCaminofeatureextractionofthein-vivo datadidnotproducehistologicallyplausibleresultsfortheshellswith veryhighgradientstrengths(G>300mT/m)inourprotocol,andwe thereforeexcludethistrainingapproachfromtheanalysisinthis sec-tion.Wediscussthepotentialexplanationsandtheimplicationsofthis inSection 4.1 .
3. Results
3.1. Sensitivityanalysis
Fig. 3 showstherangeofexchangetimevaluesforwhichtheDW-MRI signalS(𝜏i)canbedistinguishedfromthatofanimpermeablesubstrate
S(𝜏i=∞)inthepresenceofnoise.Forthis,wecalculatethechangein
sig-nal|S(𝜏i=∞)-S(𝜏i)|betweenanimpermeableandanequivalent
perme-ablesubstrate.Toillustratepracticallyachievablesensitivities,weplot thisdifferenceagainstthreenoiselevels,denotedbytheblackplane: SNR=∞(1stcolumn),SNR=40(2ndcolumn)andSNR=20(3rdcolumn).
Fig. 3 Aillustratestheresultsforasubstratemimickinglargeaxonsin thewhitematter(𝜇D=2𝜇m),whileFig. 3 Bcorrespondstoasubstrate
withsmalleraxons(𝜇D=0.4𝜇m).Thesecondcolumn showsthat,for
substrateswithlargeaxons(rowA)andanSNRof40,matchingthatof ourin-vivodata,itispossibletodistinguishexchangetimeeffectsfor valuesof𝜏i≤400ms.Forsubstrateswithsmallaxons(rowB),wecan
distinguishonlypermeablesubstrateswithexchangetimesupto𝜏i≤
250ms.Asexpected,whentheSNRdropsto20,itbecomesharderto distinguishbetweenimpermeableandpermeablesubstrates.Thistrend
1 http://mig.cs.ucl.ac.uk/index.php?n=Tutorial.NODDImatlab.
canbeobservedinthe3rdcolumn,wheretherangefordistinguishable
permeablesubstratesnarrowsfrom𝜏iϵ[0,400]msto𝜏iϵ[0,200]ms
forlargeaxonsandfrom𝜏iϵ[0,250]msto𝜏iϵ[0,140]msforsmall
axons.
3.2. Shellselection
Asouroriginal25-shellPGSEprotocolusesanexplorativerangeof imagingparameters,wechoosetheshellsmostsensitivetotheexchange time(seeSection2.5.2forfurtherdetails).InFig. 4 ,eachpointonthe x-axisrepresentsoneuniqueshellcombinationandthecorresponding y-axisvalueindicatestheR2scorewhentheRFistrainedonthat
par-ticularshellcombination.Forexample,thex-axisinFig. 4 Awillhave 12650points,eachonecorrespondingtooneofthe12650unique 4-shellcombinations.Asweareinterestedintheperformanceofthemodel withrespectto𝜏i(1stcolumn),werearrangetheshellcombinationsin
increasingorder accordingtotheirR2for𝜏
i. Thisresultsin a
mono-tonicallyincreasingcurvefor𝜏i,asseeninthefirstcolumn.Forf(2nd
column)andd(3rdcolumn),wekeepthex-axisorderingconsistentwith
theresultsfor𝜏iinthe1stcolumn.
TheR2scorescurvesinthe1stcolumnofFig. 4 showthatonlya
lim-itednumberofshellcombinationshaveagoodcorrelationcoefficient andareoptimalforestimating𝜏i,whiletheR2scoresinthe2ndand3rd
columnshowthatthemajorityofshellcombinationsprovidegood esti-matesoffandd.Forexample,inthenoisefree(bluecurves)4-shellcase inthetoprow,wenoticethatthedifferenceinR2scorefor𝜏
ibetween
thebestandtheworstperformingshellcombinationsisapproximately 0.5.Incontrast,thisdifferenceismuchnarrowerforfandd:≈0.02forf and≈0.01ford.WeobservethesametrendsforSNR=40(orange)and SNR=20(green).
BycomparingthebestR2scoresonthebluecurvesinFig. 4 Aand
Fig. 4 B,wecanseethatthereisnodifferenceinperformanceinthenoise freescenariobetweenusingthebestcombinationof4or9shells. How-ever,thischangeswiththeadditionofnoise.Forexample,forSNR=40 (orangecurves)theR2scoreofthebest9-shellcombinationis0.67,0.07
higherthanforthebest4shells.ThistrendissimilarforSNR=20(green curves),withadifferenceof0.1between9and4shells.Forthe16-shell scenario,wefindnoimprovementinperformanceoverusing9shells.
Fig.4alsoshowstheeffectofnoiseontheestimationofeach param-eter.Asexpected,theadditionofnoiseresultsinlowerR2scores,atrend
thatholdsforallparametersandacrossthe4and9-shellcase.However, theestimationof𝜏iisthemostaffectedbythepresenceofnoise:the
maximumcorrelationcoefficientdropsfrom0.82inthenoisefreecase to0.67forSNR=40andevenfurtherto0.52forSNR=20.Forf(2nd
Fig.4. PerformanceoftheRFmodelpredictionof𝜏i,fandd,trainedondifferentcombinationsof4(A)and9(B)shells.EachcurveshowstheR2score(y-axis)of theRFtrainedonadifferentcombinationofshells(x-axis).TheshellcombinationsaresortedinincreasingorderaccordingtotheirR2score.Weshowtheresults forthreelevelsofnoise:SNR=∞(bluecurve),SNR=40(orangecurve)andSNR=20(greencurve).TheR2scorefor𝜏
iiscalculatedonlyforvalues≤400msasthis istherangeoverwhichwearesensitivetothisparameter(seeSection3.1).
SNR=∞to0.94forSNR=20.Theestimationoftheintrinsicdiffusivityd isveryrobusttonoise:thecorrelationcoefficientsremainingveryhigh (0.99)evenwhentrainingthemodelontheSNR=20dataset. Further-more,wefindthatallthetop100combinationscontainthetwohighest b-valueshells(6,803and7,773smm−2)withthetwolongestΔs.
Addi-tionally,wefindthathighb-valueshellsonlymaximisetheperformance oftheRFincombinationwithlowb-valueshells(775and930smm−2).
ForSNR=40(orangecurves),whichweusewhenpredictingonthe in-vivodata,wefindthattheoptimalcombinationof9shellssortedby b-valueis[620,775,930,1241,1384,2489,4973,6803,7773]smm−2
withanR2scoreof0.67,andthebestcombinationof4shellsis[775,
930,6803,7773]smm−2withanR2scoreof0.60.Theseresultsshow
thattheoptimalb-valuesforboth4and9shellsareacombinationof lowandhighvalues,whichsamplebothshortandlong𝚫s.Similar re-sultswerealsoobtainedforthe“signalstrainingdatabase” (notshown). Sincewearelookingtooptimiseourframeworkforin-vivoestimation onthemousedata,werunthein-vivoexperimentsusingthebest9-shell combinationintheSNR=40scenario,asthenoiselevelwhichmatches ourin-vivodata.
3.3. Syntheticexperiments
Fig.5showstheRFresultsobtainedusingthefeature(toprow)and thesignal(bottomrow)noisefreedatabases.Toassessthequalityof ourfit,wedisplaytheresultsusingBland-Altmanplotsandcoloureach datapointaccordingtohowclosetheestimatesaretothegroundtruth values.Toaidvisualinterpretation,wecapthepercentageerrorat50%. Themeandifferencebetweenthegroundtruthandtheestimated val-uesisshownbytheblacklineandthe95%upperandlowerlimitsof agreementbythedashedlines.Forallthreeparametersofinterest,we observenooverallestimationbiasastheestimatesarespreadequally aroundthezero-differenceblackline.However,for𝜏i,theparameter
recoveryis notperfectandtheBland-Altmanplotsshow an overesti-mationbiasforsmallvaluesof𝜏iandanunderestimationbiasforlarge
values.TheR2scoresshowastrongcorrelationbetweentheestimatesof
ourmodelandthegroundtruthparametervalues:R𝜏i2=0.82/0.84
(fea-tures/signalsdatabase),Rf2=0.99(bothdatabases),andRd2=0.99(both
databases).Whenassessingthemodel’sperformancewithrespecttothe twotrainingdatabases(features/signals),weobservenosignificant dif-ferencebetweenthetwoapproaches.TheR2scoresremainunchanged
forfanddandshow onlyaminordifferencefor𝜏i:R2features=0.82
/R2
signals=0.84.Theadvantagesofeachapproacharediscussed
fur-therinSection 4 .Thenoise-freeresultsinFig. 5 provideabenchmark performanceofthemodelgivenourdataandimagingprotocol.
Fig.6showstheequivalentresultsforSNR=40.Thepresenceofnoise resultsinwiderlimitsofagreementandaffectsdifferentlytheestimation ofeachparameter.Themeandifferencelinesforallthreeparameters remainatzero,showingnogeneralbiasintheestimates.Intra-axonal volumefractionanddiffusivitycontinuetobeverywellestimatedand theircorrelationcoefficientsareonlyverymildlyaffectedbythe pres-enceofnoise:Rf2=0.97andRd2=0.99,equalforbothtrainingdatabases.
Incontrasttothis,thepresenceofnoisehasastrongereffectonthe es-timationof 𝜏i,resulting inalowerR2score andamore pronounced
overestimation/underestimationbiasforsmallandlargevalues respec-tively.Despitethis,wefindthattheRFworkswellwithinthe sensitiv-ityrangecomputedinSection 3.1 ,withaverygoodcorrelation coeffi-cientbetweenthemodel’sestimationsandgroundtruthfor𝜏i≤400ms
(R2=0.68).Outsidethisindicativesensitivityrange,thecorrelation
co-efficientisveryweak:R2=0.07for𝜏
i≥400ms.Inlinewiththenoise
freecase,wecontinuetoseenosignificantdifferencebetweenthesignal andthefeatureapproach:R2
features=0.67/R2signals=0.68.
3.4. In-vivoimagingexperiments
Toshowthatourinvivodataiswellrepresentedbyoursynthetic trainingdatabase,weperformadataqualitymatch(Fig. 7 ).Weplotthe signalintensityasafunctionoftheanglebetweenthediffusion gradi-entsandthecylindricalfibres’axis𝜃 (indegrees),fordifferentdiffusion
Fig.5.Bland-AltmanplotsfortheRFestimatesoff,𝜏ianddusingthefeatures(toprow)andsignals(bottomrow)noise-freesimulateddatabase.Toaidvisual interpretation,theplotsarecolor-codedwiththepercentageerrorcappedat±50%.
Fig.6. Bland-AltmanplotsfortheRFestimatesoff,𝜏ianddusingthefeatures(toprow)andsignals(bottomrow)simulateddatabasewithSNR=40,matchingthe noiselevelinourin-vivodata.Toaidvisualinterpretation,theplotsarecolor-codedwiththepercentageerrorcappedat±50%
gradientstrengths(G1-5=150–500mT/m)andforΔ={10.8,20.0}ms.
Fig. 7 providesacomparisonbetweenoneofoursimulatedsignals(at differentgradientstrengthsanddiffusiontimes)andtheexperimental signalsmeasuredfromavoxelinthecentreofthespleniumofaWT mouse.Wefindaverygoodmatchbetweenthesimulatedandin-vivo DW-MRIsignals,demonstratingthatourtrainingdatasetisagood rep-resentationofthein-vivomousedataset.Thisisanecessarycondition
foroursupervisedlearningapproachtobevalidandensuresthatduring thesupervisedlearningwelearnatrainingdatasetwhichissimilarto thetestdataset.However,pleasenotethatsimilarDW-MRIsignalsdo not necessarilyimply similarunderpinning microstructure.This very knownambiguity(Jelescuetal,2016b,Novikovetal,2019)isoneof themainchallengesinmicrostructureimaging,leadingtohigher uncer-taintyinthemodelparameterestimation.
Fig.7. Comparisonbetweenthein-vivo(left)andsimulated(right)signalintensityasafunctionoftheanglebetweendiffusiongradientsandthecylindricalfibres’ axis𝜃 (indegrees),fordifferentdiffusiongradientstrengths(G1-5=150-500mT/m)andtwoΔs:10.8ms(bluelines)and20.0ms(greenlines).Thedashedblackline intheexperimentaldatarepresentsthenoisefloorlevel.
Fig.8. RepresentativeDW-MRIb=0imagesof:A)aWTmousescaninourcohortandB)aCPZmousescaninourcohort.C)ROIsoftheCCoverlaidonthezoomed inb=0imageoftheWTmousescan.ThethreeROIsaregenu(G-CC),body(B-CC)andsplenium(S-CC).TheyellowsquareindicatestheregioninwhichtheCCis found.
Fig.8showsexamplesofDW-MRIb=0imagesforaWT(Fig. 8 A) andforaCPZ(Fig. 8 B)mouse.Wecanobservetheappearanceofthe CCintheCPZscanisdifferentfromtheWT,showingtheeffectof de-myelination.Fig. 8 CshowsthethreeROIsoftheCCoverlaidontheb=0 imageoftheWTscan.WemanuallydefinethreeROIsontheCCmasks ofeachmousescan:splenium(S-CC),body(B-CC)andgenu(G-CC)by followingthedistributionoftheRDvaluestohelplocalizethecentral voxelsofthesethreemainregions:thegenuandspleniumofthecorpus callosumshowalowerRDthanthebody.Wethencalculatethemean parameterestimatesforNODDI(ODI),DTI(AD,RD,FA)andRF(f,𝜏i,
d)ineachROIforeverymouse,andstudythedifferencesbetweenthe WTandtheCPZgroups.Wepresenttheseresultsintheremainderof thissection.
Fig.9showsCCmapsforNODDIandDTIparametersforone ex-emplarhealthyWTmouse(firstcolumn)andoneexemplarCPZmouse (secondcolumn).AvisualinspectionoftheCCmapsrevealsno signif-icantchangesinODIandADbetween thetwomice,togetherwitha significantincreaseinRDanddecreaseinFA.
Weobservethesametrendsin theDTIandNODDIparametersat grouplevel,asshowninFig. 9 B.Weillustratethedifferencebetween
theWT groupandtheCPZ groupthrough boxandwhiskerplotsin thethreeROIsoftheCC:genu(G-CC),body(B-CC)andsplenium (S-CC).We findtheestimates ofODI inthetwogroupstobe between 0.15and0.29,suggestingverylowdispersion,inlinewithrecently re-portedvaluesinliterature(Wangetal.,2019).Furthermore,wefind no statisticallysignificantdifferenceinNODDIODIbetween thetwo groupsinthethreeregionsoftheCC,afindingthatisalsoinlinewith Wangetal.(2019).TheDTIestimatesshownegligiblechangesinAD, asignificantincreaseinRDandasignificantdecreaseinFA.These re-sultsareconsistentwithalreadypublishedresults(Boretiusetal.,2012, Songetal.,2005, Zhangetal.,2012b).
Thein-vivoRFestimatesoff,𝜏ianddobtainedusingtherawsignal
databasearepresentedinFig. 10 .
TheparametricCCmapsshowninFig. 10 Acorrespondtothesame WTmouse(firstcolumn)andCPZmouse(secondcolumn)inFig. 9 A. TheCCmapsshowastatisticallysignificantdecreaseinf(firstrow)and 𝜏i(secondrow),andnosignificantchangeind(thirdrow).Toprovidea
morequantitativeanalysis,weplottheboxandwhiskerplotsof region-specificparametercomparisonsbetweentheWTandtheCPZgroupover thethreeCCROIs(Fig. 10 B).ThetrendsobservedvisuallyinFig. 10 A
Fig.9. A)ParametricmapsoftheCCinahealthyWTmouse(firstcolumn)andaCPZmouse(secondcolumn)obtainedfromconventionalDTIatb=1241s/mm2 andfromNODDIODI.B)Boxandwhiskerplotsofregion-specificcomparisonbetweenWT(N=8)andCPZ(N=8).DTImetrics(AD,RD,FA)areevaluatedwithin thegenu(G-CC),body(B-CC)andsplenium(S-CC)oftheCC.Statisticalsignificanceisassessedbyusinga2-tailedt-testwithequalvarianceandsignificancelevel: ∗=0.01,∗∗=0.005,∗∗∗=0.001.‘n.s.’standsfornon-significant.
Table2
MeanandstandarddeviationofRFestimatesforf,𝜏ianddinthethreeCCROIsfortheWTandCPZ group.CPZregionsthatarestatisticallydifferentfromWTregionsaremarkedwith∗forp<0.01,∗∗ forp<0.005and∗∗∗forp<0.001.
f 𝜏i d
WT CPZ WT CPZ WT CPZ
S-CC 0.443 (0.005) 0.428(0.003) ∗∗∗ 370 (7) 310 (15) ∗∗∗ 1.12 (0.07) 1.18 (0.07) B-CC 0.430 (0.002) 0.424(0.001) ∗∗∗ 370 (9) 330 (10) ∗∗∗ 1.10 (0.05) 1.15 (0.03) G-CC 0.440 (0.006) 0.429(0.003) ∗∗ 380 (14) 350 (12) ∗∗ 1.15 (0.02) 1.11 (0.04)
holdforthegroup-wisequantitativecomparison(WTversusCPZ):we observestatistically significantdecreasesinfand𝜏i andanegligible
andstatisticallyinsignificantincreaseind.Thesetrendsareconsistent acrossallthreeregionsoftheCC.Themeanandstandarddeviationsof theRFparameterestimatesforeachROIarereportedinTable 2 . 3.5. Correlationwithpost-mortemanalysis
ThehistologicalEMmeasurementsinthesplenium,bodyandgenu oftheCCoverthecohortofWT(blue)andCPZ(black)micearereported inthehistogramsofFig. 11 .Ourhistologicaldatashowsnoaxonalsize changes(Fig. 11 C)andnosignificantaxonalloss(datanotshownhere) betweenthetwocohorts.TheaxonaldiametermeasurementsinFig. 11 C
do nottakeintoaccount thecommonlyaccepted shrinkagefactorof 30%(Barazanyetal.,2009,Innocentietal.,2015),afterwhichthe dif-ferencesbetweenthetwogroupscontinuetoremainstatistically non-significant. Wealsofindastatistically significantdecreasein myelin thickness(Fig. 11 B)correlatedwithanincreaseinthegratio(Fig. 11 A) andadecreaseintheintra-axonalvolumefraction(Fig. 11 D).Finally, wemeasureaweakbutnotstatisticallysignificantcorrelationbetween axonaldiameterandintra-axonalvolumefractionfromtheEManalysis (ϱ =0.34andp=0.51>0.05).
Next,westudythecorrelationbetweenthesechangesandthe esti-matesoftheRFmodelinFig. 12 .Weassessthestatisticalsignificance ofthelinearcorrelationbetween𝜏iandmyelinthicknessfromEMwith
Fig.10. A)ParametricmapswiththeRFestimatesforf,𝜏ianddintheCCofahealthyWTmouse(firstcolumn)andaCPZmouse(secondcolumn).B)Boxand whiskerplotsofregion-specificcomparisonbetweenWT(N=8)andCPZ(N=8).RFestimatesforf,𝜏ianddarecomputedindependentlyforallvoxelswithinthe genu(G-CC),body(B-CC)andsplenium(S-CC)oftheCC.Statisticalsignificancewasassessedbyusinga2-tailedt-testwithequalvarianceandsignificancelevel: ∗=0.01,∗∗=0.005,∗∗∗=0.001.‘n.s.’standsfornon-significant.ThedifferenceinthemorphologyoftheCCbetweentheWTandtheCPZmiceismostlyduetodifferent masking,subjecttodifferentpartialvolumewithintheCSFofeachmouse.
Fig.11. Histologyresults.ThemeanandthestandarddeviationoftheEMmeasurementsinthesplenium,bodyandgenuoftheCCforthecohortofWT(blue)andCPZ (black)mice:thegratio(A),myelinthickness(B),meanaxonaldiameter(C)andintra-axonalvolumefraction(D).
Fig.12. Statisticalsignificanceandcorrelationsbetween:A)theexchangetimefromDW-MRI(y-axis)andmyelinthicknessfromEM(x-axis)andB)theintra-axonal volumefractionfromDW-MRI(y-axis)andEM(x-axis).EachpointrepresentsthemeanoveroneregionoftheCCfortheWT(bluesquares)andCPZ(blackcircles) group.Errorbarsindicatethestandarddeviationovertheregion.
ofeachCCROIoftheWT(bluesquares)andCPZ(blackcircles)group (Fig. 12 A).WefindaPearsonlinearcorrelationcoefficient ϱ of0.82 andap-value<0.05for𝜏i,showingagoodcorrelationbetweentheRF
estimatesoftheexchangetimefromDW-MRI(y-axis)andhistological measurementsofmyelinthickness(x-axis).
Similarly, we investigate thestatistical significance of the linear correlationbetweenintra-axonalvolumefractionfasestimated from DW-MRI (y-axis) and from EM (x-axis) (Fig. 12 B). We find a Pear-soncorrelationcoefficientϱ of0.98andap-value<0.001,showinga strongcorrelationbetweentheRFestimatesandthehistological mea-surementsof theintra-axonalvolume fraction.Notethatthelowerϱ
valuefortheanalysisinFig. 12 Aislikelydue tothesensitivitylimit ofthecurrent experimentalprotocoltochangesin 𝜏i. Moreover,the
factthatEMmeasurementsofintra-axonalvolumefractionare consis-tentlyhigherthantheRFestimationfrominvivoDW-MRImaybedue tounaccountedshrinkageeffects, whichaffect mostlythe extracellu-larspaceandthuscanleadtoanincreaseintheintra-axonalvolume fraction.
Discussion
Inthiswork,wefocusontheexperimentalstudyofaRFbased com-putationalmodelforaxonalpermeabilityestimationusinganin-vivo cuprizonemousemodelofdemyelination.Becausenoanalyticalmodel isavailableforpermeabilitycharacterisationinthegeneralcaseof nei-therveryfastorveryslowexchange,here weusethecomputational approachproposedinNedjatietal.(2017).Specifically,weuseMonte Carlosimulationsof theDW-MRI signalandtrainourmodelto esti-matemicrostructureparameterswithafocusontheintra-axonal wa-terexchange time𝜏i,aparameterinverselyrelatedtoaxonal
perme-ability.Usingsyntheticsubstratesmimickingourin-vivodata,weshow thatourimagingprotocolhasgoodsensitivitytoexchangetimes𝜏i ≤
400msforlargeaxons(meandiameterof2𝜇m)andto𝜏i ≤250ms
forsmallaxons(meandiameterof0.4𝜇m)underthenoiseconditions ofourin-vivodata(SNR=40).Followingfromthis,wefindthattheRF modelwedevelopedworksverywellinthisrange:wefindagood cor-relationbetweenRF estimatesandthegroundtruthfor𝜏i ≤400ms
(R2=0.87forSNR=infandR2=0.68forSNR=40),andaweak
correla-tionfor𝜏i >400ms(R2=0.3forSNR=infandR2=0.07forSNR=40)
due tothelow sensitivityin our protocol forvalues above 400 ms. Inourin-vivoimagingexperiments,wefindthattheRFestimates of 𝜏iarewithinthesensitivityrangeandinlinewithliteraturevaluesof
theexchangetimereportedinhealthyratbraintissue(Prantner,2008, Quirketal.,2003).Furthermore,wefindthattheRFestimatesof𝜏iin
theCPZgrouparesignificantlylowerthanintheWTgroup,afinding
thatonewouldintuitivelyexpecttoseeinamodelofdemyelination. Furthermore,wefindthatourintra-axonalvolumefractionestimates inCPZmicearealsosignificantlylowerthanincontrols.Theseresults arein strongagreement(ϱ𝜏i = 0.82,ϱf = 0.98)withour EM
histol-ogy resultsof myelinthicknessandintra-axonalvolumefraction, re-spectively.Finally,weshowthatpotentiallyconfoundingfactorssuch asaxonalswellinganddispersionhaveanegligibleeffectonthe esti-mateddifferencesbetweentheWTandCPZgroup.Theseresults sug-gestforthefirsttime,quantitativelyandin-vivo,thatmachinelearning basedcomputationalmodelscouldactasasuitablebiomarkerto de-tectandtrackchangesindemyelinatingpathologies.Furthermore,they supporttheapplicationof𝜏i asmoresensitiveandspecificmarkerof
demyelination.
4.1. Simulations
Sensitivityanalysis.Oursensitivityanalysisshowsthatourimaging protocolhasgoodsensitivityforexchangetimesintherange𝜏i ∈[0,
400]msforsubstrateswithlargeaxons(meandiameter𝜇D=2𝜇m)and
in therange𝜏i ∈[0,250] msfor substrateswithsmallaxons(mean
diameter𝜇D=0.4𝜇m),undernoiseconditionsmatchingthatofour
in-vivodata(SNR=40).Generallyspeaking,thenoiseinthedataaffects thesensitivitydifferently,dependingonthemeanaxondiameterinthe substrate. Forsubstrates withlargeaxons (𝜇D=2𝜇m), thesensitivity
halvesfrom𝜏i∈[0,400]msforSNR=40to𝜏i∈[0,200]msforSNR=20.
Forsubstrateswithsmalleraxons(𝜇D=0.4𝜇m),decreasingtheSNRfrom
40 to20 hasasmallereffectonthesensitivityrange,reducingitby 44%from𝜏i ∈[0,250]ms(SNR=40)to𝜏i ∈[0,140]ms(SNR=20).
Furthermore,wefindthatthelargertheaxonsinthesubstrate,thebetter thesensitivityrange.Substrateswith𝜇D=2𝜇mhaveasensitivityrange
widerby60%(forSNR=40)andby43%(forSNR=20)thansubstrates with𝜇D=0.4𝜇m.
Shellselection.Tooptimisetheperformanceofthemachinelearning model,weexplorethewiderangeofparametersinourPGSEprotocol andselectthebestcombinationof4and9shells.Weshowthatforour in-vivodatawithSNR=40thenumberofshellsthatmaximisesthe per-formanceofthemodelis 9,withtheb-values[620,775,930,1241, 1384,2489,4973,6803,7773]smm−2andanR2scoreof0.67.When
analysingthebestcombinationsof4and9shells,weobservethatthey sampleeveryvalueof𝚫 inoursequence,resultinginacombinationof lowandhighb-valueshells.Thisfindingisinaccordancewiththe opti-misedSTEAMprotocolinNedjatietal.(2017),whichcontainstwolong
𝚫 andtwoshort𝚫 shells.Thissuggeststhattomaximisesensitivityto theintra-axonalexchangetime,itisnecessarytoincludeacombination ofshortandlong𝚫s.
Weshowthatnoiseisanimportantfactorfortheperformanceofour model.Wefindthatinthenoisefreecase,itissufficienttouseonly4 shellsasintroducingmoreshellsdoesnotimproveperformance. How-ever,inthepresenceofnoise,wefindthatincreasingthenumberof shellsfrom4to9improvestheR2scorebetweentheestimatedandthe
groundtruth𝜏i.Apotentialexplanationforthisisthattheadditionof
noisecorruptstheinformationineachshell,andhavingmoreshellsto corroborateinformationfromhelpstheRFmodellearnbetter.Our anal-ysisalsorevealsthatincreasingthenumberofshellsabove9doesnot offeranyadditionalbenefitseveninthepresenceofnoise.Moreover,we showthatnoisehasastrongereffectontheestimationof𝜏i,forwhich
theR2scoredropsfrom0.84inthenoisefreecaseto≈0.5forSNR=20.
Theestimationoffanddisconsiderablymorerobust:R2
noise-free=0.99
versusR2
SNR=20=0.94forfandnodropford.ThissuggeststhatSNR
playsanimportantroleinaprotocol’ssuitabilityforpermeability esti-mationusingourapproach.
Featureextraction. Whenextracting therotationally invariant fea-turesfromoursyntheticsignals,weobtainmeaningfulvaluesforallb shellsinthesyntheticdata.Whenweapplythesamemethodtoin-vivo data,thefeatureextractionbecomesdifficultanddoesnotgive mean-ingfulresultsforbshellswithhighgradientstrength(above300mT/m) andhighb-values.Webelievethatthisdifferenceismostlikelydueto theeffectoffibredispersion,presentinthein-vivodatabutnotincluded inoursimulations.Asthegradientstrengthincreases,thedispersed fi-breswouldcauselargerdropsinthesignal,ascanalsobeseenin(Fig. 7 ), wherewenoticethatthedropinthesignalintensityrelativetothe gra-dientdirection is lessprominentin thesyntheticsignalsthanin the in-vivodata.Moreover,wenotethattheoreticallythediffusiontensor featuresatbvalueshigherthan2000s/mm2losetheirphysical
mean-ing.However,herewedonotinterpretthediffusiontensorfeaturesat highbvaluesintermsoftissuemicrostructure,butweratherusethem justasconvenientmetricstorepresentthesignal.Notethatweinclude allofthediffusiontensorfeaturesevenifsomeofthemarenotmutually independent.Weprefertoworkwithacomprehensivesetoffeaturesto ensurethatourmachinelearningalgorithmfindsthemostinformative splitcriteria.
Syntheticdataexperiments.TheRFmodelestimatesinthenoisefree casehaveverystrongcorrelationswiththegroundtruthvalues, pro-vidinganexcellentbenchmarkperformanceforourmodelandimaging protocol(f:R2=0.99,𝜏
i:R2=0.84d:R2=0.99).Weshowthatthe
addi-tionofnoisewithSNR=40,matchingourin-vivodata,doesnotaffect muchtheestimationof fandd(f:R2=0.97,d:R2=0.99),however,it
hasastrongereffectontheestimationof𝜏i.Inlinewithoursensitivity
results,for𝜏i<400mstheeffectispresent,however,theperformanceis
stillsufficientlygood(R2=0.68),whilefor𝜏
i>400mstheperformance
ofthemodelisseverelyaffected(R2=0.07).Theestimationoffandd
isconsiderablymorerobustthanthatof𝜏idue totheuseof arange
ofgradientstrengthsfrom50to300mT/m,whichhasbeenshownto improvethesensitivitytofandd(Huangetal,2015,Sepehrbandetal 2016).Moreover,therobustestimationoffanddisinagreementwith whathasbeenshownby Fieremansetal.(2011)abouttheestimation offanddinthecaseofparallelfibres.Indeed,thecaseofparallelfibers issolvableanalyticallyusingonlyfourestimatedparameters:diffusivity andkurtosisinthedirectionsparallelandperpendiculartothefibres. Sincealltheinformationforcomputingtheseparametersispresentin thedata,thisexplainsthehighfidelityoftheprediction.However,we notethatFieremansetal.’smodelisconfoundedbythefiberorientation dispersion,whichisknowntobepresentinwhitematter(Ronenetal., 2014)andtherefore,inthecaseofnon-negligiblefibredispersion,our parameterestimatesmaybebiased.
Inadditiontothis,wecompareforthefirsttimethesignaland fea-turetrainingapproachesandshowthatthereisnosignificantdifference intheRFperformanceaccordingtowhichdatabaseisusedfortraining. Thisisasignificantresultasitshowsthatwhenextractingthe rotation-allyinvariantfeaturesfromtherawsignalswedonotloseinformation thatisessentialfortrainingourmodel.Consequently,wecanusethe
featuresdatabasewithoutaffectingtheperformanceofourmodel.The advantage ofarotationallyinvariantfeature approachisthatitdoes notrequirethegenerationofanewlibraryforeverynewacquisition protocol aslong astheb-valuesandthe TEof theprotocolsmatch. Nevertheless,asdiscussedabove,cautionshouldbe appliedwiththis approach whentheacquisitionprotocoluses highgradientstrengths (G≥300mT/m)andtheSNRislow,suchasconditionsoftenfoundin thepre-clinicalsetting,andthenusingsignalsdatabasemightbe the preferablechoice.Ontheotherhand,intheclinicalsetting,imaging protocolshavemuchlowergradientstrengthsandsufficientSNRtofit theDTIandSHmodelparametersinthefeatureextractionapproach, andconsequently,weexpecttherotationallyinvariantfeatureapproach tobeabetterchoice(asusedinNedjatietal.(2017)).Irrespectiveof thetrainingapproach,weexpectourmodel’sperformancetobesimilar inboththeclinicalandpreclinicalsetting.
4.2. In-vivomousedataandcorrelationwithpost-mortemanalysis Ourdataqualitymatchshowsthatoursynthetictrainingdataisa goodrepresentation ofthein-vivodata.Our DTIresults showan in-creaseinRDandadecreaseinFAbetweenthetwogroups.Thiscould beexplainedbythebreakdownofthemyelinlayerwhichallows wa-tertodiffusemoreintheradialdirection,leavingADunchangedand having theoveralleffect ofreducing FA.These changesin DTI met-ricsareinagreementwiththosereportedinseveralstudiesoftheCPZ mousemodelofdemyelination(Boretiusetal.,2012,Songetal.,2005, Zhangetal.,2012b).Nevertheless,theDTImetricsarenotspecific be-causetheyprovideonlyindirectmeasuresoftheunderlying microstruc-turalchangesintheCPZmodel.Forinstance,theobservedincreasein RDmaybeduetotheincreasespacesbetweentheaxonsandnottothe higherpermeabilityoflessmyelinatedaxons.
Ontheotherhand,ourRFestimatesof𝜏iprovideamoredirectand
specificmeasureofpermeability.Infact,inourcomputationalmodel, diffusivity(viad)andpermeability(via𝜏i)aredecoupledand
individ-ually estimatedfrom thedata. Wefindthat ourestimationsof 𝜏i in
thehealthymicecomparewellwithliteraturevalues.Studieson sph-ingomyelinmembranesfoundinaxonalmembranessuggestvalues be-tween300msand600msforaxonswithradiibetween0.5and1𝜇m (Finkelstein,1976).Contrastagentandrelaxometrystudiesintherat brainestimatetheintracellularwaterexchangelifetimeintheratbrain tobebetween200ms(Prantner,2008)and550ms(Quirketal.,2003). Itisworthwhiletonotethatourexperimentalprotocoldoesnot pro-videenoughsensitivitytodetectexchangetimes >0.4s.Hence,our methodwouldestimate𝜏i~ 0.4sforanyactualexchangetime≥0.4s.
Nevertheless,wehavehighsensitivitytoreliablymeasureanychanges in 𝜏ioccurringbelow0.4sduetodemyelination.Asaccurate
histol-ogymeasurementsof𝜏iarenotavailableduetotissuefixationaltering
themembranepermeability,wecompareourestimatesof𝜏iwithEM
measurementsofmyelinthickness.Wecomputemyelinthicknessfrom myelinatedaxonsonly,anditincludesboththeeffectofdemyelination inducedbyCPZandsomeremyelinationthathappensspontaneouslyin theCPZmodel(MatsushimaandMorell,2001).Wefindastrong corre-lationbetweentheRFestimatesof𝜏iandmyelinthickness(ϱ𝜏i=0.82).
This isin verygoodagreementwitharecentlypublishedsimulation workinvestigatingthelinkbetweenexchangetimeandmyelinthickness (Brusinietal.,2019),furthersupportingthefindingsthatmyelin wrap-pingcanmeaningfullycontributetothesignalinDW-MRIandimpact𝜏i.
Furthermore,ourRFestimatesofdlieintherange1–1.3𝜇m2sm−1,an
expectedrangeforthemouseCC(Wuetal.,2008),andourestimates offcorrelateverystronglywiththeEMintra-axonalvolumefraction measurements(ϱf=0.98).
Whencomparingthetwogroups,weobservethefollowinggeneral trends: a statisticallysignificant decreasein the intra-axonalvolume fractionfandintheintra-axonalexchangetime𝜏i,togetherwitha
neg-ligibleandstatisticallyinsignificantincreaseintheintrinsicdiffusivity d.WeexpectftobelowerintheCPZgroupasthereisanincreasein