HAL Id: hal-02470876
https://hal-univ-rennes1.archives-ouvertes.fr/hal-02470876
Submitted on 21 Feb 2020
HAL is a multi-disciplinary open access
archive for the deposit and dissemination of
sci-entific research documents, whether they are
pub-lished or not. The documents may come from
teaching and research institutions in France or
abroad, or from public or private research centers.
L’archive ouverte pluridisciplinaire HAL, est
destinée au dépôt et à la diffusion de documents
scientifiques de niveau recherche, publiés ou non,
émanant des établissements d’enseignement et de
recherche français ou étrangers, des laboratoires
publics ou privés.
Exploring the Correlation Between M/EEG
Source-Space and fMRI Networks at Rest
Jennifer Rizkallah, Hassan Amoud, Matteo Fraschini, Fabrice Wendling,
Mahmoud Hassan
To cite this version:
Jennifer Rizkallah, Hassan Amoud, Matteo Fraschini, Fabrice Wendling, Mahmoud Hassan.
Ex-ploring the Correlation Between M/EEG Source-Space and fMRI Networks at Rest. Brain
Topog-raphy: a Journal of Cerebral Function and Dynamics, Springer Verlag, 2020, 33 (2), pp.151-160.
�10.1007/s10548-020-00753-w�. �hal-02470876�
1
Exploring the correlation between M/EEG source-space
and fMRI networks at rest
Jennifer Rizkallah
1, 2, Hassan Amoud
2, Matteo Fraschini
3, Fabrice Wendling
1and Mahmoud
Hassan
1,41 Univ Rennes, LTSI, F-35000 Rennes, France
2 Azm Center for Research in Biotechnology and its Application, EDST, Lebanese University, Lebanon
3 Department of Electrical and Electronic Engineering, University of Cagliari, Piazza D’armi, Cagliari, I-09123,
Italy
4 NEUROCORT Technologies, R&D department, Rennes, France.
* Corresponding author: [email protected]
Abstract
Magneto/Electro-encephalography (M/EEG) source connectivity is an emerging approach to estimate brain networks with high temporal and spatial resolutions. Here, we aim to evaluate the effect of functional connectivity (FC) methods on the correlation between M/EEG source-space and fMRI networks at rest. Two
main FC families are tested: i) FC methods that do not remove zero-lag connectivity including Phase Locking Value (PLV) and Amplitude Envelope Correlation (AEC) and ii) FC methods that remove zero-lag connections such as Phase Lag Index (PLI) and two orthogonalisation approaches combined with PLV (PLVCol, PLVPas) and
AEC (AECCol, AECPas). Methods are evaluated on resting state M/EEG signals recorded from healthy participants
at rest (N=74). Networks obtained by each FC method are compared with fMRI networks (obtained from the Human Connectome Project). Results show low correlations for all FC methods, however PLV and AEC networks are significantly correlated with fMRI networks (ρ=0.12, p=1.9310-8 and ρ=0.06, p=0.007,
respectively), while other methods are not. These observations are consistent for all M/EEG frequency bands and for different FC matrices threshold. Our main message is to be careful in selecting FC methods when comparing or combining M/EEG with fMRI. We consider that more comparative studies based on simulation and real data and at different levels (node, module or sub networks) are still needed in order to improve our understanding on
the relationships between M/EEG source-space networks and fMRI networks at rest.
Keywords:
Magneto/Electro-encephalography, functional brain networks, connectivity measures
Manuscript Click here to
access/download;Manuscript;MS_Rev2_BTOP.docx
Click here to view linked References
1 2 3 4 5 6 7 8 9 10 11 12 13 14 15 16 17 18 19 20 21 22 23 24 25 26 27 28 29 30 31 32 33 34 35 36 37 38 39 40 41 42 43 44 45 46 47 48 49 50 51 52 53 54 55 56 57 58 59 60 61 62 63 64
2
Introduction
Magneto/Electro-encephalography (M/EEG) source-space connectivity is a unique non-invasive technique, which enables the tracking of large-scale brain network dynamics on a sub-second time-scale (Schoffelen and Gross 2009, Hassan and Wendling 2018, O'Neill, Tewarie et al. 2018). Benefiting from the excellent time resolution of the M/EEG (sub-millisecond), the method consists of identifying brain networks in the cortical space through sensor-level signals. However, several methodological choices should be carefully accounted for to avoid pitfalls.
In this regard, the spatial leakage (presence of spurious connections) was considered as one of the main challenges that affects the accuracy of the M/EEG source-space networks. This leakage effect was shown to lead to false positive observations: artificial interactions caused directly by signal mixing regardless of whether true connections are present and spurious interactions, also known as ghost interactions, arising indirectly from the spread of signals from true interacting sources to nearby false loci (Palva, Wang et al. 2018, Wang, Lobier et al. 2018). Source signals are spread by mixing to produce artificial synchronization and the true interactions are mirrored in several spurious interactions (Palva and Palva 2012). To deal with this problem, most existing approaches are based on the hypothesis that leakage generates inflated connectivity between estimated sources, which manifests as zero-phase-lag correlations. Thus, these methods dealt with the leakage problem by removing the zero lag connections (Nolte, Bai et al. 2004, Stam, Nolte et al. 2007) or adopting orthogonalisation-based approach (Brookes, Woolrich et al. 2012, Hipp, Hawellek et al. 2012, Pascual-Marqui, Biscay et al. 2017).
Several studies have been conducted to explore the reliability of M/EEG resting-state functional connectivity (FC) methods (De Vico Fallani, Richiardi et al. 2014, Bastos and Schoffelen 2016) (Liuzzi, Gascoyne et al. 2017) (Maldjian, Davenport et al. 2014) (Colclough, Woolrich et al. 2016). Globally, the MEG-based studies showed good consistency between FC methods to produce the population's connectivity pattern and intra/inter subjects’ variability. Concerning the EEG-based analyses, methods were first compared in the sensor-space (Hardmeier, Hatz et al. 2014) or comparing functional and effective connectivity metrics in the source-space (Mahjoory, Nikulin et al. 2017).
Here we compare two families of FC methods: i) the FC methods that do not remove the zero-lag-phase
connectivity including the Phase Locking Value (PLV) and the Amplitude Envelope Correlation (AEC) and ii) the FC methods that remove the zero-lag connections such as the Phase Lag Index (PLI) and two orthogonalisation approaches developed by (Colclough, Brookes et al. 2015) and (Pascual-Marqui, Biscay et al. 1 2 3 4 5 6 7 8 9 10 11 12 13 14 15 16 17 18 19 20 21 22 23 24 25 26 27 28 29 30 31 32 33 34 35 36 37 38 39 40 41 42 43 44 45 46 47 48 49 50 51 52 53 54 55 56 57 58 59 60 61 62 63 64
3
2017) were combined with PLV (PLVCol, PLVPas) and AEC (AECCol, AECPas). Networks obtained by each methodwere compared with the networks obtained using fMRI.
Materials and Methods
Participants
High density EEG recordings (256 channels, EGI, Electrical Geodesic Inc.) were collected from thirty healthy participants (16 women and 14 men; mean age, 38 y). Experiments were performed in accordance with the relevant guidelines and regulations of the National Ethics Committee for the Protection of Persons (CPP), (BrainGraph study, agreement number 2014-A01461-46, promoter: Rennes University Hospital), which approved all the experimental protocol and procedures. All participants in the study provided written informed consents. Participants were asked to relax for 10 minutes with their eyes closed during the acquisition without falling asleep.
Data acquisition and preprocessing
EEG signals were sampled at 1000 Hz, band-pass filtered within 0.1-45 Hz, and segmented into non-overlapping 40 s long epochs (Chu, Kramer et al. 2012, Fraschini, Demuru et al. 2016). Electrodes with poor signal quality (amplitude > 100 µV or < -100 µV) have been identified and interpolated using signals recorded by surrounding electrodes. Segments that have more than 20 electrodes interpolated have been excluded from the analysis. Three clean epochs per subject were then used for source estimation. Three subjects were excluded from the study due to noisy data. 1 2 3 4 5 6 7 8 9 10 11 12 13 14 15 16 17 18 19 20 21 22 23 24 25 26 27 28 29 30 31 32 33 34 35 36 37 38 39 40 41 42 43 44 45 46 47 48 49 50 51 52 53 54 55 56 57 58 59 60 61 62 63 64
4
Fig.1 Structure of the investigation in the case of EEG data. EEG recordings were preprocessed and clean EEG epochs were used to solve the inverse problem using wMNE. Statistical couplings were then computed between the reconstructed sources using different methods (PLV, AEC, PLI, PLVCol, AECCol,PLVPas and AECPas). The adjacency matrices were then compared with the fMRI functional connectivity
matrix obtained from HCP. Abbreviations: EEG: electroencephalogram; wMNE: weighted Minimum Norm Estimate; PLV: phase locking value; AEC: amplitude envelope correlation; PLI: phase lag index; fMRI: functional magnetic resonance imaging; HCP: human connectome project
Estimation of regional time series
First, the MRI template “Colin27” (Holmes, Hoge et al. 1998) and EEG channel locations were co-registered using Brainstorm (Tadel, Baillet et al. 2011). The lead field matrix was then computed for a cortical mesh of 15000 vertices using OpenMEEG (Gramfort, Olivi et al. 2010). The noise covariance matrix was calculated using a long segment of EEG data at rest, as recommended in (Tadel, Baillet et al. 2011). An atlas-based approach was used to project EEG signals onto an anatomical framework consisting of 68 cortical regions identified by means of the Desikan-Killiany atlas (Desikan, Ségonne et al. 2006). To reconstruct the regional time series, we used the weighted Minimum Norm Estimate (wMNE), widely used in the context of EEG source localization (Hauk 2004, Gramfort, Kowalski et al. 2012, Hassan, Benquet et al. 2015, Kabbara, Falou et al. 2017, Rizkallah, Benquet et al. 2018) and showed higher performance than other algorithms in several comparative studies (Hassan, Dufor et al. 2014, Hassan, Merlet et al. 2016). Each regional time-series correspond to the average of number of vertices after flipping the sign of sources with opposite directions. The regional time series were then band-passed filtered using zero-phase forward and reverse digital IIR filtering in 1 2 3 4 5 6 7 8 9 10 11 12 13 14 15 16 17 18 19 20 21 22 23 24 25 26 27 28 29 30 31 32 33 34 35 36 37 38 39 40 41 42 43 44 45 46 47 48 49 50 51 52 53 54 55 56 57 58 59 60 61 62 63 64
5
the different EEG frequency bands: Delta [0.5-4 Hz], Theta [4-8 Hz], alpha [8-13 Hz], beta [13-30 Hz] and gamma [30-45 Hz]. Results are presented in beta band, in which previous studies have reported its importance in driving large-scale spontaneous neuronal interactions (Brookes, Woolrich et al. 2011, de Pasquale, Della Penna et al. 2012), results for other frequency bands are presented in the supplementary materials. Finally, functional networks were computed using EEG source connectivity method (Schoffelen and Gross 2009, Sakkalis 2011, Hassan, Dufor et al. 2014, Hassan, Benquet et al. 2015, Rizkallah, Benquet et al. 2018) by measuring the functional connectivity between the reconstructed regional time series (Fig.1).MEG data
We used preprocessed resting state MEG data from 44 participants (26 women and 18 men; mean age between 28 and 32 years old) collected at the human connectome project (HCP) (Van Essen, Smith et al. 2013). We chose only the participants for whom both MEG and fMRI recordings are available. Same steps as for EEG were performed to estimate the MEG regional time series and estimate the functional networks.
Connectivity measures
The functional connectivity analysis was performed by computing pair-wise statistical interdependence between regional time series using:
1) Phase locking value (PLV)
The phase locking value between two signals x and y is defined as (Lachaux, Rodriguez et al. 1999):
2 ( ) ( ) 21
( )
t j y t x t tPLV t
e
d
where φy(t) and φx(t) are the phases of the signals x and y at time t extracted using the Hilbert transform. δ
denotes the size of the window in which PLV is calculated. Here, we used a sliding window technique for each epoch to compute the FC matrices. The smallest window length recommended by (Lachaux, Rodriguez et al.
2000) was used, equal to
number of cycles
central frequency
where the number of cycles at the given frequency band isequal to 6. Finally, FC were averaged over the 40s epoch.
2) Phase lag index (PLI)
The PLI was introduced as an alternative measure of PLV and less sensitive to the influence field spread and amplitude effects. It is defined as follows (Stam, Nolte et al. 2007):
1 2 3 4 5 6 7 8 9 10 11 12 13 14 15 16 17 18 19 20 21 22 23 24 25 26 27 28 29 30 31 32 33 34 35 36 37 38 39 40 41 42 43 44 45 46 47 48 49 50 51 52 53 54 55 56 57 58 59 60 61 62 63 64
6
( )
( )
y x
PLI
sign
t
t
Where φy(t) and φx(t) are the phases of the signals x and y at time t and 〈〉 denotes the average over the time.
3) Amplitude envelope correlation (AEC)
The envelopes of the regional time series were estimated using Hilbert transform then Pearson correlation between amplitude envelopes was computed (Brookes, Gibson et al. 2004).
4) Orthogonalisation approach
Two different orthogonalisation approaches were used to remove all shared signal at zero-lag between regional time series in the time domain: the symmetric orthogonalisation technique developed by (Colclough, Brookes et al. 2015) and the innovations orthogonalisation developed by (Pascual-Marqui, Biscay et al. 2017). Here, we applied these approaches after extracting and filtering the time series before computing PLV and AEC.
fMRI data
To evaluate the EEG-based results, we used fMRI data from 487 participants at rest collected from the human connectome project (HCP) (Van Essen, Smith et al. 2013). In brief, functional connectivity between each of the 68 cortical regions using Desikan-Killiany atlas (Desikan, Ségonne et al. 2006) was assessed by means of analysis of the resting-state fMRI data of the HCP (Q3 release, voxel-size 2 mm isotropic, TR/TE 720/33.1 ms, 1200 volumes, 14:33 minutes). Images were realigned, co-registered with the T1 image, filtered (0.03 - 0.12 Hz), corrected for global effects of motion (realignment parameters), global signal mean, ventricle and white matter signal by means of linear regression and ‘motion-scrubbed’ for potential movement artifacts. Regional time-series were computed by averaging the time-time-series of the voxels in each of the cortical regions, and functional
connectivity between all region pairs was derived by means of correlation analysis. In the case of EEG analysis, a group-averaged weighted functional connectivity (FC) matrix was used by averaging the individual matrices, see (van den Heuvel, Scholtens et al. 2016) for more detailed information.
Statistical comparisons
To statistically assess the difference between the connectivity methods, we thresholded the matrices (M/EEG and fMRI) by keeping the highest 10% connections (Garrison, Scheinost et al. 2015, Kabbara, Falou et al. 2017), results for other threshold values are presented in the supplementary materials. Spearman correlation values with the averaged fMRI were computed for each M/EEG FC method. In order to test differences between correlations of FC methods that keep zero-lag connections and FC methods that remove zero-lag connections, we used a percentile bootstrap approach for non-overlapping correlations (Wilcox 2016), using 500 repetitions. The code is 1 2 3 4 5 6 7 8 9 10 11 12 13 14 15 16 17 18 19 20 21 22 23 24 25 26 27 28 29 30 31 32 33 34 35 36 37 38 39 40 41 42 43 44 45 46 47 48 49 50 51 52 53 54 55 56 57 58 59 60 61 62 63 64
7
available at https://github.com/GRousselet/blog/tree/master/comp2dcorr. Spearman correlation values between EEG connectivity matrices and the averaged fMRI connectivity matrix were calculated for each participant. Mann-Whitney U Test was used to assess the statistical difference between FC methods (p < 0.01/7 for FC methods).Results
EEG vs. fMRI
The EEG FC matrices (averaged over subjects) obtained by each of the FC methods (in beta band) are illustrated in Fig.2. These matrices were reordered according to brain lobes. The red module represents the occipital lobe, the green one represents the temporal brain regions, the blue section represents the parietal lobe, the purple module represents the frontal regions, the orange section represents the central lobe and the last module in grey represents the cingulate regions (details are presented in supplementary materials Table1). The fMRI FC matrix averaged over all participants is also illustrated in Fig.2. The visual investigation of these results revealed that matrices obtained from PLV and AEC connectivity methods were more consistent with the fMRI matrix compared to the other methods after removing zero lag connections. The latter FC methods connections between brain regions were sparser.
1 2 3 4 5 6 7 8 9 10 11 12 13 14 15 16 17 18 19 20 21 22 23 24 25 26 27 28 29 30 31 32 33 34 35 36 37 38 39 40 41 42 43 44 45 46 47 48 49 50 51 52 53 54 55 56 57 58 59 60 61 62 63 64
8
Fig.2 Functional connectivity matrices obtained in beta band from averaged fMRI and EEG networks. Matrices were ordered according to brain lobes (red: Occipital lobe - O, green: Temporal lobe - T, blue: Parietal lobe - P, purple: Frontal lobe - F, orange: Central lobe - C and grey: Cingulate - Cing). PLV: Phase Locking Value, AEC: Amplitude Envelope Correlation, PLI: Phase Lag Index, PLVCol: Phaselocking Value after applying symmetric orthogonalisation technique (Colclough, Brookes et al. 2015), AECCol: Amplitude Envelope Correlation after applying symmetric orthogonalisation technique
(Colclough, Brookes et al. 2015), PLVPas: Phase locking Value after applying the innovations
orthogonalisation (Pascual-Marqui, Biscay et al. 2017) and AECPas: Amplitude Envelope Correlation after
applying the innovations orthogonalisation (Pascual-Marqui, Biscay et al. 2017). 1 2 3 4 5 6 7 8 9 10 11 12 13 14 15 16 17 18 19 20 21 22 23 24 25 26 27 28 29 30 31 32 33 34 35 36 37 38 39 40 41 42 43 44 45 46 47 48 49 50 51 52 53 54 55 56 57 58 59 60 61 62 63 64
9
We then explored the Spearman correlations between the EEG networks (averaged over subjects) obtained from the seven FC methods and the fMRI network at the level of each network connection (edge’s weight), results are presented in Fig.3. Results showed low correlations for all the FC methods, however PLV and AEC networks were significantly correlated with fMRI networks (ρ = 0.11, p = 10-7 and ρ = 0.06, p = 0.007, respectively).However, the networks obtained after using methods with leakage correction (PLI, PLVCol, AECCol, PLVPas and
AECPas) were not significantly correlated with fMRI networks (ρ = 0.02, p = 0.25; ρ = -0.01, p = 0.59; ρ = 0.04,
p = 0.05; ρ = -0.006, p = 0.7 and ρ = 0.05, p = 0.03 respectively). Percentile bootstrap results, presented in Table
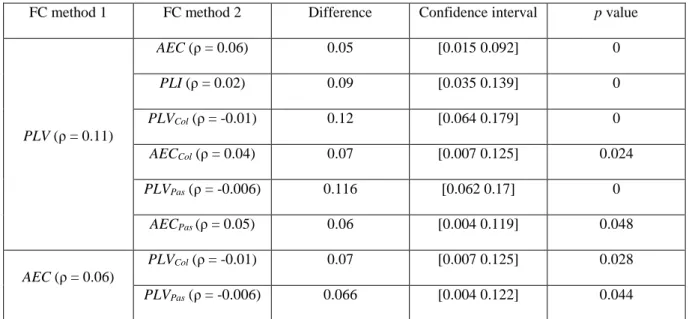
1, showed that PLV network was significantly more correlated with fMRI network compared to all the other methods and that AEC networks were significantly more correlated than PLVCol and PLVPas.
FC method 1 FC method 2 Difference Confidence interval p value
PLV (ρ = 0.11) AEC (ρ = 0.06) 0.05 [0.015 0.092] 0 PLI (ρ = 0.02) 0.09 [0.035 0.139] 0 PLVCol (ρ = -0.01) 0.12 [0.064 0.179] 0 AECCol (ρ = 0.04) 0.07 [0.007 0.125] 0.024 PLVPas (ρ = -0.006) 0.116 [0.062 0.17] 0 AECPas (ρ = 0.05) 0.06 [0.004 0.119] 0.048 AEC (ρ = 0.06) PLVCol (ρ = -0.01) 0.07 [0.007 0.125] 0.028 PLVPas (ρ = -0.006) 0.066 [0.004 0.122] 0.044
Table 1. EEG percentile bootstrap results. ρ difference between FC method 1 and method 2, 95% percentile bootstrap confidence interval and the p values are reported.
1 2 3 4 5 6 7 8 9 10 11 12 13 14 15 16 17 18 19 20 21 22 23 24 25 26 27 28 29 30 31 32 33 34 35 36 37 38 39 40 41 42 43 44 45 46 47 48 49 50 51 52 53 54 55 56 57 58 59 60 61 62 63 64
10
Fig.3 Spearman correlations between the edges’ weights of different EEG connectivity matrices and average fMRI. 1 2 3 4 5 6 7 8 9 10 11 12 13 14 15 16 17 18 19 20 21 22 23 24 25 26 27 28 29 30 31 32 33 34 35 36 37 38 39 40 41 42 43 44 45 46 47 48 49 50 51 52 53 54 55 56 57 58 59 60 61 62 63 6411
To quantitatively assess the differences between FC methods, Spearman correlation coefficients between FC matrices for each participant and the averaged fMRI connectivity matrix were calculated and presented in Fig.4. Results showed significantly higher correlation with fMRI using the PLV and AEC as compared to the other three methods. PLV correlation values were significantly higher than PLI (p = 310-10), PLVCol (p = 4.710-10),
AECCol (p = 2.510-7), PLVPas (p = 4.210-10) and AECPas (p = 4.210-8). AEC correlation values were also higher
than PLI (p = 1.610-6), PLV
Col (p = 7.410-6), AECCol (p = 0.001), PLVPas (p = 1.810-5) and AECPas (p = 0.001).
These results were consistent in the delta, theta, alpha and gamma frequency bands, see figures S1 to S4 in supplementary materials, and after using different thresholds (5%, 20%, 30%, 50% and 80%), see figures S5 to S9 in supplementary materials.
Fig.4 Spearman correlation values between averaged fMRI network and EEG networks in beta band. Individual participant correlations are shown in the scatter plot next to the box plot. ** represents significant differences obtained between methods using Bonferroni correction (p < 0.01/7).
MEG vs. fMRI
In this section, we compute the correlation values between MEG and fMRI networks from the same 44 subjects collected from HCP database. The MEG FC matrices (averaged over subjects) obtained by each of the FC methods (in beta band) are illustrated in Fig.5. Same as EEG, MEG matrices were reordered according to brain lobes. The fMRI FC matrix averaged over the 44 participants is also illustrated in Fig.4. The visual inspection of
these results revealed that matrices obtained from PLV and AEC connectivity methods were more similar with the fMRI matrix compared to the other methods showing sparser connections.
1 2 3 4 5 6 7 8 9 10 11 12 13 14 15 16 17 18 19 20 21 22 23 24 25 26 27 28 29 30 31 32 33 34 35 36 37 38 39 40 41 42 43 44 45 46 47 48 49 50 51 52 53 54 55 56 57 58 59 60 61 62 63 64
12
Fig.5 Functional connectivity matrices obtained in beta band from averaged fMRI and MEG matrices. Matrices were ordered according to brain lobes (red: Occipital lobe - O, green: Temporal lobe - T, blue: Parietal lobe - P, purple: Frontal lobe - F, orange: Central lobe - C and grey: Cingulate - Cing). PLV: Phase Locking Value, AEC: Amplitude Envelope Correlation, PLI: Phase Lag Index, PLVCol: Phaselocking Value after applying symmetric orthogonalisation technique, AECCol: Amplitude Envelope
Correlation after applying symmetric orthogonalisation technique, PLVPas: Phase locking Value after
applying the innovations orthogonalisation and AECPas: Amplitude Envelope Correlation after applying
the innovations orthogonalisation. 1 2 3 4 5 6 7 8 9 10 11 12 13 14 15 16 17 18 19 20 21 22 23 24 25 26 27 28 29 30 31 32 33 34 35 36 37 38 39 40 41 42 43 44 45 46 47 48 49 50 51 52 53 54 55 56 57 58 59 60 61 62 63 64
13
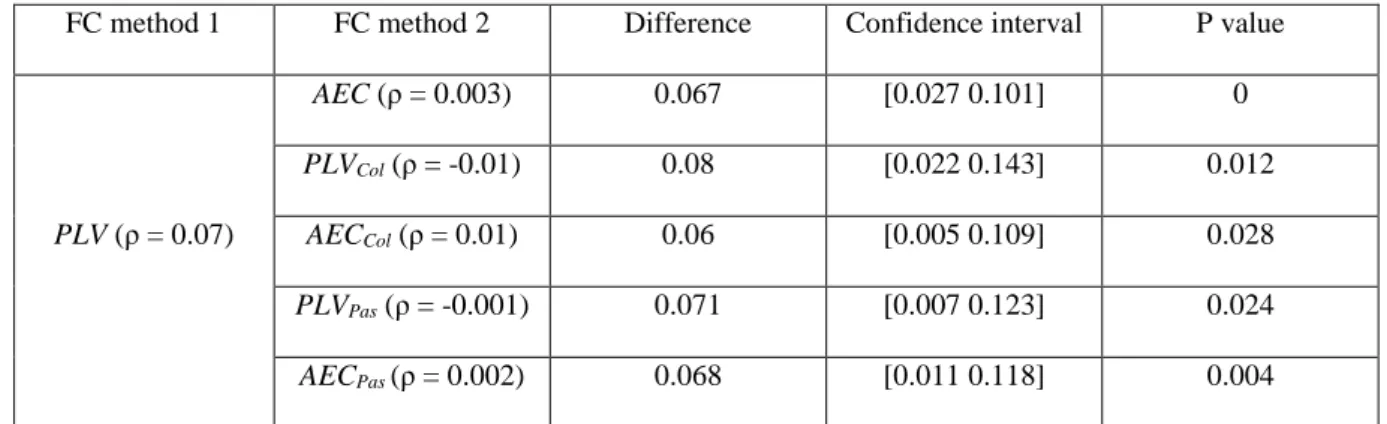
We then explored the Spearman correlations between the MEG networks (averaged over subjects) obtained from the seven FC methods and the fMRI network at the level of each network connection (edge’s weight), Fig.6. Results showed that only PLV networks were significantly (but with very low correlation value) correlated with fMRI networks (ρ = 0.07, p = 0.001). However, all the networks (AEC, PLI, PLVCol, AECCol, PLVPas and AECPas)were not significantly correlated with fMRI networks (ρ = 0.003, p = 0.86; ρ = 0.01, p = 0.56; ρ = -0.01, p = 0.37; ρ = 0.01, p = 0.58; ρ = -0.001, p = 0.95 and ρ = 0.002, p = 0.9 respectively). Percentile bootstrap results, presented in Table 2, showed that only the PLV network was more correlated with fMRI network compared to all the other methods except PLI.
FC method 1 FC method 2 Difference Confidence interval P value
PLV (ρ = 0.07) AEC (ρ = 0.003) 0.067 [0.027 0.101] 0 PLVCol (ρ = -0.01) 0.08 [0.022 0.143] 0.012 AECCol (ρ = 0.01) 0.06 [0.005 0.109] 0.028 PLVPas (ρ = -0.001) 0.071 [0.007 0.123] 0.024 AECPas (ρ = 0.002) 0.068 [0.011 0.118] 0.004
Table 2. MEG percentile bootstrap results. ρ difference between FC method 1 and FC method 2, 95% percentile bootstrap confidence interval and the p value obtained are reported.
1 2 3 4 5 6 7 8 9 10 11 12 13 14 15 16 17 18 19 20 21 22 23 24 25 26 27 28 29 30 31 32 33 34 35 36 37 38 39 40 41 42 43 44 45 46 47 48 49 50 51 52 53 54 55 56 57 58 59 60 61 62 63 64
14
Fig.6 Spearman correlation coefficients between the edges’ weights of different MEG FC methods and fMRI. 1 2 3 4 5 6 7 8 9 10 11 12 13 14 15 16 17 18 19 20 21 22 23 24 25 26 27 28 29 30 31 32 33 34 35 36 37 38 39 40 41 42 43 44 45 46 47 48 49 50 51 52 53 54 55 56 57 58 59 60 61 62 63 6415
Finally, to quantitatively assess the difference between FC methods, Spearman correlation coefficients between FC matrices for each participant and its corresponding fMRI connectivity matrix were calculated and presented in Fig.7. PLV correlation values were significantly higher than PLI (p = 1.610-8), PLVCol (p = 7.710-11) and
PLVPas (p = 3.510-11). AEC correlation values were higher than PLI (p = 7.510-9), PLVCol (p = 8.210-11),
PLVPas (p = 8.210-11) and AECPas (p = 0.0003). Moreover, correlation values of networks obtained after
applying AEC method combined with symmetric orthogonalisation techniques (AECCol) were significantly higher
than correlation values of networks obtained after applying PLV method combined with orthogonalisation techniques (PLVCol (p = 4.710-6) and PLVPas (p = 6.910-6) respectively). Also, correlation values of networks
obtained after applying AEC method combined with symmetric orthogonalisation techniques (AECPas) were
significantly higher than correlation values of networks obtained after applying PLV method combined with orthogonalisation techniques (PLVCol (p = 6.910-6) and PLVPas (p = 3.310-5) respectively). No statistical
difference was found for the other methods.
Fig.7 Spearman correlation values between the corresponding fMRI network and MEG network in beta band for each participant. Individual participant correlations are shown in the scatter plot next to the box plot. ** represents significant differences obtained between methods using Bonferroni correction (p < 0.01/7). 1 2 3 4 5 6 7 8 9 10 11 12 13 14 15 16 17 18 19 20 21 22 23 24 25 26 27 28 29 30 31 32 33 34 35 36 37 38 39 40 41 42 43 44 45 46 47 48 49 50 51 52 53 54 55 56 57 58 59 60 61 62 63 64
16
Discussion
While a large number of FC methods are available, their reliability and consistency are still under exploration. Also, the effect of leakage correction on M/EEG source-space networks by removing zero lag connections is not sufficiently studied. This paper (and some other recent papers such as (Colclough, Woolrich et al. 2016)) is a step toward this exploration in which we decided to compare the M/EEG FC matrices to those obtained using fMRI (HCP database). Our results showed mainly low correlations for all the FC methods. Slightly higher correlation values between EEG and fMRI resting state networks were found in other study (Liu, Ganzetti et al. 2018). Despite this low correlation, our results showed that FC matrices estimated using methods that keep the zero-lag correlations (PLV and AEC) were significantly correlated with the fMRI matrices as compared to the other methods.
The non-significance between PLI, PLVCol, AECCol, PLVPas and AECPas with fMRI network can be explained by
the fact that not all zero-lag connections are spurious. Several previous study described the presence and potential mechanisms for zero-lag connectivity (Roelfsema, Engel et al. 1997, Gollo, Mirasso et al. 2014). Recent study showed that removing zero lag connections may indeed reveal false and significantly different estimated connectivity from the true connectivity (Palva, Wang et al. 2018). Another study reported that PLV showed the best matching between simulations and empirical data and that zero-lag correlation are very crucial to assess the structural/functional relationships (Finger, Bonstrup et al. 2016). We validated these observations using MEG and fMRI recordings from the same subjects (44 participants). Similar results were obtained as EEG
study, PLV averaged matrix was significantly more correlated with fMRI averaged matrix than all the other connectivity methods. However, no significant differences were found between PLV, AEC, AECCol and AECPas at
the single-subject level.
Methodological considerations
First, in this study the fMRI connectivity matrices were used, to some extent, as a ’reference’ in order to evaluate the results of each of the FC connectivity measures applied to EEG regional time series. However, the EEG and fMRI data were not collected from the same participants. To that end, we used an averaged matrix over a large number of healthy participants (N=487). We are aware about this limitation and that the ideal situation is to have EEG and fMRI recordings for the same subjects. To that end, we conducted the same study on MEG data collected from HCP in which MEG and fMRI recordings are available for the same subjects. Clearly, fMRI matrices cannot be considered a ‘ground truth’ as preprocessing and analysis choices can produce different 1 2 3 4 5 6 7 8 9 10 11 12 13 14 15 16 17 18 19 20 21 22 23 24 25 26 27 28 29 30 31 32 33 34 35 36 37 38 39 40 41 42 43 44 45 46 47 48 49 50 51 52 53 54 55 56 57 58 59 60 61 62 63 64
17
results (Carp 2012). Nevertheless, results showed some differences between the FC methods in term of correlations between M/EEG and fMRI.Second, the connectivity matrices were thresholded by keeping only the highest 10% connectivity values. This proportional-based threshold was used to standardize the comparison between the FC methods and fMRI matrices, as network measures are stable across proportional thresholds, as opposed to absolute thresholds (Garrison, Scheinost et al. 2015). We are aware about the effect of this threshold and we have tested other thresholds and the results are very consistent over different threshold values (see figures S5 to S9 in supplementary materials). Another parameter that was investigated here is the correlation between FC connectivity and the power spectra of the signals at given frequency bands. Results (reported in fig. S10 and S11) showed different pattern of correlation between connectivity and power. This issue was recently investigated in details by Demuru et al. (Demuru 2020).
Third, it was shown that fMRI and M/EEG connectivity decreases with anatomical distance. For instance, Mehrkanoon et al (2014) used a seed-based approach to evaluate FC matrices on EEG source-space signals and showed that that coupling between homologous sensory areas was significantly higher than with other voxels at the same physical distance. This makes difficult the interpretation of our results without considering the effects of anatomical distance. In this regard, we added a correlation analysis between the fMRI, EEG and MEG matrices (for the different methods) with the distance. The results (figure S12 and S13 in supplementary materials) showed that some of the methods were negatively correlated with the distance while others were not. We believe that more investigation of the effect of the anatomical distance when dealing with the functional connectivity methods are still needed. In addition, we didn’t observe any significant association between the correlation values (at two given brain regions) and the Euclidean distance between these two regions (see figure S13 and S14).
Fourth, a key issue here is the nature of the comparison between M/EEG and fMRI. Our results showed mainly i) low correlation between M/EEG and fMRI FC matrices and ii) some differences between FC matrices. The correlation between EEG and fMRI has been reported in several studies. Previous findings showed mainly different level of correlation at all frequency bands. First, it was shown that low-frequency fluctuations of the band-limited power of LFPs, recorded from cortical electrodes in the awake monkey, fluctuates approximately at the same frequency as the BOLD signal. In humans, several studies have reported significant correlations between alpha and beta power in the EEG, and simultaneously recorded BOLD signal fluctuations within 1 2 3 4 5 6 7 8 9 10 11 12 13 14 15 16 17 18 19 20 21 22 23 24 25 26 27 28 29 30 31 32 33 34 35 36 37 38 39 40 41 42 43 44 45 46 47 48 49 50 51 52 53 54 55 56 57 58 59 60 61 62 63 64
18
specific brain networks. In addition, Mantini et al. (Mantini et al. 2007) showed a correlation between EEG frequency bands and the fMRI resting state networks. Each functional network was characterized by a specific electrophysiological signature that involved the combination of different brain rhythms. Our investigation of the correlation at the global level (without dividing to sub RSNs), can explain the implications of all the frequency bands. Nevertheless, we believe that more investigations to the nature of the relationships between M/EEG and fMRI are needed at different levels (node and module wise or at the RSNs level for instance).Finally, a possible explanation of our observations, that removing zero-lag may reduce the correlation between M/EEG with fMRI, can be related to the importance of keeping the zero-lag connections. By assuming that fMRI-based networks must have, to some extent, a good spatial precision of the identified short and long connections (with not contamination by the spatial leakage problem), removing zero-lag connections will consequently increase the differences between the M/EEG and the fMRI networks. The presence and the importance of real zero-lag long-range FC are supported empirically and theoretically (Viriyopaseet al., 2012) (Finger et al., 2016). For more information and a comprehensive view of the topic of the relationships between M/EEG and fMRI signals, readers can refer to the recent review by Sadaghiani et al. (Sadaghiani et al. 2019).
Conclusion
M/EEG source connectivity is a unique tool to identify high resolution functional brain networks in time and space. However, results depend on the choice of processing methods. In this paper, we analyzed the impact of the method used to measure the functional connectivity on the correlation between M/EEG and fMRI. In addition to the overall low correlations between M/EEG and fMRI networks, our results showed that among the different connectivity measures, PLV and AEC provided closer results to fMRI network compared to the three other methods that removes the zero-lag connections. We believe that more comparative studies based on simulation and real data and at different levels (node, module or sub networks) are still needed in order to improve our understanding on the relationships between M/EEG source-space networks and fMRI networks at rest. This will indeed help in making M/EEG source connectivity a mature technique to address questions in cognitive and clinical neuroscience.
Acknowledgements
This study was supported by the Future Emerging Technologies (H2020-FETOPEN-2014-2015-RIA under agreement No. 686764) as part of the European Union’s Horizon 2020 research and training program 2014– 2018. This work has received a French government support granted to the CominLabs excellence laboratory and 1 2 3 4 5 6 7 8 9 10 11 12 13 14 15 16 17 18 19 20 21 22 23 24 25 26 27 28 29 30 31 32 33 34 35 36 37 38 39 40 41 42 43 44 45 46 47 48 49 50 51 52 53 54 55 56 57 58 59 60 61 62 63 64
19
managed by the National Research Agency in the “Investing for the Future” program under reference ANR-10-LABX-07-01. This work was also financed by the AZM and SAADE Association, Tripoli, Lebanon and by the National Council for Scientific Research (CNRS) in Lebanon. Authors would like to thank Campus France, Programme Hubert Curien CEDRE (PROJET N° 42257YA), for supporting this study. HCP data was provided by the Human Connectome Project, WU-Minn Consortium (Principal Investigators: David Van Essen and Kamil Ugurbil; 1U54MH091657) funded by the 16 NIH Institutes and Centers that support the NIH Blueprint for Neuroscience Research; and by the McDonnell Center for Systems Neuroscience at Washington University. Authors would like to thank Olivier Dufor for collecting the EEG data and Martijn Van Den Heuvel for providing the fMRI connectivity matrices from the human connectome project.Conflict of Interest: The authors declare that they have no conflict of interest.
References
Bastos, A. M. and J.-M. Schoffelen (2016). "A tutorial review of functional connectivity analysis methods and their interpretational pitfalls." Frontiers in systems neuroscience 9: 175.
Brookes, M. J., A. M. Gibson, S. D. Hall, P. L. Furlong, G. R. Barnes, A. Hillebrand, K. D. Singh, I. E. Holliday, S. T. Francis and P. G. Morris (2004). "A general linear model for MEG beamformer imaging." NeuroImage 23(3): 936-946.
Brookes, M. J., M. Woolrich, H. Luckhoo, D. Price, J. R. Hale, M. C. Stephenson, G. R. Barnes, S. M. Smith and P. G. Morris (2011). "Investigating the electrophysiological basis of resting state networks using magnetoencephalography." Proceedings of the National Academy of Sciences: 201112685.
Brookes, M. J., M. W. Woolrich and G. R. Barnes (2012). "Measuring functional connectivity in MEG: a multivariate approach insensitive to linear source leakage." Neuroimage 63(2): 910-920.
Carp, J. (2012). "On the plurality of (methodological) worlds: estimating the analytic flexibility of fMRI experiments." Frontiers in neuroscience 6: 149.
Chu, C. J., M. A. Kramer, J. Pathmanathan, M. T. Bianchi, M. B. Westover, L. Wizon and S. S. Cash (2012). "Emergence of stable functional networks in long-term human electroencephalography." Journal of Neuroscience 32(8): 2703-2713.
Colclough, G. L., M. J. Brookes, S. M. Smith and M. W. Woolrich (2015). "A symmetric multivariate leakage correction for MEG connectomes." NeuroImage 117: 439-448.
Colclough, G. L., M. W. Woolrich, P. Tewarie, M. J. Brookes, A. J. Quinn and S. M. Smith (2016). "How reliable are MEG resting-state connectivity metrics?" Neuroimage 138: 284-293.
de Pasquale, F., S. Della Penna, A. Z. Snyder, L. Marzetti, V. Pizzella, G. L. Romani and M. Corbetta (2012). "A cortical core for dynamic integration of functional networks in the resting human brain." Neuron 74(4): 753-764. De Vico Fallani, F., J. Richiardi, M. Chavez and S. Achard (2014). "Graph analysis of functional brain networks: practical issues in translational neuroscience." Philosophical Transactions of the Royal Society B: Biological Sciences 369(1653): 20130521.
Matteo Demuru, Simone Maurizio La Cava, Sara Maria Pani, Matteo Fraschini (2020), “A comparison between power spectral density and network metrics: An EEG study”. Biomedical Signal Processing and Control. 57, March 2020, 101760
Desikan, R. S., F. Ségonne, B. Fischl, B. T. Quinn, B. C. Dickerson, D. Blacker, R. L. Buckner, A. M. Dale, R. P. Maguire and B. T. Hyman (2006). "An automated labeling system for subdividing the human cerebral cortex on MRI scans into gyral based regions of interest." Neuroimage 31(3): 968-980.
Finger, H., M. Bonstrup, B. Cheng, A. Messe, C. Hilgetag, G. Thomalla, C. Gerloff and P. Konig (2016). "Modeling of Large-Scale Functional Brain Networks Based on Structural Connectivity from DTI: Comparison with EEG Derived Phase Coupling Networks and Evaluation of Alternative Methods along the Modeling Path." PLoS Comput Biol 12(8): e1005025.
Fraschini, M., M. Demuru, A. Crobe, F. Marrosu, C. J. Stam and A. Hillebrand (2016). "The effect of epoch length on estimated EEG functional connectivity and brain network organisation." Journal of neural engineering 13(3): 036015. 1 2 3 4 5 6 7 8 9 10 11 12 13 14 15 16 17 18 19 20 21 22 23 24 25 26 27 28 29 30 31 32 33 34 35 36 37 38 39 40 41 42 43 44 45 46 47 48 49 50 51 52 53 54 55 56 57 58 59 60 61 62 63 64
20
Garrison, K. A., D. Scheinost, E. S. Finn, X. Shen and R. T. Constable (2015). "The (in) stability of functional brain network measures across thresholds." Neuroimage 118: 651-661.Gollo, L. L., C. Mirasso, O. Sporns and M. Breakspear (2014). "Mechanisms of zero-lag synchronization in cortical motifs." PLoS computational biology 10(4): e1003548.
Gramfort, A., M. Kowalski and M. Hämäläinen (2012). "Mixed-norm estimates for the M/EEG inverse problem using accelerated gradient methods." Physics in Medicine & Biology 57(7): 1937.
Gramfort, A., E. Olivi, M. Clerc and T. Papadopoulo (2010). "OpenMEEG: opensource software for quasistatic bioelectromagnetics." Biomedical engineering online 9(1): 45.
Hardmeier, M., F. Hatz, H. Bousleiman, C. Schindler, C. J. Stam and P. Fuhr (2014). "Reproducibility of functional connectivity and graph measures based on the phase lag index (PLI) and weighted phase lag index (wPLI) derived from high resolution EEG." PloS one 9(10): e108648.
Hassan, M., P. Benquet, A. Biraben, C. Berrou, O. Dufor and F. Wendling (2015). "Dynamic reorganization of functional brain networks during picture naming." Cortex 73: 276-288.
Hassan, M., O. Dufor, I. Merlet, C. Berrou and F. Wendling (2014). "EEG source connectivity analysis: from dense array recordings to brain networks." PloS one 9(8): e105041.
Hassan, M., I. Merlet, A. Mheich, A. Kabbara, A. Biraben, A. Nica and F. Wendling (2016). "Identification of interictal epileptic networks from dense-EEG." Brain Topography: 1-17.
Hassan, M. and F. Wendling (2018). "Electroencephalography Source Connectivity: Aiming for High Resolution of Brain Networks in Time and Space." IEEE Signal Processing Magazine 35(3): 81-96.
Hauk, O. (2004). "Keep it simple: a case for using classical minimum norm estimation in the analysis of EEG and MEG data." Neuroimage 21(4): 1612-1621.
Hipp, J. F., D. J. Hawellek, M. Corbetta, M. Siegel and A. K. Engel (2012). "Large-scale cortical correlation structure of spontaneous oscillatory activity." Nature neuroscience 15(6): 884.
Holmes, C. J., R. Hoge, L. Collins, R. Woods, A. W. Toga and A. C. Evans (1998). "Enhancement of MR images using registration for signal averaging." Journal of computer assisted tomography 22(2): 324-333. Kabbara, A., W. E. Falou, M. Khalil, F. Wendling and M. Hassan (2017). "The dynamic functional core network of the human brain at rest." Scientific Reports 7.
Lachaux, J.-P., E. Rodriguez, M. Le Van Quyen, A. Lutz, J. Martinerie and F. J. Varela (2000). "Studying single-trials of phase synchronous activity in the brain." International Journal of Bifurcation and Chaos 10(10): 2429-2439.
Lachaux, J.-P., E. Rodriguez, J. Martinerie and F. J. Varela (1999). "Measuring phase synchrony in brain signals." Human brain mapping 8(4): 194-208.
Liu, Q., M. Ganzetti, N. Wenderoth and D. Mantini (2018). "Detecting large-scale brain networks using EEG: impact of electrode density, head modeling and source localization." Frontiers in neuroinformatics 12: 4.
Liuzzi, L., L. E. Gascoyne, P. K. Tewarie, E. L. Barratt, E. Boto and M. J. Brookes (2017). "Optimising experimental design for MEG resting state functional connectivity measurement." Neuroimage 155: 565-576. Mahjoory, K., V. V. Nikulin, L. Botrel, K. Linkenkaer-Hansen, M. M. Fato and S. Haufe (2017). "Consistency of EEG source localization and connectivity estimates." Neuroimage 152: 590-601.
Maldjian, J. A., E. M. Davenport and C. T. Whitlow (2014). "Graph theoretical analysis of resting-state MEG data: Identifying interhemispheric connectivity and the default mode." Neuroimage 96: 88-94.
D. Mantini, M. G. Perrucci, C. Del Gratta, G. L. Romani, and M. Corbetta (2007), “Electrophysiological signatures of resting state networks in the human brain”, PNAS, 104 (32) 13170-13175;
Mehrkanoon S., Breakspear M., Britz J., Boonstra T. W. (2014), "Intrinsic Coupling Modes in Source-Reconstructed Electroencephalography", Brain connectivity 4, 10.
Nolte, G., O. Bai, L. Wheaton, Z. Mari, S. Vorbach and M. Hallett (2004). "Identifying true brain interaction from EEG data using the imaginary part of coherency." Clinical neurophysiology 115(10): 2292-2307.
O'Neill, G. C., P. Tewarie, D. Vidaurre, L. Liuzzi, M. W. Woolrich and M. J. Brookes (2018). "Dynamics of large-scale electrophysiological networks: a technical review." Neuroimage 180: 559-576.
Palva, J. M., S. H. Wang, S. Palva, A. Zhigalov, S. Monto, M. J. Brookes, J.-M. Schoffelen and K. Jerbi (2018). "Ghost interactions in MEG/EEG source space: A note of caution on inter-areal coupling measures." Neuroimage 173: 632-643.
Palva, S. and J. M. Palva (2012). "Discovering oscillatory interaction networks with M/EEG: challenges and breakthroughs." Trends in cognitive sciences 16(4): 219-230.
Pascual-Marqui, R. D., R. J. Biscay, J. Bosch-Bayard, P. Faber, T. Kinoshita, K. Kochi, P. Milz, K. Nishida and M. Yoshimura (2017). "Innovations orthogonalization: a solution to the major pitfalls of EEG/MEG" leakage correction"." arXiv preprint arXiv:1708.05931.
Rizkallah, J., P. Benquet, A. Kabbara, O. Dufor, F. Wendling and M. Hassan (2018). "Dynamic reshaping of functional brain networks during visual object recognition." Journal of neural engineering 15(5): 056022. Roelfsema, P. R., A. K. Engel, P. König and W. Singer (1997). "Visuomotor integration is associated with zero time-lag synchronization among cortical areas." Nature 385(6612): 157.
1 2 3 4 5 6 7 8 9 10 11 12 13 14 15 16 17 18 19 20 21 22 23 24 25 26 27 28 29 30 31 32 33 34 35 36 37 38 39 40 41 42 43 44 45 46 47 48 49 50 51 52 53 54 55 56 57 58 59 60 61 62 63 64
21
Sadaghiani, S., Wirsich, J. (2019). "Intrinsic connectome organization across temporal scales: New insights from cross-modal approaches. " Network Neuroscience. Advance publication. https://doi.org/10.1162/netn_a_00114. Sakkalis, V. (2011). "Review of advanced techniques for the estimation of brain connectivity measured with EEG/MEG." Computers in biology and medicine 41(12): 1110-1117.Schoffelen, J. M. and J. Gross (2009). "Source connectivity analysis with MEG and EEG." Human brain mapping 30(6): 1857-1865.
Stam, C. J., G. Nolte and A. Daffertshofer (2007). "Phase lag index: assessment of functional connectivity from multi channel EEG and MEG with diminished bias from common sources." Human brain mapping 28(11): 1178-1193.
Tadel, F., S. Baillet, J. C. Mosher, D. Pantazis and R. M. Leahy (2011). "Brainstorm: a user-friendly application for MEG/EEG analysis." Computational intelligence and neuroscience 2011: 8.
van den Heuvel, M. P., L. H. Scholtens, M. A. de Reus and R. S. Kahn (2016). "Associated microscale spine density and macroscale connectivity disruptions in schizophrenia." Biological psychiatry 80(4): 293-301. Van Essen, D. C., S. M. Smith, D. M. Barch, T. E. Behrens, E. Yacoub, K. Ugurbil and W.-M. H. Consortium (2013). "The WU-Minn human connectome project: an overview." Neuroimage 80: 62-79.
Viriyopase, A., Bojak, I., Zeitler, M.,v Gielen, S. (2012). When Long-Range Zero-Lag Synchronization is Feasible in Cortical Networks. Frontiers in Computational Neuroscience, 6. https://doi.org/10.3389/fncom.2012.00049
Wang, S. H., M. Lobier, F. Siebenhühner, T. Puoliväli, S. Palva and J. M. Palva (2018). "Hyperedge bundling: A practical solution to spurious interactions in MEG/EEG source connectivity analyses." NeuroImage 173: 610-622.
Wilcox, R. R. (2016). "Comparing dependent robust correlations." British Journal of Mathematical and Statistical Psychology 69(3): 215-224. 1 2 3 4 5 6 7 8 9 10 11 12 13 14 15 16 17 18 19 20 21 22 23 24 25 26 27 28 29 30 31 32 33 34 35 36 37 38 39 40 41 42 43 44 45 46 47 48 49 50 51 52 53 54 55 56 57 58 59 60 61 62 63 64
Supplementary Material