HAL Id: hal-01101387
https://hal.archives-ouvertes.fr/hal-01101387
Preprint submitted on 12 Jan 2015
HAL is a multi-disciplinary open access archive for the deposit and dissemination of sci-entific research documents, whether they are pub-lished or not. The documents may come from teaching and research institutions in France or
L’archive ouverte pluridisciplinaire HAL, est destinée au dépôt et à la diffusion de documents scientifiques de niveau recherche, publiés ou non, émanant des établissements d’enseignement et de recherche français ou étrangers, des laboratoires
Physical modeling of triple near-Earth asteroid (153591)
2001 SN 263 from radar and optical light curve
observations
Tracy Becker„ Ellen S. Howell, Michael, C. Nolan„ Christopher Magri, Petr
Pravec, Patrick A. Taylor„ Julian Oey, David Higgins, Jozef Világi, Leonard
Kornoš, et al.
To cite this version:
Tracy Becker„ Ellen S. Howell, Michael, C. Nolan„ Christopher Magri, Petr Pravec, et al.. Physi-cal modeling of triple near-Earth asteroid (153591) 2001 SN 263 from radar and optiPhysi-cal light curve observations. 2014. �hal-01101387�
Physical modeling of triple near-Earth asteroid (153591)
2001 SN
263from radar and optical light curve observations
Tracy M. Beckera, Ellen S. Howellb, Michael C. Nolanb, Christopher Magric, Petr Pravecd, Patrick A. Taylorb, Julian Oeye, David Higginsf, Jozef Vil´agig, Leonard Kornoˇsg, Adri´an Gal´adg, ˇStefan Gajdoˇsg, Ninel M. Gaftonyukh, Yurij N. Kruglyi, Igor E. Molotovk, Michael D. Hicksj, Albino
Carbognanil, Brian D. Warnerm, Frederic Vachiern, Franck Marchiso, Joseph T. Pollockp
aUniversity of Central Florida, 4000 Central Florida Blvd. Orlando, FL 32816, USA bArecibo Observatory, National Astronomy and Ionosphere Center, HC3 Box 53995,
Arecibo, PR 00612, USA
cUniversity of Maine at Farmington, 173 High Street-Preble Hall, Farmington, ME
04938, USA
dAstronomical Institute, Academy of Sciences of the Czech Republic, CZ-25165
Ond´rejov, Czech Republic
eLeura Observatory, 94 Rawson Pde., Leura, NSW, Australia
fHunters Hill Observatory, 7 Mawalan Street, Ngunnawal, ACT 2913 Australia gModra Observatory, Department of Astronomy, Physics of the Earth, and Meteoology,
FMFI UK, Bratislava SK-84248, Slovakia
hCrimean Astrophysical Observatory, Simeiz Department, Simeiz 98680, Crimea,
Ukraine
iInstitute of Astronomy of Kharkiv National University, Sumska Str. 35, Kharkiv 61022,
Ukraine
jJet Propulsion Laboratory, California Institute of Technology, 4800 Oak Grove Drive,
La Canada Flintridge, CA 91011, USA
kKeldysh Institute of Applied Mathematics, RAS, Miusskaya Sq. 4, Moscow 125047,
Russia
lAstronomical Observatory of the Autonomous Region of the Aosta Valley (OAVdA),
Saint-Barthlemy Loc. Lignan, 39, 11020 Nus, Aosta, Italy
mCenter for Solar System Studies, 446 Sycamore Ave. Eaton, CO 80615, USA nObservatoire de Paris, CNRS UMR8028, Sorbonne Universities, UPMC Univ. Paris
06, IMCEE, 77 Avenue Denfert Rochereau, 75014 Paris, France
oSETI Institute, Carl Sagan Center, 189 Bernardo Ave., Mountain View, CA 94043,
USA
pDepartment of Physics and Astronomy, Appalachian State University, Box 32106
Boone, NC 28608, USA
Abstract
We report radar observations (2380-MHz, 13-cm) by the Arecibo Obser-vatory and optical light curves observed from eight different observatories and collected at the Ond´rejov Observatory of the triple near-Earth asteroid system (153591) 2001 SN263. The radar observations were obtained over the course of ten nights spanning February 12 - 26, 2008 and the light curve ob-servations were made throughout January 12 - March 31, 2008. Both data sets include observations during the object’s close approach of 0.06558 AU on February 20th, 2008. The delay-Doppler images revealed the asteroid to be comprised of three components, making it the first known triple near-Earth asteroid. Only one other object, (136617) 1994 CC is a confirmed triple near-Earth asteroid.
We present physical models of the three components of the asteroid sys-tem. We constrain the primary’s pole direction to an ecliptic longitude and latitude of (309◦, −80◦) ± 15◦. We find that the primary rotates with a period 3.4256 ± 0.0002 hours and that the larger satellite has a rotation period of 13.43 ± 0.01 hours, considerably shorter than its orbital period of approximately 6 days. We find that the rotational period of the smaller satellite is consistent with a tidally locked state and therefore rotates with a period of 0.686 ± 0.002 days (Fang et al., Astron. J. 141, 154-168, 2011). The primary, the larger satellite, and the smaller satellite have equivalent diameters of 2.5±0.3 km, 0.8±0.1 km, 0.4±0.1 km and densities of 1.1±0.2 g/cm3, 1.0 ± 0.4 g/cm3, 2.3 ± 1.2 g/cm3, respectively.
Keywords:
asteroid, NEA, binary, ternary, shape modeling,
1. Introduction
Asteroid (153591) 2001 SN263 was discovered on September 20, 2001 by the LINEAR survey (Stokes et al., 2000). On February 12, 2008, radar ob-servations conducted at the Arecibo Observatory revealed the asteroid to be comprised of three components, making it the first known triple near-Earth asteroid (NEA) system. Of the 49 observed binary near-Earth asteroids, only one other NEA, (136617) 1994 CC, has since been confirmed as a triple (Brozovi´c et al., 2011). We obtained delay-Doppler images from the Arecibo Observatory that cover 10 nights during February 12 - 26, 2008, (Table 1) and light curve data collected at the Ond´rejov Observatory from eight dif-ferent observatories spanning January 12 - March 31, 2008 (Table 2). The closest approach of the asteroid during this encounter occurred on February 20, 2008 at a distance of 0.06558 AU.
2001 SN263 is comprised of a large primary and two smaller satellites. The smaller inner satellite has a semimajor axis of 3.804 ± 0.002 km, or approximately 3 primary radii, and an orbital period of 0.686 ± 0.002 days. The larger, outer satellite orbits the primary in 6.2 ± 0.1 days, with a semi-major axis of 16.6 ± 0.2 km, approximately 13 primary radii (Fang et al., 2011). Both objects display low eccentricities of 0.016±0.002 (inner, smaller) and 0.015 ± 0.009 (outer, larger) and orbit close to the equatorial plane of the primary. Calculations by Fang et al. (2011) determined the masses of the smaller and larger satellites to be approximately 1% and 2.6% of the primary’s mass, respectively. Spectroscopic observations indicate that the asteroid is B-type asteroid in the Bus-DeMeo taxonomic class (DeMeo, et al. 2009).
We present physical shape models of the three components of the triple asteroid system 2001 SN263 derived from radar images and light curve rel-ative photometry processed in our shape-reconstruction software. We refer to the primary asteroid of 2001 SN263 as Alpha, the outer, larger satellite as Beta, and the inner, smaller satellite as Gamma, following Fang et al. (2011). In Section 2 we discuss the observations and the data reduction. In Section 3 we describe the modeling method and in Sections 3.3 and 3.4 we show the results of the physical models for the primary asteroid and its two satellites. In Section 4 we discuss the implications of the triple asteroid system for constraining dynamical formation and evolution models of bi-nary asteroids. Finally, in Section 5 we summarize our findings, placing this system in context with the NEA population. We place constraints on the rotation period, pole direction, and physical properties of each component and derive the density for the primary asteroid and its two satellites.
2. Observations and Data Reduction
2.1. Delay-Doppler Images
Observations of 2001 SN263 were made at the Arecibo Observatory on ten nights spanning February 12-26, 2008. Details of the observations are listed in Table 1. The delay-Doppler images were obtained by transmitting a circularly polarized monochromatic signal at 2380 MHz (12.6 cm) for ap-proximately the round-trip time to the asteroid and then receiving the signal in both the opposite and same circular polarizations. Delay-Doppler images display range in one dimension and line-of-sight velocity in the other. In the
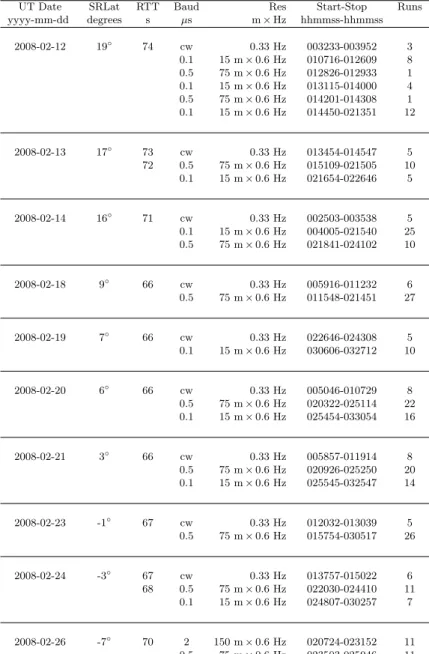
Table 1: Radar Observations of 2001 SN263
UT Date SRLat RTT Baud Res Start-Stop Runs yyyy-mm-dd degrees s µs m × Hz hhmmss-hhmmss 2008-02-12 19◦ 74 cw 0.33 Hz 003233-003952 3 0.1 15 m × 0.6 Hz 010716-012609 8 0.5 75 m × 0.6 Hz 012826-012933 1 0.1 15 m × 0.6 Hz 013115-014000 4 0.5 75 m × 0.6 Hz 014201-014308 1 0.1 15 m × 0.6 Hz 014450-021351 12 2008-02-13 17◦ 73 cw 0.33 Hz 013454-014547 5 72 0.5 75 m × 0.6 Hz 015109-021505 10 0.1 15 m × 0.6 Hz 021654-022646 5 2008-02-14 16◦ 71 cw 0.33 Hz 002503-003538 5 0.1 15 m × 0.6 Hz 004005-021540 25 0.5 75 m × 0.6 Hz 021841-024102 10 2008-02-18 9◦ 66 cw 0.33 Hz 005916-011232 6 0.5 75 m × 0.6 Hz 011548-021451 27 2008-02-19 7◦ 66 cw 0.33 Hz 022646-024308 5 0.1 15 m × 0.6 Hz 030606-032712 10 2008-02-20 6◦ 66 cw 0.33 Hz 005046-010729 8 0.5 75 m × 0.6 Hz 020322-025114 22 0.1 15 m × 0.6 Hz 025454-033054 16 2008-02-21 3◦ 66 cw 0.33 Hz 005857-011914 8 0.5 75 m × 0.6 Hz 020926-025250 20 0.1 15 m × 0.6 Hz 025545-032547 14 2008-02-23 -1◦ 67 cw 0.33 Hz 012032-013039 5 0.5 75 m × 0.6 Hz 015754-030517 26 2008-02-24 -3◦ 67 cw 0.33 Hz 013757-015022 6 68 0.5 75 m × 0.6 Hz 022030-024410 11 0.1 15 m × 0.6 Hz 024807-030257 7 2008-02-26 -7◦ 70 2 150 m × 0.6 Hz 020724-023152 11 0.5 75 m × 0.6 Hz 023503-025946 11
UT Date is the universal time date observations began. SRLat is the sub-radar latitude on the body directly illuminated by the radar; here the rotation pole of Alpha is assumed to be (309◦, -80◦), see Section 3.3.2. RTT is the round-trip light-time to the target, which
when divided by 1000 gives the distance to the target in AU. Baud is the delay resolution of the pseudo-random code used for imaging, where 0.1 µs of time translates to 15 m in range. Res is the range (delay) and frequency (Doppler) resolution of the processed data. The timespans of the received data are listed by their UT start and stop times. Runs is the number of completed transmit-receive cycles. Note that only the images that were
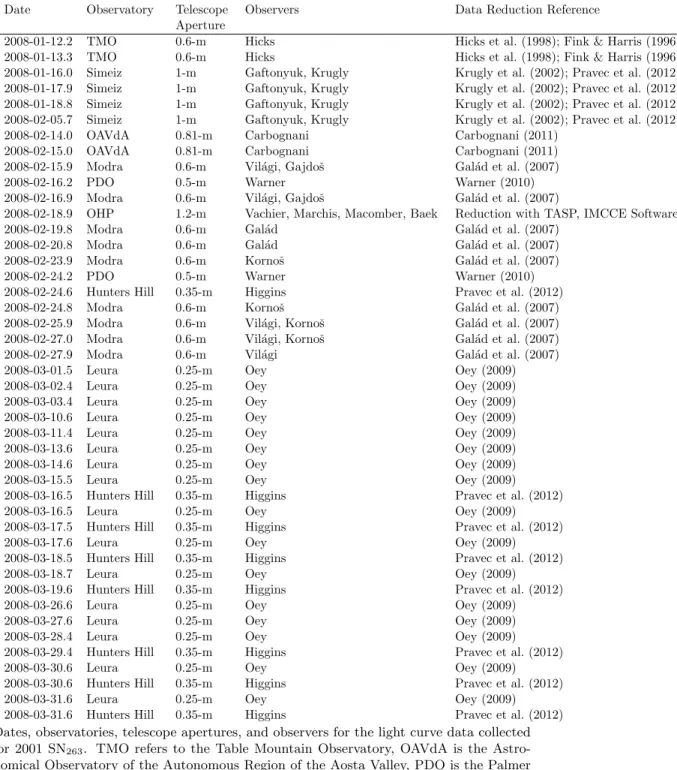
Table 2: Photometric Observations of 2001 SN263
Date Observatory Telescope Aperture
Observers Data Reduction Reference
2008-01-12.2 TMO 0.6-m Hicks Hicks et al. (1998); Fink & Harris (1996) 2008-01-13.3 TMO 0.6-m Hicks Hicks et al. (1998); Fink & Harris (1996) 2008-01-16.0 Simeiz 1-m Gaftonyuk, Krugly Krugly et al. (2002); Pravec et al. (2012) 2008-01-17.9 Simeiz 1-m Gaftonyuk, Krugly Krugly et al. (2002); Pravec et al. (2012) 2008-01-18.8 Simeiz 1-m Gaftonyuk, Krugly Krugly et al. (2002); Pravec et al. (2012) 2008-02-05.7 Simeiz 1-m Gaftonyuk, Krugly Krugly et al. (2002); Pravec et al. (2012) 2008-02-14.0 OAVdA 0.81-m Carbognani Carbognani (2011)
2008-02-15.0 OAVdA 0.81-m Carbognani Carbognani (2011) 2008-02-15.9 Modra 0.6-m Vil´agi, Gajdoˇs Gal´ad et al. (2007) 2008-02-16.2 PDO 0.5-m Warner Warner (2010) 2008-02-16.9 Modra 0.6-m Vil´agi, Gajdoˇs Gal´ad et al. (2007)
2008-02-18.9 OHP 1.2-m Vachier, Marchis, Macomber, Baek Reduction with TASP, IMCCE Software. 2008-02-19.8 Modra 0.6-m Gal´ad Gal´ad et al. (2007)
2008-02-20.8 Modra 0.6-m Gal´ad Gal´ad et al. (2007) 2008-02-23.9 Modra 0.6-m Kornoˇs Gal´ad et al. (2007) 2008-02-24.2 PDO 0.5-m Warner Warner (2010) 2008-02-24.6 Hunters Hill 0.35-m Higgins Pravec et al. (2012) 2008-02-24.8 Modra 0.6-m Kornoˇs Gal´ad et al. (2007) 2008-02-25.9 Modra 0.6-m Vil´agi, Kornoˇs Gal´ad et al. (2007) 2008-02-27.0 Modra 0.6-m Vil´agi, Kornoˇs Gal´ad et al. (2007) 2008-02-27.9 Modra 0.6-m Vil´agi Gal´ad et al. (2007) 2008-03-01.5 Leura 0.25-m Oey Oey (2009) 2008-03-02.4 Leura 0.25-m Oey Oey (2009) 2008-03-03.4 Leura 0.25-m Oey Oey (2009) 2008-03-10.6 Leura 0.25-m Oey Oey (2009) 2008-03-11.4 Leura 0.25-m Oey Oey (2009) 2008-03-13.6 Leura 0.25-m Oey Oey (2009) 2008-03-14.6 Leura 0.25-m Oey Oey (2009) 2008-03-15.5 Leura 0.25-m Oey Oey (2009) 2008-03-16.5 Hunters Hill 0.35-m Higgins Pravec et al. (2012) 2008-03-16.5 Leura 0.25-m Oey Oey (2009) 2008-03-17.5 Hunters Hill 0.35-m Higgins Pravec et al. (2012) 2008-03-17.6 Leura 0.25-m Oey Oey (2009) 2008-03-18.5 Hunters Hill 0.35-m Higgins Pravec et al. (2012) 2008-03-18.7 Leura 0.25-m Oey Oey (2009) 2008-03-19.6 Hunters Hill 0.35-m Higgins Pravec et al. (2012) 2008-03-26.6 Leura 0.25-m Oey Oey (2009) 2008-03-27.6 Leura 0.25-m Oey Oey (2009) 2008-03-28.4 Leura 0.25-m Oey Oey (2009) 2008-03-29.4 Hunters Hill 0.35-m Higgins Pravec et al. (2012) 2008-03-30.6 Leura 0.25-m Oey Oey (2009) 2008-03-30.6 Hunters Hill 0.35-m Higgins Pravec et al. (2012) 2008-03-31.6 Leura 0.25-m Oey Oey (2009) 2008-03-31.6 Hunters Hill 0.35-m Higgins Pravec et al. (2012)
Dates, observatories, telescope apertures, and observers for the light curve data collected for 2001 SN263. TMO refers to the Table Mountain Observatory, OAVdA is the
Astro-nomical Observatory of the Autonomous Region of the Aosta Valley, PDO is the Palmer Divide Observatory, and OHP is the Observatoire Haute Provence.
delay-Doppler images presented here, relative radial velocity is shown along the x-axis and range increases along the y-axis. For each night we obtained data with 0.1µs (15-meter) resolution, 0.5µs (75-meter) resolution, or both. For each transmit-receive cycle, or run, there is some number of statisti-cally independent measurements, or “looks”. The looks are single estimates of the echo’s delay-Doppler power distribution, and the number of them, Nlooks, which is chosen for a given resolution, is equal to the product of the round-trip time and the doppler frequency resolution. We incoherently sum these estimates which reduces the fractional noise fluctuation by a factor of √Nlooks. The values used for Nlooks can be found in the Supplementary information. A more detailed description of the reduction for delay-Doppler images is described by Magri et al. (2007).
Figure 1 displays the 0.5µs-resolution summed delay-Doppler images from each night of radar observations. Both satellites are visible in the summed images, as well as the individual images. In Figure 1 the satellites appear smeared due to their movement with respect to the primary. This effect is most pronounced when the satellite’s motion is in the line of sight, detected in the radar data as having a high absolute radial velocity relative to the primary. The delay-Doppler images were used to estimate the diame-ter and rotation period of the three components of 2001 SN263. Assuming a roughly spherical object, the range of the signal in the delay-Doppler images represents the approximate radius of the object. The Doppler broadening, or bandwidth, can be measured in the images and applied to Equation 1 to estimate the instantaneous rotation period.
Pr = 4πD
λB cos δ (1)
Here Pr is the rotation period, D is the object’s maximum diameter (esti-mated by the range), B is the bandwidth, λ is the wavelength (12.6 cm) and δ is the sub-Earth latitude (Ostro, 1993).
The relatively constant bandwidths of Alpha and Gamma suggest spheroidal objects, however Beta’s widely-varying bandwidth and range extent imply that it is non-spheroidal. Additionally, the estimate for the rotation period of Beta is significantly faster than its orbital period, indicating that the satellite is not in synchronous rotation about Alpha.
2.2. Continuous Wave Spectra
We obtained continuous wave (CW) echo power spectra for each night of radar observations with the exception of February 26th. We transmit a circularly polarized signal at 2380 MHz for approximately the same amount
Figure 1: Summed delay-Doppler images for each night of observation spanning from February 12 through February 26, 2008. Each summed image is the entire night’s data with a baud of 0.5 µs and frequency of 0.6 Hz. The delay-Doppler images display delay (range) along the y-axis and Doppler (relative radial velocity) along the x-axis. The two satellites are evident throughout each of the days. The smeared appearance of the satellites are due to their movement relative to the primary throughout the observations.
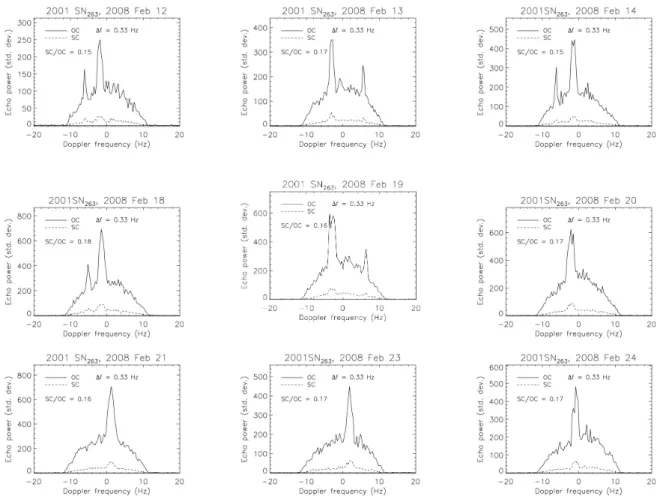
of time as the round-trip time of the signal. We then receive the reflected signal, most of which has been polarized in the opposite direction (OC) upon reflection, though some of the signal, due to secondary reflections, is received with the same polarization (SC). The CW spectra are plotted in Figure 2. The broad, overall signal seen in the figure indicates the fast rotation rate of the larger primary, while the two thin spikes in the data represent the smaller satellites, which are rotating much more slowly. The locations of the spikes shift each day due to the changes in relative velocity with respect to the center of the primary as the satellites orbit.
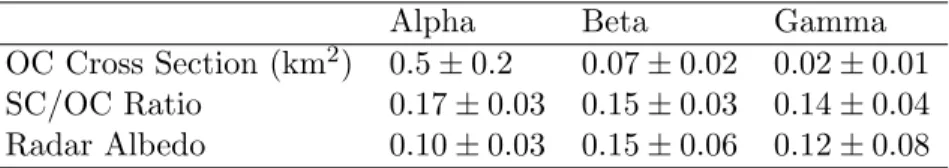
We derive values for the polarization ratios and radar albedos of the three components of 2001 SN263 when their contributions are separable. The radar albedo is defined as the ratio of the objects’ radar cross section to its projected area (Ostro, 1993). We find the OC cross sections for Alpha, Beta and Gamma are 0.5 ± 0.2 km2, 0.07 ± 0.02 km2, and 0.02 ± 0.01 km2, respectively. These values are also listed in Table 3. The cross sections include statistical errors from the variability of the cross section from scan to scan as well as a 25% systematic calibration uncertainty. A comparison of the spectra in both polarizations reveals SC/OC ratios for Alpha, Beta and Gamma of 0.17 ± 0.03, 0.15 ± 0.03, and 0.14 ± 0.04 respectively, which are
Table 3: Properties from Continuous Wave Spectra
Alpha Beta Gamma
OC Cross Section (km2) 0.5 ± 0.2 0.07 ± 0.02 0.02 ± 0.01
SC/OC Ratio 0.17 ± 0.03 0.15 ± 0.03 0.14 ± 0.04
Radar Albedo 0.10 ± 0.03 0.15 ± 0.06 0.12 ± 0.08
The OC cross section is the cross section of the reflected radar signal polarized opposite to the transmitted signal. The SC/OC ratio is a comparison of the reflected radar signal that is circularly polarized in the same direction as the transmitted signal (SC) to the reflected signal with the opposite polarization (OC).
mutually consistent. The ratio of the signals roughly describes the percent of the signal that is reflected a second time on the asteroid’s surface and therefore provides a measure of the surface roughness. Low ratios indicate a relatively smooth near-surface at the wavelength scale (few cm). The average values of the SC/OC ratios are on the lower end of observed polarization ratios for primitive, C-class near-Earth asteroids (Benner et al., 2008). The low but non-zero circular polarization ratio also indicates that there may be some decimeter-scale structure within a few meters of the surface (Magri et al., 2007).
We use the average projected area from the best-fit models (described in Section 3) and the uncertainties in those models to determine the radar albedos. The results are summarized in Table 3. The radar albedo of Al-pha, Beta and Gamma are 0.10 ± 0.03, 0.15 ± 0.06 and 0.12 ± 0.08. The larger nominal radar albedos of Beta and Gamma may imply slightly higher surface densities than Alpha, but not in a statistically significant way as the uncertainties allow the radar albedos of all three components to be mutually consistent.
2.3. Light Curves
We carried out photometric observations of 2001 SN263 from eight dif-ferent observatories. Many observers were eager to help characterize this as-teroid system once the discovery of the two satellites was announced (Nolan et al., 2008). We used the standard asteroid light curve photometry tech-niques for each observatory as described in the papers listed under the Data Reduction Reference column in Table 2.
We analyzed the photometric observations using the methods described in Pravec et al. (2006). First, we identified measurements that were taken during mutual events (eclipses or occultations between the primary and a satellite), based on the occurrence of a brightness attenuation during the
Figure 2: Opposite-circularization OC (solid) and same-circularization SC (dashed) con-tinuous wave echo power spectra obtained for 2001 SN263. ∆f is the Doppler frequency
resolution. The thin bright peaks are due to the smaller satellites rotating much more slowly than the primary, constraining their entire signal to a smaller range in Doppler frequency. The spike due to the smaller satellite, Gamma, is not always noticeable; it can be buried by the primary echo or overlap with the signal from Beta. The bandwidth of the primary is nearly constant throughout the observations, indicating that the shape is spheroidal and that the sub-radar latitude did not change much, which is likely because we were looking near the equator throughout the observations. The SC/OC ratio provides an estimate of the surface roughness. The average SC/OC ratio for the primary is 0.17, which is within the range for primitive C-type NEAs (Benner et al., 2008). The SC/OC ratio for the satellites (spikes) are also nearly 0.17, which may suggest similar surface structure for the moons.
event as compared with measurements taken at other times covering the same rotational phases outside mutual events. The identified in-event mea-surements were removed. The out-of-event data were analyzed using the Fourier series method described in Pravec et al. (2006). Where there was a detectable signal from the rotation of Beta, which has a period of approxi-mately 13.4 hours (see Section 3.4.1), we fitted the data with two additive Fourier series, one with the rotation period of Alpha and the other with the period of Beta (we did not find a clear signal from the rotation of Gamma). The brightness variation with the 13.4-h period was removed from the mea-surements by subtracting the non-constant part of the Fourier series with the 13.4-h period from the measurements; the constant term, corresponding to the mean brightness of Beta, was left in the data, as we did not know a
priorithe mean brightness ratio between Alpha and Beta. In the resulting data, the brightness variation due to the rotation of Alpha was present and the data were used in our subsequent modeling of Alpha.
2.4. Spectra
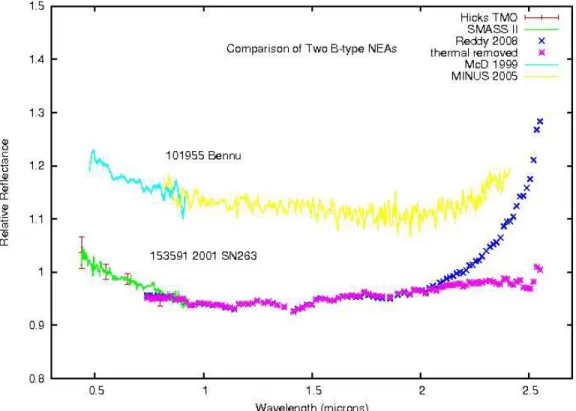
Characterization of NEAs at many different wavelengths leads to a much more complete understanding of their origin, history and structure. We co-ordinate observations of radar targets by other observers whenever possible. M. D. Hicks obtained visible photometry of 2001 SN263 on 16 Dec 2007 from TMO. When these data are compared to the most similar spectra of the SMASS II survey (Bus & Binzel, 2002), the blue slope most closely matches B-type asteroids such as 704 Interamnia. Near-infrared spectroscopy (0.8-2.5 microns) was obtained using the NASA Infrared Telescope Facility (IRTF) by Reddy et al. (2008) on February 27, 2008. We obtained 1.9-4.1 micron spectrum, and fit a thermal model in order to remove the thermal contribu-tion.
These data combined with the visible photometry gives a taxonomic class B (part of the C-complex), whereas the near-infrared spectrum alone matches the C, B or Cb class in the Bus-DeMeo taxonomic system (DeMeo, et al. 2009; Reddy et al., 2008). Our spectral analysis agrees with that of Perna et al. (2014). More extensive spectral coverage results in a more definitive taxonomic class identification. Reddy et al. (2008) suggest that the CV3 meteorites are the best analog to 2001 SN263, based on the featureless blue sloped spectrum. The visible photometry is also similar to 101955 Bennu, target of the OSIRIS-REx mission (Figure 3), although the near-infrared spectrum of Bennu is bluer than that of 2001 SN263 (Clark et al., 2011). The objects also have similar orbital inclinations, with Bennu inclined by 6◦ (Nolan et al., 2013) and 2001 SN
Figure 3: The near-infrared spectrum of 2001 SN263 was measured using SpeX at the NASA IRTF by R. J. Vervack, Jr. and N. Dello Russo (pers. communication) on 2008 Feb 26 (2.2-4.1 microns) and reduced by one of us (ESH). In addition, Reddy et al. (2008) obtained the spectrum from 0.8-2.5 microns. We match the photometry from Hicks et al. on 27 Dec 2007 along with the CCD spectrum that most closely matches those data (704 Interamnia, a B-type) from the SMASS II survey (Bus & Binzel, 2002). We fit a thermal model and remove the thermal contribution from the 2001 SN263spectrum beyond
2 microns, in order to classify only the reflected portion of the spectrum. This asteroid is in the B taxonomic class, which is unusual. Another B class NEA is 101955 Bennu, the target of the OSIRIS-REx sample return mission (Clark et al., 2011). The combined spectrum of Bennu is shown for comparison, offset for clarity.
Center, 2001; Perna et al., 2014). These similarities may suggest a common origin, and the samples expected from Bennu may be similar in composition to objects like 2001 SN263. Delbo et al. (2011) determine the visible albedo is 0.048 +/- 0.015 consistent with the B taxonomic class. They fit a NEATM thermal model to 1.9-4.1 micron IRTF SpeX spectrum and derive a beaming parameter of 1.35 ± 0.03, which they interpret as indicative of relatively little regolith on the surface. Asteroid systems with satellites seem to have systematically higher beaming parameters than similar sized single NEAs (Delbo et al., 2011), which may provide a useful constraint on their formation mechanism.
3. SHAPE Modeling
We derive 3-D shape models, including estimates of the axis dimensions, spin states, rotation periods, and the shape of the objects for the three com-ponents of the asteroid system 2001 SN263 from the radar images and light curve data. The iterative SHAPE modeling method is described in detail by Magri et al. (2007) based on the techniques of Hudson (1993). The general process includes modeling the object as triaxial ellipsoid, then as a smooth set of spherical harmonic functions, and then with a series of approximately equally-sized triangular facets (Nolan et al., 2013). For each model, we pro-duce synthetic light curves and delay-Doppler images and determine a χ2by minimizing the residuals between the simulated data and the observations. To guide the modeling process, the data is weighted depending on its quality or the type of data being used (i.e. light curves or delay-Doppler images) (Nolan et al., 2013). Additional guidance is given through user-provided penalty functions, which constrain the shapes to adhere to the more sim-plified assumptions of principal axis rotation, uniform density and smaller concavities. We assume principal axis rotation as the data and the model fits do not suggest otherwise. The penalty functions constrain the model’s density to be uniform at large scales but they do not rule out small-scale variations in the density. The concavity penalty functions prevent unreal-istic features of the model that can be created due to artifacts in the data, however they are set to still allow for varying topography. For each penalty function, we chose values that were as small as possible and yet did not re-sult in non-physical shapes or features in the model, as described by Magri et al. (2007). The variables that describe the photometric and radar scat-tering equations were left as free parameters to be fit during the modeling process. A list of other parameters used in the SHAPE modeling routines can be found in Magri et al. (2007), and we follow similar procedures and
assumptions made in that paper. The goodness of fit is determined by comparing the synthetic and observed data and minimizing the objective function, which is the sum of the reduced χ2 and the penalty functions. Here we will refer to the objective function as χ2 for simplicity (Magri et al., 2007; Nolan et al., 2013).
3.1. Uncertainties
We determine the uncertainties in our model by exploring the parame-ter space around the best-fit values for each axis, the period and the pole direction of Alpha, Beta and Gamma following the uncertainties analysis de-scribed by Nolan et al. (2013). We test the accuracy of the fit by re-running the model with slightly varied values for the physical parameter in question. For example, to determine the uncertainties of the size of the object in the X-axis dimension, we run a suite of models with values that slightly deviate from the best-fit value, and hold all other parameters constant. We then inspect the results and compare the changed models’ reduced χ2. These grid searches surrounding the parameter of interest, for which we typically ran 80-100 test models, result in a parabola of χ2 values with the best-fit value at the vertex. We analyze the increase in χ2 as a function of deviance from the best-fit value for the given parameter. As described by Nolan et al. (2013), some aspects of the model are not equally related to the degrees of freedom in the data. In order to compute the χ2 for each parameter we only included the degrees of freedom that were affected by those parameters. This was determined empirically for each parameter. Therefore, we had to make subjective judgments about the uncertainties based on the combina-tion of the numerical changes in reduced χ2 and the visual inspections of the observations compared with the synthetic data produced by the model. For the uncertainties of the equatorial X- and Y- axes of the primary, Alpha, we use CW data to put stronger constraints on the edges of the asteroid. The uncertainty of the polar Z-axis cannot be constrained with the radar data, however the light curve data do effectively constrain the polar Z-axis and keep the uncertainties low. For any parameter that revealed two possible limits for the uncertainty (i.e. χ2 deviated more quickly as we increased the parameter’s value than when we decreased it), we always chose the higher uncertainty level. We evaluate the deviation from the best-fit value in this manner for each parameter to determine and assign the uncertainties accordingly. The uncertainties for the volume and density of each object were calculated by error propagation from the uncertainties of the principal axes and the mass.
3.2. Modeling Dataset
The modeling dataset contains 240 delay-Doppler images, of which 139 were taken at 0.5-µs resolution (75 m/pixel), and 101 images at 0.1-µs res-olution (15 m/pixel). We use a total of thirty light curve data sets spanning January 12 - March 31, 2008 in our final model. For the satellites, only the 0.5 µs data was used. We mask the satellites Beta and Gamma from the delay-Doppler images before using them to model Alpha to ensure that the models are based on data that include only signal from the primary. When we model Beta and Gamma, we vignette the images to feature only the appropriate satellite. In some of the images from February 18 and 20, Gamma’s signal overlaps with Alpha’s. Because we are unable to distin-guish the exact extent of Gamma’s signal from that of Alpha, we are unable to vignette and use these images for the models of Gamma. We are, how-ever, able to conservatively mask Gamma out of the images we then use for the SHAPE models of Alpha. No light curves were used for modeling the satellites.
3.3. Shape Modeling of 2001 SN263 Alpha
3.3.1. Pole Search
In order to determine the physical properties of Alpha, the primary object of 2001 SN263, we conducted an iterative modeling process of the general shape, the spin-pole orientation, and the rotation period. From the photometric data we derived a rotational period of 3.4340 ± 0.0012 hours, which we used as an initial parameter for the models. We calculated an estimate for the diameter of the asteroid from the delay-Doppler images. The object appears consistently spheroidal in the radar data, so we therefore can assume that the signal is reflected from approximately half of the asteroid. The range in the images suggested a diameter of 2.8 km.
We began the modeling process by constraining the orientation of the spin-pole. We performed a grid search of the entire sky divided into 15o increments in ecliptic latitude and longitude. We modeled the primary as a series of 8th-order and 8-degree spherical harmonic functions with 81 coeffi-cients. In order to off-set the computational time requires for the harmonic models, we chose a representative subset of the radar and light curve data for SHAPE to process. The light curve data was also binned by 3, 5, or 10 points, depending on the complexity of the features in each dataset. The resulting χ2 values from the grid search indicated that the best-fit models had pole orientations with an ecliptic latitude (β) between −70◦and − 90◦. The best-fit model had a pole orientation of λ (ecliptic longitude) = 331◦, β
(ecliptic latitude) = −82◦, which is in agreement with the pole orientation determined by Fang et al. (2011): (λ, β) = (345◦, −82◦). In this modeling process, we allowed the rotational period to be a free parameter and we found that the retrograde pole models provided a better fit for the sidereal rotation period.
3.3.2. Vertex Models
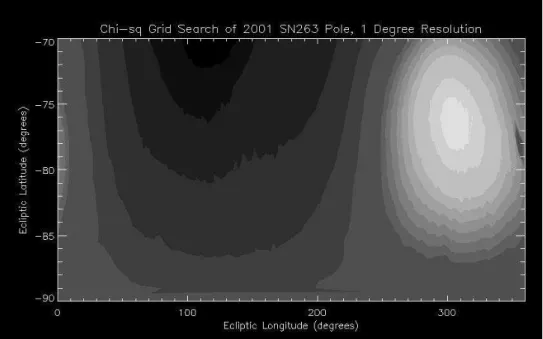
With good constraints on the period, pole orientation, and shape of Alpha, we further refined the object’s shape by building the more com-putationally complex faceted vertex model. We converted the parameters from the several of the best-fit models described by the spherical harmonic functions, fitting 1148 vertices to match the shape of the asteroid. When constructing the vertex models we utilized all of the delay-Doppler images listed in Table 1. We ran a suite of models, varying the sidereal period of the object for several good pole orientations, and found that the models converged to a value of 3.4256 ± 0.0002 hours. This is in good agreement with the photometry-derived period of 3.4340 ± 0.0012 hours, which was not quite the sidereal period. Our model accounts for the apparent rota-tion due to the object’s morota-tion through the sky and the pole orientarota-tion. With a much stronger constraint on the rotation period, we ran another grid search for the pole orientation, focused in the best-fit region for the ecliptic latitude −70◦ < β < −90◦, incrementing the latitude by 1◦. To limit the number of free parameters in the grid search, we kept the shape of the model constant, allowing only the axial ratios and period to deviate for each fit. Figure 4 is a contour plot displaying the results of the vertex grid search where lighter regions indicate models with the lowest χ2. The best-fit model had a pole direction of (λ, β) = (307◦, −77◦). Many of the models fit the data well, however the reduced χ2 for the light curve data increased quickly with deviations from the best pole direction. Visual in-spection of the synthetic light curves compared with the observations show good fits for at least ±5◦ in ecliptic latitude. However, because the shape of the object was unable to change during the grid search, the best-fit pole may have been biased. We chose three of the best-fit spin-axis pole orienta-tions, λ, β) = (306◦, −77◦), (308◦, −80◦), and (303.5◦, −82◦), and re-ran the vertex models, allowing all of the facets describing the shape to be varied. To further constrain the models, we included additional light curve data sets in these runs. In an attempt to constrain the longitudes, we ran a suite of models, varying the longitude between 261◦ and 357◦ with the best-fit lati-tude β = −80◦, however at the high polar latitude we did not expect to be able to constrain the longitudes well. We found that there is no significant
difference in the reduced χ2 values for the longitudes tested. We adopt the best-fit pole direction of (λ, β) = (309◦, −80◦) ± 15◦.
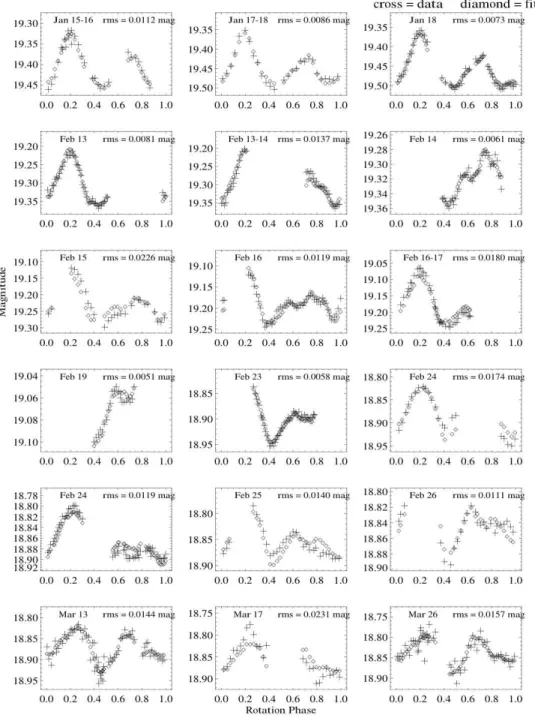
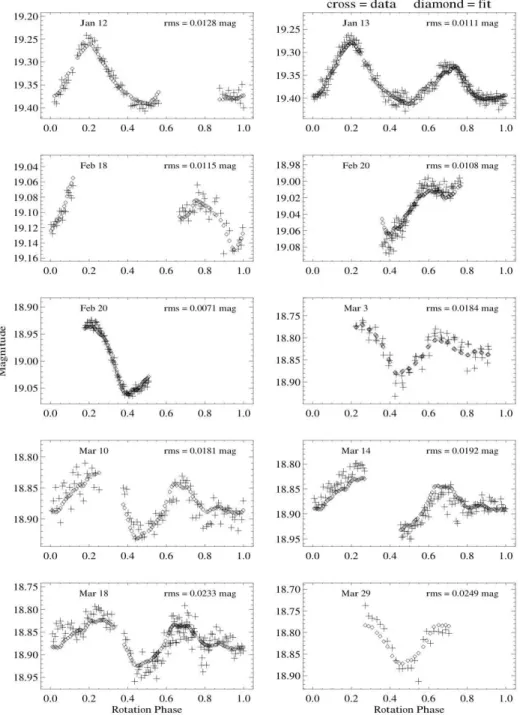
We examine how well our final model reproduces the data through com-parisons of the synthetic light curves and the photometric observations, as seen in Figure 5. We also compare the model light curves with the light curve data that was not included in the modeling, and extend to dates slightly before and after the dates used in the modeling data set (Figure 6). We find that the model light curves are in excellent agreement with the data, which supports the adopted pole direction, model shape, and period determined for 2001 SN263 Alpha.
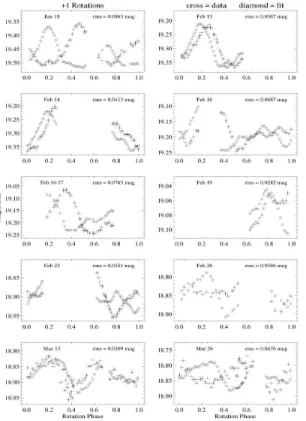
For further confirmation of Alpha’s rotation period, we investigate the possibility of additional or fewer rotations occurring in the time-span of the data. We added and removed 1, 2, 5, 7, 14, and 30 rotations to the total number of rotations that Alpha should have made over the course of the light curve observations. We included 7 and 14 rotations because the asteroid rotates approximately 7 times per day. We again compare the model-produced light curves with the data in Figure 7 and find that models with additional or fewer rotations are very poor matches to the observations, further confirming the adopted rotation period of 3.4256 ± 0.0002 hours.
3.3.3. Shape and Size of 2001 SN263 Alpha
We present the final shape model of 2001 SN263 Alpha in Figure 8. Re-gions of the asteroid that could not be observed by radar are marked as yellow in the figure. Figure 9 compares the model with a representative sub-set of delay-Doppler images. The first column represents the delay-Doppler image that would be observed based on the model, the second column dis-plays the observed delay-Doppler image, and the third column illustrates the plane-of-sky view of the model for the given radar observation, with princi-pal rotation axes shown for clarity. 2001 SN263Alpha displays an equatorial bulge, a common characteristic for the primary in a multi-asteroid system (e.g., Ostro et al. (2006); Harris et al. (2009)). From the derived shape of the model, we calculate various physical parameters that describe the asteroid. The final shape models indicates that the dimensions of the primary of 2001 SN263 along the equatorial X- and Y-axes, and the polar Z-axis are 2.8 ± 0.1km, 2.7 ± 0.1 km and 2.9 ± 0.3 km, respectively. Alpha’s equivalent diameter is 2.5 ± 0.3 km. The primary’s volume is 8 ± 1 km3. We apply the mass derived by Fang et al. (2011) of 917 ± 2 × 10¹⁰ kg and find Alpha’s density to be 1.1 ± 0.2 g/cm3. Marchis et al. (2012) determine that the bulk density for C-complex binary asteroids to range from 0.7 − 1.7 g/cm3, supporting the spectral analysis that 2001 SN263 is a C-complex asteroid.
Reddy et al. (2008) suggest that the meteorite analog for the asteroid is a CV3. Using the average grain density of 3.5 ± 0.3 g/cm3 for CV meteorites derived by Macke et al. (2011), we estimate the porosity of Alpha to be 68%, implying a rubble-pile structure. Table 4 summarizes the model results for the physical parameters that describe 2001 SN263 Alpha and its satellites.
Figure 4: 1-degree pole search for the pole direction of Alpha. The bright spot near β = −75, λ = 320 corresponds with the lowest reduced χ2. Each darker contour then
represents an approximate 10% increase in reduced χ2
.
3.4. Shape Modeling of the Satellites of 2001 SN263
We model the smaller components of 2001 SN263 using a similar process to that described for Alpha, however the poorer fractional resolution of the radar images of the satellites due to their smaller sizes limits our ability to detect features. We therefore create spherical harmonic models of the two satellites. Although Beta and Gamma could be librating, we do not have high enough signal to noise to assess the question. Librations are therefore not included in the models.
3.4.1. Beta
The radar images reveal that Beta’s bandwidth changes throughout the observations. The light curve data suggest a period consistent with 13.4
Figure 5: Selected light curve data (cross) versus model light curves (diamonds). Here we plot light curves that would be produced from the shape model of Alpha compared
Figure 6: Selected light curve data (cross) versus model light curves (diamonds). In this plot we show the model light curves vs. light curve data that were not included in the
Figure 7: Light curve data (plus) vs. model (diamond) when adjusting the rotation period by adding or removing rotations over the timespan of the data (January through March). The data with additional or fewer rotations do not match the light curve data, further verifying the rotation period derived in this paper. Here we show the poor fits for two examples, +1 rotation (left) and -7 rotations (right). We investigated the effect of ±7 rotations because the asteroid completes approximately 7 rotations per day according to our adopted rotation period.
Table 4: Physical Properties of Triple Asteroid System 2001 SN263
Property Alpha Beta Gamma
Principal Axes (km) X 2.8 ± 0.1 0.8 ± 0.1 0.5 ± 0.2 Y 2.7 ± 0.1 1.0 ± 0.2 0.4 ± 0.1 Z 2.9 ± 0.3 0.6 ± 0.1 0.4 ± 0.1 Equivalent Diameter (km) 2.5 ± 0.3 0.8 ± 0.1 0.4 ± 0.1 Volume (km3) 8 ± 1 0.24 ± 0.06 0.04 ± 0.02 Mass (1010 kg)∗ 917 ± 2 24.0 ± 8 10 ± 3 Density (g/cm3) 1.1 ± 0.2 1.0 ± 0.4 2 ± 1 Porosity 68% 72% 36% DEEVE (km) X 2.6 ± 0.1 0.8 ± 0.1 0.5 ± 0.2 Y 2.5 ± 0.1 1.0 ± 0.2 0.4 ± 0.1 Z 2.4 ± 0.3 0.62 ± 0.09 0.4 ± 0.1 Rotation Period (hr) 3.4256 ± 0.0002 13.429 ± 0.010 16.40 ± 0.04+ Pole Direction
Ecliptic Longitude & Latitude (λ, β) (309◦, −80◦) ± 15◦
∗The masses of the Alpha, Beta, and Gamma were obtained by Fang et al. (2011). +The
rotation period for Gamma is assumed to be equal to its orbital period, which was deter-mined by Fang et al. (2011). The equivalent diameter is the diameter of a sphere with the model’s volume. ‘DEEVE’ is the dynamically equivalent, equal volume ellipsoid. Porosity is calculated assuming CV meteorite analog with a density of 3.54 g/cm3
(Macke et al., 2011).
Figure 8: Final model for Alpha as seen from different viewing geometries. Yellow regions indicate a parts of the asteroid that could not be observed by the radar data. The max-imum incidence angle for this region is 60◦. The unseen region is small and constrained,
and likely has little effect on the rest of the model. The model shows the asteroid to have an equatorial bulge, common for the primary in a binary or ternary NEA system.
or 15 hours, which is significantly shorter than its ∼ 6 day orbital period, indicating that Beta is in an asynchronous rotator (different orbital and rota-tional periods). We constrained the period by 8th-order spherical harmonic SHAPE models of Beta with initial periods ranging from 12 -18 hours and an initial diameter of 0.9 km. We assume that Alpha’s spin-axis is aligned with the mutual orbit pole, and that Beta’s spin-axis pole is also aligned. The model with a period of 13.43 hours was the best-fit to the delay-Doppler data. Visual inspection of the models also revealed that the 13.42-hour pe-riod better matched the observations, particularly at the trailing edge or “tail” of the satellite in the radar images (Figure 12).
We ran an all-sky 15-degree interval grid search using 8thorder spherical harmonic models of Beta to explore the possibility of determining its spin-axis directly from the radar images. For each model, the initial parameters are derived from our best-fit models, however we set all of the parameters as free parameters, with the exception of the pole orientations. Figure 10 shows the results of this grid search. The light regions represent pole directions with good fits, while dark regions are poor fits. Each contour represents an approximate 10% decrease in reduced χ2 from dark to light. Diamonds indicate the precise poles used in the grid search. Due to the extensive
Figure 9: Comparison of 0.5µs-resolution delay-Doppler images with model for the first radar image received each night in February 2014. The first and fourth columns are the synthetic radar images produced by model, the second and fifth columns contain the 0.5µs-resolution delay-Doppler image used in the modeling process, and the third and last column show the viewing geometry of the model. The cross represents the center of mass of the asteroid. The long and intermediate principal axes are represented by the red and green shafts, respectively, while the spin vector is shown as a pink arrow.
regions displaying moderate reduced χ2values, we are unable to place strong constraints on the pole direction of Beta using the radar data. The spin-axis orientation is not inconsistent with being aligned with Alpha’s spin-pole and therefore we maintain our assumption of the aligned mutual orbit and spin-axes of Alpha and Beta.
We create a final model for 2001 SN263 Beta assuming the adopted spin axis of Alpha (β = −80, λ = 309). The model is shown in Figure 11. We compare the delay-Doppler images produced by the model with the radar data in Figure 12. The first column (left) represents the model radar data, the second column (middle) shows the delay-Doppler images, and the third column (right) shows the plane-of-sky view of the satellite model. We note that the model reproduces the location of the trailing edge of the satellite, indicative of an accurate rotation period for 2001 SN263 Beta.
The physical parameters for the outer satellite Beta are listed in Table 4. We find that the satellite’s equatorial X-, Y-, and polar Z- axes are 0.747±0.12 km, 1.01±0.16 km, and 0.64±0.10 km respectively. Its equivalent diameter is 0.77 ± 0.12 km.The final model produced a volume of 0.24 ± .06 km3, and therefore a density of 1.10 ± 0.41 g/cm3 using the mass derived in Fang et al. (2011).This is consistent within the uncertainties of the density of Alpha. We repeat the calculation made for Alpha assuming CV grain density and find that Beta has an approximate porosity of 72%. The high porosity is suggestive of a rubble-pile internal structure.
3.4.2. Gamma
We use an 8th-degree spherical harmonic model to characterize the small, inner satellite, Gamma. From the delay-Doppler images, we begin by ap-proximating the object to be 0.4 km in diameter. The satellite’s size and proximity to Alpha suggest a tidally locked state, resulting in a rotation period equal to its orbital period of 0.686 days or 16.464 hours (Fang et al., 2011). We investigate the report given by Fang et al. (2011) that the mutual orbit of Gamma may be inclined by 15 degrees to the orbital plane of Beta by conducting an all-sky grid search for Gamma’s spin pole, again assuming that the spin pole is aligned with the mutual orbit pole. We find that we cannot put meaningful constraints on the pole orientation from the radar data and therefore on the orbital plane. The results of the grid search do not rule out either scenario; the spin-axis of Gamma (and therefore the mutual orbit pole) could be aligned with Alpha’s or it could be offset by 15◦ as suggested by Fang et al. (2011).
Our final model of Gamma assumes that the satellite is tidally-locked and has a pole direction aligned with Alpha’s. The shape model is shown
Figure 10: All-sky 15◦spacing grid search of the pole direction of Beta. We use a harmonic
model and a period of 13.432 hours. Diamonds represent which pole directions were tested. Dark regions represent areas of high reduced χ2
while the light-colored regions are better fits. The contour levels represent an approximate 10% increase in reduced χ2
from light to dark. The vast regions of acceptable poles indicate that we are unable to put strong constraints on the pole direction using SHAPE models.
Figure 11: SHAPE model of the larger, outer satellite Beta as viewed along different axes. The moon is elongated, as seen in the delay-Doppler images.
in Figure 13. We find that Gamma’s equatorial X-, Y-, and polar Z- axes are 0.54±, 0.17 km,0.42 ± 0.13 km, and 0.41 ± 0.13 km, respectively. We estimate Gamma’s volume to be 0.04 ± 0.02 km3 and, assuming Fang et al. (2011)’s mass value of 9.773 ± 3.273 × 10¹⁰kg, we calculate the density to be 2.27 ± 1.27 g/cm3. The density is consistent within the uncertainties of the density of Alpha, however it may be that the satellite has a lower porosity than the primary. The derived physical properties for Gamma are listed in Table 3.
4. Discussion
4.1. Formation
Terrestrial double craters (Bottke & Melosh, 1996) and anomalous light curve observations of asteroids (Pravec & Hahn, 1997; Pravec et al., 1998, 2000; Mottola and Lahulla, 2000) hinted at the existence of near-Earth bi-nary asteroids before they were unambiguously detected (Margot et al., 2002). Current observations reveal approximately 15% of all NEAs with diameters greater than 200 meters have a companion (Margot et al., 2002; Pravec et al., 2006). The primary asteroid in binary and triple asteroid
Figure 12: Comparison of 0.5µs-resolution delay-Doppler images of Beta with model for the first radar image received each night in February 2014. The first and fourth columns are the synthetic radar images produced by model, the second and fifth columns contain the 0.5µs-resolution delay-Doppler image used in the modeling process, and the third and last column show the viewing geometry of the model. The cross represents the center of mass of the asteroid. The long and intermediate principal axes are represented by the red and green shafts, respectively, while the spin vector is shown as a pink arrow. Because the synthetic radar images were able to reproduce the trailing edge or ”tail” of Beta, we were able to verify the satellite’s derived rotation period.
Figure 13: SHAPE model of the inner, smaller satellite Gamma as viewed along different axes.
systems is usually rotating very quickly, on average 2.5-4 hours (Pravec et al., 2006) and often displays an equatorial bulge (Ostro et al., 2006). 2001 SN263 Alpha is no exception, with a fast rotation period (3.4256 ± .0002 hours) and a visible equatorial bulge. We can approximate the critical spin limit for the object as Pcrit = 3.3
q 1
ρ where ρ is its density in g/cm
3(Harris, 1996; Pravec & Harris, 2000). This gives a critical spin limit of ∼ 3.10 hours and implies that, like many primary asteroids in NEA systems, the object is a gravitationally bound rubble pile rotating near its critical spin limit.
These properties support a spin-up and fission of the primary as the mechanism for binary formation, presumably due to the Yarkovsky-O’Keefe-Radzievskii-Paddack (YORP) effect (Margot et al., 2002; Scheeres et al., 2006; Pravec & Harris, 2007; Descamps & Marchis, 2008; Walsh et al., 2008; Pravec et al., 2010; Taylor and Margot, 2011; Jacobson and Scheeres, 2011). YORP is the anisotropic thermal re-radiation of sunlight by a rotating as-teroid, creating torques that alter its spin rate (Rubincam et al., 2000). It is hypothesized that YORP can spin up a rubble-pile asteroid to its critical limit, causing the asteroid to shed mass from the equator and subsequently form a secondary component (as modeled by Walsh et al. (2008)). The YORP spin-up timescale for the primary is shorter than its tidal despinning
timescale due to the secondary, enabling the primary to maintain its fast rotation as the system evolves (Taylor and Margot, 2011). Further support for YORP spin-up is the large retrograde obliquity we find for 2001 SN263 Alpha. Over the course of the observations, the heliocentric orbit normal of the 2001 SN263 system was (236, +83) in ecliptic J2000 coordinates. The spin-axis pole reported in this paper of (309, -80) ±15◦ corresponds to an obliquity of 166◦±7
14. Here the uncertainties are determined by calculating the obliquity of the primary if its pole were oriented to (309, -90) and (309, -65), the limits based on the uncertainty in Alpha’s pole direction. Such a large retrograde obliquity could be the result of YORP-driven spin-axis evolution (Rubincam et al., 2000; Nesvorn´y & Vokrouhlick´y, 2008; Hanuˇs et al., 2011).
Most of the known triple asteroid systems, including 2001 SN263 and 1994 CC, are both Hill stable and hierarchically stable (Liu, et al.; Liu et al., 2014), meaning the orbits of the satellites will never cross and will never escape from the system via their mutual gravitational interactions. This also argues against a past history of strong interaction. Formation likely occurs from one of three avenues: a single formation event for both satellites, a formation event involving the primary and a second event involving the secondary, or successive formation events involving the primary. We do not intend here to determine the formation mechanism of triple asteroid systems, but instead describe the challenges in forming them.
In the first scenario, the primary rotates near its critical spin limit and then exceeds it, either most likely by continued YORP spin-up (Walsh et al., 2008) or possibly due to a collision (Ortiz et al., 2012), resulting in a single mass shedding event. The two satellites then coalesce from the debris disk formed around the primary. To be a viable formation mechanism, enough material would have to be shed from the primary and remain bound to the system to coalesce into the larger satellite, at a wider orbit far enough from the small satellite to avoid gravitationally scattering off one another and upsetting the stability of the system.
In the second scenario, once a secondary has formed during a primary fission event, the spin-orbit coupling of the newly formed system causes the secondary itself to undergo a fission event. Jacobson and Scheeres (2011) find that while this secondary fission event creates a third body in the system, the strong interactions between the three bodies cause the ejection or re-accreation of one of the satellites on rapid timescales of 103 years or less. The lack of a resultant stable three-component configuration is difficult to overcome, especially given the apparent Hill and hierarchical stability of observed systems.
In the third scenario, after a mass shedding event that forms the sec-ondary, the primary again spins up to the critical spin limit and undergoes another mass shedding event to form the tertiary component (Taylor and Margot, 2011; Fang & Margot, 2012a). With enough time between the mass shedding events, the secondary could evolve far enough outward by tides or other orbit-expansion mechanisms that the tertiary can form without hav-ing strong gravitational interactions with the secondary and keep the system stable. The summary of this scenario hinges upon the evolution timescales involved.
4.2. Dynamical Evolution
The dynamical evolution of the triple near-Earth asteroid system also proves difficult to fully explain. In particular, the larger, outer satellite Beta is in a wide, asynchronous orbit, and yet it has a very low eccentric-ity. At least 25% of all near-Earth multi-asteroid systems have an asyn-chronously rotating satellite (Brozovi´c et al., 2011). Among the known and well-characterized binary and triple systems, these satellites also have semi-major axes greater than seven primary radii or eccentricities greater than 0.05 (Fang & Margot, 2012a). While Beta’s semimajor axis is approximately 13 primary radii, its eccentricity is only 0.015 (Fang et al., 2011). Here we discuss a few evolutionary paths that could lead to Beta’s current orbital state.
Gravitational tides between the rubble-pile components will evolve Beta outward, synchronize its rotation, and circularize its orbit Goldreich & Sari (2009). However, the process acts very slowly at separations beyond a hand-ful of primary radii for reasonable material properties (Taylor and Margot, 2010, 2011) and is unlikely to evolve the separation sufficiently in the dy-namical lifetime of a near-Earth asteroid of a few to tens of millions of years(Gladman et al., 1997; Bottke et al., 2002). Perhaps Beta was formed prior to the injection of 2001 SN263 from the main belt allowing a longer timescale for tidal evolution, but tides alone cannot account for the observed asynchronous rotation of Beta.
Binary YORP, or BYORP, is theorized to affect the orbit of a binary system as a result of the imbalance in re-radiated light by the permanent leading and trailing hemispheres of a synchronously rotating secondary ( ´Cuk and Burns, 2005; ´Cuk and Nesvorn´y, 2010). If Beta formed in a closer or-bit around Alpha, then tides could quickly synchronize its oror-bit, enabling BYORP. ´Cuk and Nesvorn´y (2010) find that once the secondary reaches 0.2-0.4 primary radii in size (as Beta is), BYORP increases the semimajor axis and the eccentricity on timescales much faster than tides. For sufficiently
elongated secondaries on eccentric orbits, ´Cuk and Nesvorn´y (2010) deter-mine chaotic rotation is inevitable and breaks the synchronous rotation. For many of their simulations, though, the synchronous orbit is re-established in the opposite direction causing the orbit to contract. This scenario, how-ever, cannot simultaneously explain the low eccentricity and asynchronous rotation of Beta.
An alternate formulation of BYORP by McMahon & Scheeres (2010) predicts eccentricity damping as the semimajor axis increases, but requires another mechanism to break the synchronous lock of the satellite, such as a planetary flyby (Fang et al., 2011; Fang & Margot, 2012b), increased libra-tion during outward evolulibra-tion by BYORP (Jacobson et al., 2014), or YORP spin up overcoming tidal damping at such a large separation (Goldreich & Sari, 2009). Continued YORP spin up could then explain how Beta’s ro-tation period could evolve from a synchronous value of several days to its current value of approximately 13 hours.
Another possibility involves Beta forming near its current separation of ∼13 primary radii. Jacobson and Scheeres (2011) suggest rotational fis-sion can form wide asynchronous binaries that never synchronize due to the weakness of tidal torques at such large separations. However, producing a wide separation requires a large eccentricity. While tides can damp the eccentricity, at Beta’s separation, it would require of order 1010 years to damp to its current value of 0.015 (Jacobson et al., 2014), far exceeding the dynamical and collisional timescales of the system. Again, the combination of a wide separation, a low eccentricity, and asynchronous rotation make the formation and evolution of Beta difficult to unravel. Even Jacobson et al. (2014) concede the formation of Beta may require “something more exotic” than direct rotational fission to explain its current dynamical state. Beyond Beta, models must also account for the formation of Gamma and whether its formation occurred during the event that formed Beta or it at some other time.
The dynamical processes enacted on Beta to give the satellite its current orbital properties should continue to evolve the system further. It is possible that some secondaries continue to migrate outwards until they are no longer gravitationally bound to the primary. At this point, they would be observed as an asteroid pair rather than a binary system (Nesvorn´y & Vokrouhlick´y, 2008). Near-Earth asteroid pairs formed in this way may be difficult to observe due to the small size of the once-satellite component. Asteroid 341843 2008 EV5 displays the spherical shape and equatorial bulge typical of the primary in a binary or triple system, however no satellite has been detected (Busch et al., 2011). While it is currently spinning at a rate too slow
to form a secondary, perhaps it once had a companion that tidally migrated far from the primary, simultaneously slowing the primary’s rotational spin. Additionally, 101955 Bennu, the target of the OSIRIS-REx mission, is a spheroidal object with the an equatorial ridge (though less well-defined) and a fast rotation period of 4.297461 ± 0.002 hours but with no detected satellites (Nolan et al., 2013). Furthermore, Vokrouhlick´y (2009) report the existence of an asteroid pair where the primary member, 3749 Balam, is itself a component of a ternary system, with orbital and periodical parameters similar to those of 2001 SN263 (Merline et al., 2002; Marchis et al., 2008; Polishook et al., 2011). Could migration force 2001 SN263Beta into a binary pair with the Alpha-Gamma system? Or could it regain a synchronous orbit and begin to decrease its orbital distance, as predicted by ´Cuk and Nesvorn´y (2010)? For how long are triple systems dynamically stable?
The discovery of triple near-Earth asteroid systems challenges our previ-ous notions of the formation and evolution of binary asteroid systems. The two confirmed triple systems share some properties however they differ in the location of the larger satellite with respect to the smaller one. Unlike in the 2001 SN263system, the outer satellite in 1994 CC is eccentric. Hypothe-ses as to how these systems form must account for these various component alignments, as well as the distant, asynchronously orbiting satellite with different eccentricities. Understanding the dynamical evolution of these sys-tems could provide constraints on their ages, which provides insight into the composition and lifetimes of triple near-Earth asteroid systems.
5. Summary
Using delay-Doppler images and light curve data, we produce three-dimensional models of the three components of the triple near-Earth asteroid (153591) 2001 SN263. We constrain the pole direction for the spin-axis of the primary to be (λ, β) = (309◦, −80◦) ± 15◦. We are unable to place strong constraints on the pole directions of the satellites, however the models do not rule out an alignment of the satellites’ spin-axes with that of the primary. We therefore derive models of the satellites assuming the satellites’ spin-axes and their mutual orbit poles are aligned with the spin-axis of Alpha. The sidereal rotation periods we derive for Alpha and Beta are 3.4256 ± 0.0002 hours and 13.429 ± 0.010 hours respectively. We found no evidence that suggests that Gamma is not tidally-locked, so we assume Gamma’s rotation period is the same as its orbital period of 16.4 ± 0.04 hr (Fang et al., 2011).The shape of Alpha is spheroidal and, like many binary systems, displays an equatorial bulge. The larger, outer satellite,
Beta, is elongated and rotates much more rapidly than its orbital period of six days. The model for the smaller, inner satellite, Gamma, is consistent with a spheroidal object that is tidally locked with the primary. We find the equivalent diameters of Alpha, Beta and Gamma to be 2.50 ± 0.30 km, 0.77 ± 0.12 km and 0.43 ± 0.14 km and the densities of the components to be 1.13 ± 0.15g/cm3,1.01 ± 0.41g/cm3 and 2.27 ± 1.27g/cm3, respectively. This low density and the spectral observations that suggest 2001 SN263 is a dark, carbonaceous B-type asteroid and imply a very porous, rubble-like internal structure. The rapid rotation rate for the primary is consistent with many observed binary NEA systems. 2001 SN263was the first detected triple near-Earth asteroid. The physical properties will help to constrain formation mechanisms and the evolution of binary and ternary systems. They provide strong constraints on the asteroids’ density and internal structure, essential characteristics for understanding the near-Earth asteroid population. 6. Acknowledgements
The Arecibo Observatory is part of the National Astronomy and Iono-sphere Center, which at the time of observation was operated by Cornell University for the National Science Foundation.This research was supported by the Arecibo Observatory, NEOO, and the National Science Foundation Research Experience for Undergraduates (REU) program. This work was partially supported by NSF AST-0808064.The work done at the Ondˇrejov Observatory was supported by the Grant Agency of the Czech Republic, Grant P209/12/0229, and by Program RVO 67985815. The work done at the Modra Observatory was supported by the Slovak Grant Agency for Science VEGA (Grant 1/0670/13). The authors would like to thank the reviewers who helped to improve the content of this paper.
References
Benner, L.A.M, Ostro, S.J., Magri, C., Nolan, M.C., Howell, E.S., Giorgini, J.D., Jurgens, R.F., Margot, J.L., Taylor, P.A., Busch, M.W., Shepard, M.K., 2008. Near-Earth asteroid surface roughness depends on composi-tional class. Icarus 198, 294-304.
Binzel, R.P., Rivkin, A.S., Stuart, J.S., et al., 2004. Observed spectral prop-erties of near-Earth objects: results for population distribution, source regions, and space weathering processes. Icarus 170, 259.
Bottke, W.F., Melosh, H.J., 1996. Binary Asteroids and the Formation of Doublet Craters. Icarus 124, 372-391.
Bottke, W. F., Vokrouhlick´y, D., Rubincam, D., Broz, M., 2002. The effect of Yarkovsky thermal forces on the dynamical evolution of asteroids and meteoroids. In Asteroids III (W. F. Bottke, A. Cellino, P. Paolicchi, R. Binzel, Eds). U. Arizona Press, 395
Brozovi´c, M., Benner L.A.M., Taylor, P.A., Nolan, M.C., Howell, E.S., Magri, C., Scheeres, D.J., Giorrgini, J.D., Pollock, J.T., Pravec, P., Gal´ad, A., Fang, J., Margot, J.L., Busch, M.W., Shepard, M.K., Re-ichart, D.E., Ivarsen, K.M, Haislip, J.B., LaCluyze, A.P., Jao, J., Slade, M.A., Lawrence, K.J., Hicks, M.D., 2011. Radar and optical observations and physical modeling of triple near-Earth Asteroid (136617)1994 CC. Icarus 216, 241-256.
Bus, S. J., and R. P. Binzel, 2002. Phase II of the Small Main-Belt Asteroid Spectroscopic Survey. A Feature-Based Taxonomy. Icarus 158, 146-177. Busch, W. M., Ostro, S.J., Benner, L.A.M., Brozovi´c, M., Giorgini, J.D.,
Jao, J.S., Scheeres, D.J., Magri, C., Nolan, M.C., Howell, E.S., Taylor, P.A., Margot, J.L., Brisken, W., 2011. Radar observations and the shape of near-Earth asteroid 2008 EV5. Icarus 212, 649-660.
Carbognani A., 2011. Lightcurve and Periods of Eighteen NEAs and MBAs, Minor Planet Bulletin, Vol. 38, n.1, p.57-63.
Clark, B.E., Binzel, R. P.; Howell, E. S., Cloutis, E. A.; Ockert-Bell, M., Christensen, P.; Barucci, M. A.;, DeMeo, F., Lauretta, D. S., Connolly, H., Soderberg, A., Hergenrother, C., Lim, L., Emery, J., Mueller, M., 2011. Asteroid (101955) 1999 RQ36: Spectroscopy from 0.4 to 2.4 µm and meteorite analogs. Icarus 216, 462-475.
´
Cuk, M., Burns, J.A., 2005. Effects of thermal radiation on the dynamics of binary NEAS. Icarus 176, 418-431.
´
Cuk, M., Nesvorn´y, D., 2010. Orbital evolution of small binary asteroids. Icarus 207, 732-743.
Delbo, M., Walsh, K., Mueller, M., Harris, A.W., Howell, E.S., 2011. The cool surfaces of binary near-Earth asteroids. Icarus 212, 138.
Descamps, P., Marchis, F., 2008. Angular momentum of binary asteroids: Implications for their possible origin. Icarus, 193, 74-84.
DeMeo, F. E., Binzel, R. P., Slivan, S. And Bus, S. J., 2009. An extension of the Bus asteroid taxonomy into the near-infrared. Icarus., 202,160-180. Fang, J., Margot, J.L., Brozovi´c, M, Nolan, M.C., Benner, L.A.M., Taylor, P.A., 2011. Orbits of Near-Earth Asteroid Triples 2001 SN263 and 1994 CC: Properties, origin and evolution. Astron. J. 141, 154-168.
Fang, J. and Margot J. L., 2012a. Near-Earth binaries and triples: origin and evolution of spin-orbital properties. Astron. J. 143, 24.
Fang, J., and Margot J. L., 2012b. Binary Asteroid Encounters with Ter-restrial Planets: Timescales and Effects. The Astronomical Journal 143, 25.
Fink, U., and Hicks, M. D., 1996. A survey of 39 comets using CCD spec-troscopy. Astrophys J. 459, 729743.,
Gal´ad, A., Pravec, P., Gajdoˇs, ˇS., Kornoˇs, L., Vil´agi, J., 2007. Seven as-teroids studied from Modra observatory in the course of binary asteroid photometric campaign. Earth Moon Planets 101, 17-25.
Gladman, B. J., Migliorini, F., Morbidelli, A., Zappala, V., Michel, P., Cellino, A., Foeschle, C., Levison, H. F., Bailey, M., Duncan, M., 1997. Dynamical lifetimes of objects injected into asteroid belt resonances. Sci-ence 277, 197.
Goldreich, P., Sari, R., 2009. Tidal evolution of rubble piles. The Astrophys-ical Journal 691, 54.
Hanuˇs, J., ˇDurech, J., Broˇz, M., Warner, B. D., Pilcher, F., Stephens, R., Oey, J., Bernasconi, L., Casulli, S., Behrend, R., Polishook, D., Henych, T., Lehk´y, M., Yoshida, F., Ito, T., 2011. A study of asteroid pole-latitue distribution based on an extended set of shape models derived by the lightcurve inversion method. Astronomy & Astrophysics 530, 134.
Harris, A.W., Fahnestock, E.G., & Pravec, P. 2009. On the shapes and spins of “rubble pile” asteroids. Icarus 199, 310
Harris, A.W., 1996. The Rotation Rates of Very Small Asteroids: Evidence for ’Rubble Pile’ Structure. Lunar and Planetary Science 27, 493.
Hicks, M. D., Fink, U., and Grundy, W., 1998. The unusual spectra of 15 near-Earth asteroids and extinct comet candidates. Icarus 133, 6978.
Hudson, S. 1993. Three-dimensional reconstruction of asteroids from radar observations. Remote Sens. Rev. 8, 195-203.
Jacobson, S.A., Scheeres, D.J., 2011. Dynamics of rotationally fissioned as-teroids: Source of observed small asteroid systems. Icarus 214, 161-178. Jacobson, S.A., Scheeres, D.J., McMahon, J., 2014. Formation of the wide
asynchonrous binary asteroid population. The Astrophysical Journal 780, 60-81.
Krugly, Yu.N. Belskaya, I. N., Shevchenko, V. G., Chiorny, V. G., Velichko, F. P., Mottola, S.; Erikson, A.,Hahn, G., Nathues, A., Neukum, G., Gaftonyuk, N. M., Dotto, E., 2002. The near-Earth objects follow-up program. IV. CCD photometry in 1996 - 1999. Icarus 158, 294304. Lang, D., Hogg, D.W., Mierle, K., Blanton, M., Roweis, S., 2010.
Astrom-etry.net: Blind astrometric calibration of arbitrary astronomical images. Astron. J. 137, 1782-1800.
Liu, X., Baoyin, H., Georgakarakos, N., Donnison, J. R., Ma, X., 2012. The Hill stability of triple minor planets in the Solar System. MNRAS 427, 1034-1042.
Liu, X., Baoyin, H., Marchis, F., 2014. The hierarchical stability of the seven known large size ratio triple asteroids using the empirical stability parameters. Astrophysics and Space Science 349, 677-680.
Macke, R.J., Consolmagno, G.J., Britt, D.T., 2011. Density, porosity, and magnetic susceptibility of carbonaceous chondrites. Meteoritics and Plan-etary Science, 46, 1842.
Magri, C., Ostro, S.J., Scheeres, D.J., Nolan, M.C., Giorgini, J.D., Benner, L.A.M., Margot, J.L., 2007. Radar observations and a physical model of Asteroid 1580 Betulia. Icarus 186, 152-177.
Margot, J.L., Nolan, M.C., Benner, A.M., Ostro, S.J., Jurgens, R.F., Giogini, J.D., Slade, M.A., Campbell, D.B., 2002. Binary Asteroids in near-Earth object population. Science 296, 1445-1448.
Marchis, F., Descamps, P., Baek, M., Harris, A. W., Kaasalainen, M., Berthier, J., Hestroffer, D., Vachier, F., 2008. Main belt binary asteroidal systems with circular mutual orbits. Icarus 196, 97-118.