HAL Id: hal-00297501
https://hal.archives-ouvertes.fr/hal-00297501
Submitted on 16 Nov 2004
HAL is a multi-disciplinary open access
archive for the deposit and dissemination of
sci-entific research documents, whether they are
pub-lished or not. The documents may come from
teaching and research institutions in France or
abroad, or from public or private research centers.
L’archive ouverte pluridisciplinaire HAL, est
destinée au dépôt et à la diffusion de documents
scientifiques de niveau recherche, publiés ou non,
émanant des établissements d’enseignement et de
recherche français ou étrangers, des laboratoires
publics ou privés.
from continuous atmospheric observations at Trinidad,
California
T. J. Lueker
To cite this version:
T. J. Lueker. Coastal upwelling fluxes of O2, N2O, and CO2 assessed from continuous atmospheric
observations at Trinidad, California. Biogeosciences, European Geosciences Union, 2004, 1 (1),
pp.101-111. �hal-00297501�
www.biogeosciences.net/bg/1/101/ SRef-ID: 1726-4189/bg/2004-1-101
Biogeosciences
Coastal upwelling fluxes of O
2
, N
2
O, and CO
2
assessed from
continuous atmospheric observations at Trinidad, California
T. J. LuekerScripps Institution of Oceanography, UCSD, La Jolla, CA. 92024-0244 USA Received: 1 July 2004 – Published in Biogeosciences Discussions: 13 August 2004
Revised: 11 November 2004 – Accepted: 11 November 2004 – Published: 16 November 2004
Abstract. Continuous atmospheric records of O2/N2, CO2
and N2O obtained at Trinidad, California document the
ef-fects of air-sea exchange during coastal upwelling and plank-ton bloom events. The atmospheric records provide contin-uous observations of air-sea fluxes related to synoptic scale upwelling events over several upwelling seasons. Combined with satellite, buoy and local meteorology data, calculated anomalies in O2/N2 and N2O were utilized in a simple
at-mospheric transport model to compute air-sea fluxes during coastal upwelling. CO2 fluxes were linked to the oceanic
component of the O2fluxes through local hydrographic data
and estimated as a function of upwelling intensity (surface ocean temperature and wind speed). Regional air-sea fluxes of O2/N2, N2O, and CO2during coastal upwelling were
esti-mated with the aid of satellite wind and SST data. Upwelling CO2 fluxes were found to represent ∼10% of export
pro-duction along the northwest coast of North America. Syn-optic scale upwelling events impact the net exchange of at-mospheric CO2 along the coastal margin, and will vary in
response to the frequency and duration of alongshore winds that are subject to climate change.
1 Introduction
The fate of carbon transported to coastal margins is a sub-ject of increasing interest to biogeoscience and climate re-searchers. Coastal margins have the potential to absorb and transport atmospheric CO2to the interior of the ocean in the
forms of organic and inorganic carbon (Walsh, 1991), a pro-cess referred to as the “continental shelf pump” (Tsunogai et al., 1999; Frankignoulle and Borges, 2001; Liu et al., 2003; Otsuki et al., 2003; Thomas et al., 2004). Uptake and trans-port of CO2in coastal margins constitutes a potentially large
Correspondence to: T. J. Lueker
(tlueker@ucsd.edu)
ocean sink currently underrepresented by ocean carbon cy-cle models and global pCO2surveys (Doney, 1999; Yool and
Fasham, 2001; Sarmiento and Gruber, 2002; Takahashi et al., 2002). Ocean circulation in the coastal region is dominated by wind forcing, and susceptible to interannual variability as well as global change (Hayward et al., 1999; Chavez et al., 2002; Schwing et al., 2002a, b; Chavez et al., 2003; Mur-phree et al., 2003a, b). The forces driving the continental shelf pump also have the potential to impact the mechanisms of carbon sequestration and introduce rapid changes in both CO2flux and in the ecosystems involved in the transport of
carbon to and from the ocean surface (Mangelsdorf et al., 2000; Alvarez-Salgado et al., 2001; Pacala et al., 2001; Barth et al., 2002; Borges et al., 2003; Miller et al., 2003).
Determining the fate of carbon entering the coastal mar-gin along the west coast of North America is a particularly interesting and challenging topic, currently the subject of in-tensive observation and modelling efforts (Barth et al., 2002; Friederich et al., 2002; Hales et al., 2003; Ianson et al., 2003; Plattner et al., 2003). Multiple pathways for carbon trans-port, including upwelling through the release of CO2via
sub-surface ventilation as well as uptake of CO2 through
pho-tosynthesis, ocean currents through the transport of sinking biomass and organic matter, and rivers through the supply of continental biomass and soil carbon, contribute to the uptake and removal of inorganic and organic carbon compounds and CO2 (Ludwig et al., 1996; Opsahl and Benner, 1997;
Au-mont et al., 2001; Hill and Wheeler, 2002; Dickens et al., 2004). Limited observations of the processes involved in car-bon transport at ocean margins cannot yet provide quantifi-cation of carbon fluxes on a seasonal or synoptic event level. The expense of ship time and permanent moored instruments combined with the heterogeneity of ocean margins, particu-larly the region of the California Current, limits the applica-bility of oceanographic measurements to the spatial and/or temporal extrapolations necessary for detecting net air-sea exchange of CO2. And yet a complete accounting of the
1
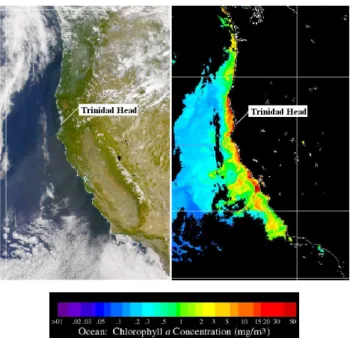
Fig. 1. Location of Trinidad Head Baseline Air Station (41.05◦N, 124.15◦W). Temperate forest ecosystems and ocean margin pro-ductivity are seen in the true color and Chlorophyll a false color images from 1 June 2003 (images courtesy of SeaWiFS and Orbim-age).
exchange of carbon at coastal margins is necessary to begin to identify regional sources and sinks, to properly balance global carbon inventories, and to predict future scenarios of the carbon cycle influenced by global change, the goals of national and international programs (Caldeira, 2001; Wofsy and Harriss, 2002).
The oxygen cycle, intimately linked to carbon fluxes through photosynthesis and respiration both on land and in the oceans, provides valuable constraints on several compo-nents of the carbon cycle (Keeling and Shertz, 1992; Bender et al., 1998; Battle et al., 2000). The separation of marine and terrestrial oxygen signals can provide further details on the sources of other trace gases, of interest in global change studies, particularly CO2and N2O (Lueker et al., 2003;
Nevi-son et al., 2004). At Trinidad Head, on the coast in northern California, continuous atmospheric records of O2/N2, CO2,
and N2O provide a direct estimate of air-sea fluxes related to
coastal upwelling. In particular, monitoring of both O2/N2
and CO2at a coastal site where strong seasonal upwelling,
high marine primary production, and rich forest ecosystems converge (Fig. 1), provides the means to detect air-sea inter-actions of the ocean margin separately from land ecosystems. Although the air-sea CO2fluxes are difficult to detect directly
due to the large terrestrial signals, the air-sea O2 fluxes are
easily detected, and the associated carbon fluxes can be in-ferred with the aid of satellite, ocean buoy, and regional hy-drographic data.
1
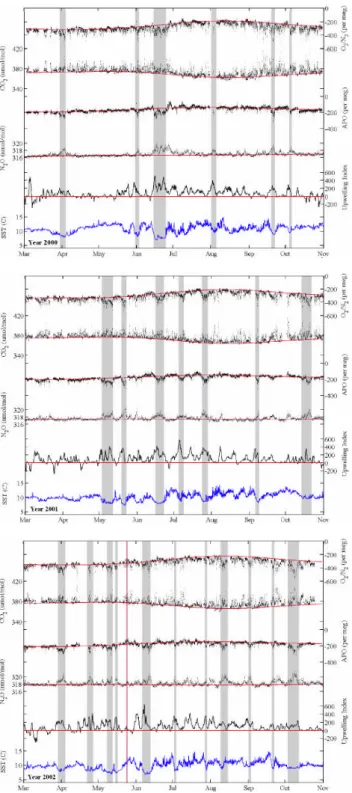
Fig. 2. Time series of atmospheric records from Trinidad Head, CA.
δ(O2/N2), CO2, APO, and N2O mole fractions shown with Bakun upwelling index at 42◦N and SSTs observed at NOAA Buoy 46 027 (41.85◦N). Background levels for O2/N2, CO2and APO (in red)
were computed from daily minimum CO2 values fit to a 3rd
or-der polynomial and 6 harmonics. N2O background data (also in
red) were fit to a 3rd order polynomial and 2 harmonics with data 2 sigma above background removed from the fit. Upwelling indices were computed from geostrophic winds derived from six-hourly synoptic and monthly mean surface atmospheric pressure fields provided by NOAA (http://www.pfeg.noaa.gov/-products/PFEL), as offshore Ekman transport in units of m3s−1(100 meters of coastline)−1.
2 The Trinidad Head Station
Trinidad California is a coastal community located 470 km north of San Francisco and 500 km south of Portland Oregon (41.05◦N, 124.15◦W) in a region where strong coastal up-welling occurs from March to October (Fig. 1)(Huyer, 1983; Strub et al., 1987a, b; Summerhayes et al., 1994; Penning-ton and Chavez, 2000). Trinidad Head, a prominent rock outcrop (120 m elevation) on the coast at Trinidad, was se-lected as a background air observatory in 1995 to monitor trace gases including N2O, CH4, and CFCs as part of the
Advanced Global Atmospheric Gases Experiment (AGAGE) (Prinn et al., 2000) (http://agage.eas.gatech.edu/home.htm). The O2/N2observatory was located adjacent to the Trinidad
Head AGAGE site to take advantage of simultaneous ob-servations of atmospheric trace gases. Trinidad Head has also served as the site of aerosol transport and ozone stud-ies and continuing observations conducted by NOAA (http: //www.cmdl.noaa.gov/aero/net/thd/).
Air is sampled from near the top of the 19 m tall USCG radio antenna tower at the peak of Trinidad Head. The at-mosphere is analyzed for CO2 concentration with a
mod-ified LICOR model 6251 CO2 analyzer. The O2
concen-tration is determined using a Servomex paramagnetic oxy-gen transducer cell (PM1155B) housed in a temperature and motion stabilized environment. Details of the experimental
procedure are published elsewhere (Manning et al., 1999; Lueker et al., 2001). Weather instruments located on the antenna tower provide data on wind direction and velocity, temperature, relative humidity, and photosynthetically active radiation (PAR) averaged over one minute intervals.
Trinidad Head has proven to be an ideal site for at-mospheric background observations of many anthropogenic trace gases (Prinn et al., 2000). The CO2 record displays
variations resulting from local meteorology and fluxes from extensive conifer forests to the east as well as local air-sea fluxes (Fig. 2). A diurnal land-breeze sea-breeze pattern dominates the record with winds in the evening to late morn-ing from the east to south-east carrymorn-ing elevated CO2 and
reduced O2/N2, the result of terrestrial respiration (Lueker et
al., 2001). In the early afternoon the winds shift to the west to north-west, bringing baseline marine air to the station until late evening, when the winds again reverse.
Superimposed over and sometimes overwhelming this di-urnal cycle are synoptic weather events that vary by season, often influencing coastal ocean circulation, and sometimes result in coastal upwelling. In spring the northward migra-tions of the Aleutian low and the north Pacific high result in general strengthening of winds from the North (Strub et al., 1987a, b; Strub and James, 1988; Summerhayes et al., 1994). North winds blowing along the coast combine with the Cori-olis force to move surface waters offshore, resulting in the upwelling of deeper waters near shore (Huyer, 1983; Sum-merhayes et al., 1994). Upwelling events, often associated with large weather systems occurring over several days, can extend up to 2000 km along the west coast of North America. Southerly winds typically weaken in late summer and fall, eventually being superceded by variable winds and extra-tropical lows associated with winter storms. The air-sea fluxes associated with these upwelling events provide readily interpretable signals of carbon dynamics in the coastal mar-gin (Pennington and Chavez, 2000; Friederich et al., 2002; Hales et al., 2003).
3 Description of the data
Atmospheric O2 is reported as the difference in the ratio
of O2/N2 measured against an arbitrary reference, and
ex-pressed in per meg units (Keeling et al., 1998).
δ(O2/N2)(per meg)=[(O2/N2)sample/(O2/N2)reference−1] × 106(1)
Note that in per meg units addition of 1 µmol of O2to 1 mole
of dry air (a change of 1 ppm) will result in an increase of 4.8 per meg.
The δO2/N2 measurements reported here are 4 min
aver-ages of analyzer data collected every 3 s. CO2measurements
are the 4 min averages corresponding to the δO2/N2 data.
Data are calibrated against compressed gases prepared and measured at the Scripps Institution of Oceanography,
trace-able to global O2/N2and CO2measurement programs
(Keel-ing et al., 1998) (Lueker et al., in preparation, 2004). 3.1 Oceanic variations in δ(O2/N2):APO
Simultaneous records of O2/N2and CO2allow separation of
marine and terrestrial signals in the δ(O2/N2)record.
Terres-trial photosynthesis and respiration result in contemporane-ous gain and release of CO2and O2to the atmosphere in a
consistent exchange ratio. Marine photosynthesis and respi-ration produce similar variations in dissolved gases, however the CO2air-sea exchange is reduced to ∼10% of the
corre-sponding O2 flux due to buffering by the ocean carbonate
chemistry. Thus, to a first order, atmospheric CO2variations
and the corresponding fraction of the O2/N2 variations can
be attributed to terrestrial processes, and the remaining O2
signal attributed to marine processes. To reveal this oceanic signal in the δ(O2/N2)record, the sum, labeled the potential
oxygen of the atmosphere (APO), is computed.
APO=δ(O2/N2) + (1.1)(4.8)(CO2−350) (2)
The factor 4.8 converts CO2 from mole fraction
(µmole/mole) to per meg units, 1.1 is the approximate O2:C exchange ratio associated with land photosynthesis
and respiration (Lueker et al., 2001), and 350 is an arbi-trary reference level. APO effectively reveals the oceanic component of the oxygen variations, because on seasonal and shorter time scales, the main source of variability is the exchange of O2 across the air-sea interface, with a small
contribution (∼10%) from air-sea exchange of CO2(Keeling
et al., 1998; Stephens et al., 1998; Gruber et al., 2001). Biomass burning and wildfires produce little change in APO, as the O2:CO2 ratio seen in fire emissions is similar to the
respiration ratio (Lueker et al., 2001). Fossil-fuel burning usually has a negligible effect on APO at Trinidad Head, given the distances to the nearest large population centers. The presence of urban air in the observations at Trinidad is indicated by anthropogenic trace gas species measured at the adjacent AGAGE facility (Prinn et al., 2000), and thus data affected by urban pollution can be removed from the records when necessary.
3.2 Coastal upwelling events
Figure 2 illustrates the seasonal cycles in O2/N2and CO2,
as well as the record of marine O2 variations expressed as
APO. Superimposed on the APO record are short (3–10 day) periods of low APO, coincident with elevated levels of N2O,
and offshore flow and reduced ocean temperatures charac-teristic of coastal upwelling conditions (Fig. 3). To high-light the upwelling events, we include in Figs. 2 and 3 the AGAGE record of N2O, the upwelling index recorded at
42◦N provided by the Pacific Fisheries Environmental Lab-oratory (http://www.pfeg.noaa.gov/products/PFEL), and the ocean temperature observations from buoy 46 027 (41.85◦N
Fig. 3. Coastal upwelling events identified in the Trinidad
atmo-spheric records. Periods of anomalously low APO are shaded in the figures for the years 2000–2002. Anomalously low oxygen cor-responds to elevated levels of N2O, reduced SSTs, and to a lesser
extent to the upwelling index at 42◦N. Note the Red line in 2002 designates the date of [O2] sampling during the Humboldt State
University summer field project.
124.38◦W) ∼100 km north of Trinidad Head operated by the NOAA National Buoy Data Center (http://www.ndbc.noaa. gov/station page.phtml?station=46027). Reduced APO co-incident with elevated N2O, positive upwelling index, and
colder water temperatures, identified with grey bands, result from the ventilation of shelf water depleted in O2 and
en-riched in N2O (Lueker et al., 2003). Seen at higher resolution
(March to October, 2000–2002, Fig. 3) the upwelling indica-tors consistently co-vary with anomalies in the atmospheric records. Note as well the diurnal respiration signals in O2/N2
and CO2. The ratio of N2O to APO variations, ∼1:104, is
consistent with the ratio of N2O excess to O2 deficit seen
in the sub-mixed layer waters of the California Current, and is characteristic of the nitrification of organic matter in the ocean interior (Nevison et al., 2004). The episodic expo-sure of these subsurface waters leads to N2O evasion and
O2 invasion in the roughly the ratio observed in the
atmo-spheric records (Lueker et al., 2002, 2003; Nevison et al., 2003, 2004).
3.3 Post upwelling plankton blooms
A closer examination of the APO and N2O variations
asso-ciated with coastal upwelling reveals interesting differences in the response of O2and N2O. While the upwelling events
are uniformly associated with depressions in APO and eleva-tions in N2O, the shapes of the onset and termination often
differ. Also, periods of positive APO anomalies often follow intense upwelling, e.g. June 2000, June and July 2001, and May 2002 (Fig. 3). SeaWiFS images show that positive APO anomalies are associated with enhanced Chlorophyll a in sur-face waters off northern California (Fig. 4). The injection of nutrients into the euphotic zone during upwelling often sup-ports a plankton bloom within the days or weeks following the cessation of the intense upwelling. The bloom, in turn, can drive a supersaturation of O2in the surface mixed layer.
The supersaturated N2O content of the upwelled surface
wa-ters is unaffected by the bloom, even while O2is ventilated
at the sea surface. The atmospheric APO and N2O
varia-tions are thus constraining two independent aspects of the coastal biogeochemistry: N2O constrains the rate of
venti-lation of subsurface waters, while APO constrains a combi-nation of subsurface ventilation and mixed-layer biological production.
A limited number of dissolved oxygen [O2] samples
col-lected 10–15 km northwest of Trinidad Head in May 2002 indicate that high APO results from marine photosynthesis. Samples to 15 m depths were collected during a period of anomalously high APO corresponding to a high productivity (Lueker et al., 2002)(red stripe in Fig. 3 indicates sampling date, [O2] results in Fig. 5). [O2] up to 180% of saturation
at the surface falling to near saturation at 15 m implies that strong production signals registered in satellite ocean color data were limited to an extremely shallow layer of the ocean. The high production characterized in APO was part of an
1
Fig. 4. SeaWiFS images (provided by ORBIMAGE). Upper panel:
Images from 16 June 2000 during an upwelling event recorded in Fig. 3. Lower Panel: Images from 27 June 2000 during the post-upwelling period correspond to the positive APO anomaly. Note the satellite view was obscured by coastal clouds south of Cape Men-docino.
anonymous period of high CHLa, resulting from enhanced Subarctic influence in the California Current in 2002 (Huyer, 2003; Thomas et al., 2003; Wheeler et al., 2003).
4 Estimating fluxes – Lagrangian (Puff) model
Atmospheric observations of the departure of APO and N2O
from background levels were combined with satellite data on surface winds and SSTs to estimate the air-sea fluxes of O2,
and N2O. We used a simple atmospheric transport (“Puff”)
model that represents the flux into a well-mixed column of air moving along the continental margin and QSCAT wind
1 -16 -14 -12 -10 -8 -6 -4 -2 0 0 50 100 150 200 O2 % saturation Depth (m) Station 3 (11 Km offshore) Station 2 (10 Km offshore) Station 1( 8.5 Km offshore) Equilibrium with atmosphere
Fig. 5. [O2] sampled off Trinidad Head in May 2002. Expressed
as % saturation, the data show [O2] with the greatest concentrations
at the surface, decreasing toward shore and with depth to near or below saturation at 15 m.
data at 0.5◦resolution to obtain the distance upwind of the station (fetch) and wind speed.
The air-sea flux into a well mixed moving column of air was represented as (Jacob, 1999)
Ft =(1Ct)(h/td)/(1− exp(−LT H/tdU)), (3) where 1Ct is the concentration anomaly, h is a vertical mix-ing height (height of the column), td is the e-folding life-time for dilution of the air in the column, LT H is the fetch and U is the wind speed over the upwelling area. The atmo-spheric column height h was estimated to be 0.4 Km based on Ozone sonds (Wendy Snible, personal communication, data provided by NOAA). The air column dilution parameter (td) when varied over a range of 12 to 24 h made little difference in the estimated fluxes (Lueker et al., 2003).
A typical O2flux for a strong upwelling event recorded in
APO was computed to be 1.6 mol m−2dy−1corresponding to winds of 15 m s−1and an atmospheric anomaly of −100 per meg (20 ppm reduction of O2from background). An
equiva-lent N2O flux was 1.8×10⁻⁴mol m−2d−1 for an anomaly
of 2.4 nmol/mol (2.4 ppb increase from background). At-mospheric anomalies in APO and N2O were combined with
Table 1. Fluxes computed for the upwelling season (March to
November) from 35 to 50◦N latitude. O2 fluxes were
com-puted with the atmospheric transport (“Puff”) model for each up-welling event using the upwind fetch and windspeed from QS-CAT data. The resulting fluxes were summed from March to November and the sum divided by the area along the coastline from 35 to 50◦N latitude with the distance offshore defined by the Rossby radius of deformation (1500×40 km). CO2flux was scaled
to the integrated O2 fluxes using air-sea gas exchange relation-ships [F=K1Ca−Cw)] predicted from regional hydrographic data (van Geen et al., 2000)(also data from WOCE P17N). Kahru and Mitchell provided satellite derived net primary production (NPP) and export production (EP) data, integrated over the same area from the VGPM model using 9 km gridded data (SeaWiFS, and MODIS) along the continental margin.
Yr O2flux CO2flux N2O flux NPP EP CO2flux
atm. Model atm. Model atm. Model % of E.P. g O2m−2 g C m−2 mmol m−2 g C m−2 g C m−2 %
2000 −86.4 3.2 0.5 67 36 8.9
2001 −80.0 3.0 0.6 71 40 7.5
2002 −124.8 4.7 1.9 80 44 10.7
from 35◦to 50◦N latitude to provide regional flux estimates. Fluxes were computed and summed over the upwelling sea-sons (March to November). O2and N2O fluxes are reported
in Table 1 (see also Nevison et al., 2004).
5 Estimating upwelling CO2fluxes with a gas exchange
model and local hydrography
Air-sea fluxes during coastal upwelling result in net uptake of atmospheric O2and a concomitant release of marine CO2,
due to high pCO2levels in the upwelled seawater. Estimation
of CO2 fluxes directly from anomalies in the atmospheric
record is problematic because of terrestrial CO2 variations
that are an order of magnitude larger than the marine CO2
flux. However, characterization of the [O2] and pCO2
inven-tories in upwelled waters enables the CO2fluxes to be related
to the O2fluxes observed in the APO record.
A gas exchange model was applied to observed winds and SSTs during upwelling conditions. The [O2] and pCO2 in
freshly upwelled waters were predicted from SSTs based on hydrographic observations along the continental margin of the northwest U.S. (Fig. 6). The available data indicate ap-proximately consistent variation of [N2O], [O2], and pCO2
with temperature. The co-variation of these dissolved gases with ocean temperature results from a characteristic balance between remineralization of organic matter, pre-formed gas inventories, and ocean mixing over the geographic area and temperature range of upwelled waters observed between 38◦ to 43◦N. Hydrographic profiles are potentially more consis-tent than surface observations for characterizing the gas pres-sure of newly upwelled water, since air-sea gas transfer and
subsequent primary production have not yet altered the gas content of samples collected at depth. Recent observations show large variations occur in nearshore [O2] and pCO2
lev-els in response to interannual variability in California Cur-rent dynamics (Hales et al., 2003; Grantham et al., 2004). While abnormal circulation can bring anomalous [O2] and
pCO2levels to the surface during upwelling conditions, even
these extreme departures in [O2] off the Oregon coast in 2002
(Wheeler et al., 2003) fall within the data envelopes shown in Fig. 6.
Profiles of N2O, O2 and CO2, available for the coastal
margin between 35◦ and 45◦N latitude from Van Geen et al., and WOCE leg P17 (van Geen et al., 2000)(http://whpo. ucsd.edu), demonstrate the functional relationship with tem-perature (Fig. 6). The CO2flux is then formulated
F=K(1pCO2), (4)
where K, the gas exchange coefficient is a function of SST and wind speed (Wanninkhof, 1992). The gas exchange model was also applied to upwelling N2O and O2fluxes and
was found to give results consistent with estimates based on the “Puff” model (Lueker et al., 2003; Nevison et al., 2004). To demonstrate the dynamic relationship of air-sea fluxes of O2 and CO2 over a range of observed upwelling
condi-tions, fluxes were modeled from observed wind speeds and SSTs (Fig. 7). Dissolved Inorganic Carbon (DIC) and Alka-linity (ALK) profile data were converted to pCO2using
car-bonate dissociation constants experimentally shown to be ap-propriate for pCO2formulations (Lueker et al., 2000). Over
the range of observed wind speeds and upwelled ocean tem-peratures along the coastline, CO2 flux varies from 12%
of the O2 flux at 7◦C to 6% of the O2 flux at 11◦C.
Red-field ratios of marine organic matter predict an C:O2ratio of
117/170, however the carbonate equilibria in seawater result in much smaller CO2:O2 ratios in the air-sea flux (Keeling
et al., 1998; Stephens et al., 1998). CO2upwelling fluxes,
scaled to the regional O2fluxes for the years 2000, 2001 and
2002 are given in Table 1. An APO anomaly of 100 per meg has a predicted CO2atmospheric anomaly of about 2 ppm.
It is important to note that the Temperature-pCO2
rela-tionship shown in Fig. 6 is applicable only below seawater temperatures of 11◦C, and only for recently upwelled waters in the California Current. After upwelling, changes in wind driven circulation, warming of the mixed layer, and photo-synthesis and/or respiration processes can modify the pCO2
and temperature at different rates and in different directions. The variability of pCO2in surface waters can be seen in the
data to the left of the dashed blue line (atmospheric equi-librium) in Fig. 6. Additional examples of the variability of Temperature vs. pCO2 in surface waters of the
Califor-nia Current have been shown by Hales et al. (2003b, 2004) and Freiderich et al. (2002). In these studies, different corre-lations between pCO2and Temperature are evident, although
more scattered due to temporal and special variability, espe-cially in waters from the surface to 20 m depths.
4 5 6 7 8 9 10 11 12 13 14 15 0 100 200 300 400 [O2] ( µmol kg -1 ) Temp (°C) 39° N 124° W (multi stations) 44.6° N 125.1° W STN 1 44.6° N 125.1° W STN 2 Interpolation [O2] vs. Temperature 5 6 7 8 9 10 11 12 13 14 15 0 200 400 600 800 1000 1200 pCO2 (µatm) Temperature (°C) 43.2° N 125.0° W 41.9° N 124.8° W 43.2° N 124.4° W surface Atmosphere 38.3° N 125.0° W Data used for fit Interpolation pCO2 vs Temp 3 4 5 6 7 8 9 10 11 12 13 14 0 10 20 30 40 50 60 [N2O] (nmol/kg) Temperature (°C) 36.3° N 122.1° W 44.6° N 125.1° W STN 1 44.6° N 125.1° W STN 2 Interpolation [N2O] vs. Temperature
Fig. 6. Hydrographic profile data from the Pacific Northwest plotted vs. temperature. Data from several cruises located from Oregon to
central California and 1990 to 1998 are represented in plots of [O2], [N2O] and pCO2. Linear fits provide equations for interpolation of chemical species concentrations as a function of upwelled water temperature, shown as lines in the figures. The DIC and ALK data collected on the cruises were converted to pCO2to provide a linear relationship with temperature for interpolation of pCO2(Lueker et al., 2000).
7.0 8.0 9.0 10.0 11.0 -3.50 -3.00 -2.50 -2.00 -1.50 -1.00 -0.50 0.00 0.50 1.00
Sea - Air Flux (mol m-2 dy-1)
Temperature (°C)
O2 flux for 15 m/s winds CO2 flux for 15 m/s winds
Fig. 7. Modeled O2and CO2fluxes as a function of SSTs during
upwelling conditions. [O2] and pCO2were inferred as a function of upwelled water temperature from interpolations shown in Fig. 6. Positive flux is to the atmosphere. Upwelling fluxes calculated for 15 m/s winds of 24 h duration and variable SSTs. As colder water upwells to the surface the CO2flux relative to O2increases from
6% (at 11◦C) to 12% (at 7◦C).
6 Estimates of carbon uptake in coastal waters
How do upwelling CO2 fluxes compare to the “continental
shelf pump” or net air-sea fluxes along the coastal margin of North America? While the direction of net air-sea flux of CO2 remains a topic of active research and debate, an
esti-mate is provided from satellite ocean color and SST data. Upwelling CO2fluxes were compared to net primary
pro-duction (NPP) and export propro-duction (EP) in the coastal re-gion. Coastal ocean NPP was evaluated from ocean color and SST data (SeaWiFS and MODIS) (M. Kahru, personal com-munication, 2003, see also Behrenfeld and Falkowski, 1997; Mitchell and Kahru, 1998; Kahru and Mitchell, 2002). Six regions offshore of the west coast of North America were evaluated using a Behrenfeld-Falkowski vertically general-ized production model (VGPM) (Laws, 2004a) correspond-ing to the years of our record at Trinidad Head (2000–2002). Integrating the model productivity over the coastal region from 35◦–50◦N, NPP was estimated over the same time in-tervals as the upwelling sea-air flux of CO2 reported in
Ta-ble 1. Export production of the coastal margin was also esti-mated from the combination of satellite ocean color and tem-perature data. The export production of the coastal area was predicted to be about 55% of NPP. The CO2upwelling flux
was about 5% of NPP, or 10% of EP. Recent studies sug-gest the modeled export production might be over-estimated in upwelling areas (Laws, 2004b), so the 10% value might represent a lower limit for ventilation of CO2sequestered by
export production along the coastal margin.
The CO2 fluxes reported in Table 1 are the first attempt
to quantify the air-sea fluxes related to seasonal upwelling events in the Calcofi Current. In addition to uncertainties
arising from variations in the derived T vs. pCO2relationship
shown in Fig. 6, the geographical extent of upwelled waters is highly uncertain. Future studies combining satellite SST and scatterometer winds with additional hydrographic pCO2
data will reduce these uncertainties and provide improved es-timates of these significant sea-air CO2fluxes.
7 Summary
A relevant question for the budgeting of carbon exchange fluxes over the North American concerns the modification of the CO2content of air from air-sea fluxes over the continental
margins. Upwelling ventilates ocean margin CO2, directly
impacting the marine air, characterized as “baseline”, as we have documented at Trinidad Head. Furthermore, changes in the frequency and magnitude of wind driven coastal up-welling in response to future climate change are potentially large (Miller et al., 2003). Continuous records of O2/N2,
CO2and N2O obtained at Trinidad capture the effects of
air-sea exchange during coastal upwelling and plankton bloom events. These observations provide direct evidence of the magnitude of air-sea fluxes and demonstrate the importance of synoptic scale events on the overall carbon budget in the coastal margin of western North America. Meteorological and satellite observations of winds and surface ocean temper-ature provide means to calculate 1st order fluxes on an event by event scale. The consistency of dissolved gas concentra-tions in subsurface waters of the California Current provides an estimate of CO2 upwelling fluxes that can be scaled to
atmospheric O2/N2 observations, providing a means to
as-sess coastal CO2fluxes during upwelling events. Upwelling
fluxes could represent upwards of 10% of coastal margin ex-port production along the west coast of North America.
Acknowledgements. This study was funded by NASA ESE under
grants NAG5-6179 and NAG5-10737, and was made possible by generous assistance and input from the staff of the Atmo-spheric Oxygen Research Group at S.I.O. especially R. Keeling, P. I. S. Walker provided computer programming and data analysis, B. Paplawski, engineering and chemical expertise, A. Cox, gas cylinder preparation and handling, J. Cooper, data processing, and A. Hartounian, PC and instrument fabrication and software support. N2O data were provided by the AGAGE program at
S.I.O. headed by R. Weiss. P. Salameh and C. Harth provided AGAGE data support. N2O data provided by G. Friederich and
M. Volmer. Trinidad Station support was provided by W. Snible and R. Dickau. Shipboard sample collection and analyses were provided by R. Barnes at H.S.U. B. G. Mitchell and M. Kahru provided discussion and results and from the VGPM model runs. This manuscript is the product of many valuable discussions with colleagues, including C. Nevison (NCAR), R. Hamme (S.I.O.), B. Miller (S.I.O.), B. Hales (O.S.U.), D. Chelton (O.S.U.), and others.
References
Alvarez-Salgado, X. A., Doval, M. D., Borges, A. V., Joint, I., Frankignoulle, M., Woodward, E. M. S., and Figueiras, F. G.: Off-shelf fluxes of labile materials by an upwelling filament in the NW Iberian Upwelling System (Review), Progress in Oceanography, 51, 321–337, 2001.
Aumont, O., Orr, J. C., Monfray, P., Ludwig, W., Amiotte-Suchet, P., and Probst, J. L.: Riverine-driven interhemispheric transport of carbon, Global Biogeochemical Cycles, 15, 393–405, 2001. Barth, J. A., Cowles, T. J., Kosro, P. M., Shearman, R. K., Huyer,
A., and Smith, R. L.: Injection of carbon from the shelf to off-shore beneath the euphotic zone in the California Current, J. Geo-phys. Res.-O, 107, art. no. 3057, 10-1–10-6, 2002.
Battle, M., Bender, M. L., Tans, P. P., White, J. W. C., Ellis, J. T., Conway, T., and Francey, R. J.: Global carbon sinks and their variability inferred from atmospheric O-2 and delta C-13, Sci-ence, 287, 2467–2470, 2000.
Behrenfeld, M. J. and Falkowski, P. G.: Photosynthetic Rates De-rived from Satellite-Based Chlorophyll Concentration, Limnol-ogy & Oceanography, 42, 1–20, 1997.
Bender, M. L., Battle, M., and Keeling, R. F.: The O-2 balance of the atmosphere: A tool for studying the fate of fossil-fuel CO2,
Annual Review of Energy and the Environment, 23, 207–223, 1998.
Borges, A. V., Djenidi, S., Lacroix, G., Theate, J., Delille, B., and Frankignoulle, M.: Atmospheric CO2flux from mangrove sur-rounding waters, Geophys. Res. Lett., art. no. 1558, 30, 12-1– 12-3, 2003.
Caldeira, K. D., De Baar, Hein, Gruber, N., Sabine, C., and Wallace, D. W. R.: JGOFS report no. 33 – Joint IGBP EU-US meeting on the ocean component of an integrated carbon cycle science framework, Paris, 2001.
Chavez, F. P., Pennington, J. T., Castro, C. G., Ryan, J. P., Michisaki, R. P., Schlining, B., et al.: Biological and chemical consequences of the 1997–1998 El Nino in central California wa-ters, Progress in Oceanography, 54, 205–232, 2002.
Chavez, F. P., Ryan, J., Lluch-Cota, S. E., and Niquen, M.: From anchovies to sardines and back: Multidecadal change in the Pa-cific Ocean (Review), Science, 299, 217–221, 2003.
Dickens, A. F., Gelinas, Y., Masiello, C. A., Wakeham, S., and Hedges, J. I.: Reburial of fossil organic carbon in marine sed-iments, Nature, 427, 336–339, 2004.
Doney, S. C.: Major challenges confronting marine biogeochemical modeling, Global Biogeochemical Cycles, 13, 705–714, 1999. Frankignoulle, M. and Borges, A. V.: European continental shelf
as a significant sink for atmospheric carbon dioxide, Global Bio-geochemical Cycles, 15, 569–576, 2001.
Friederich, G. E., Walz, P. M., Burczynski, M. G., and Chavez, F. P.: Inorganic carbon in the central California upwelling system dur-ing the 1997–1999 El Nino-La Nina event, Progress in Oceanog-raphy, 54, 185–203, 2002.
Grantham, B. A., Chan, F., Nielsen, K. J., Fox, D. S., Barth, J. A., Huyer, A., et al.: Upwelling-driven nearshore hypoxia signals ecosystem and oceanographic changes in the northeast Pacific, Nature, 429, 749–754, 2004.
Gruber, N., Gloor, M., Fan, S. M., and Sarmiento, J. L.: Air-sea flux of oxygen estimated from bulk data: Implications for the marine and atmospheric oxygen cycles (Review), Global Biogeochemi-cal Cycles, 15, 783–803, 2001.
Hales, B., Karp-Boss, L., Moum, J., Wheeler, P., Covert, P., and Bandstra, L.: Off-Shelf Export of POC from the Oregon Coast: Implications for Uptake of Atmospheric CO2, Eos Trans. AGU, Ocean Sci. Meet. Suppl., Abstract, 84, Abstract OS51L-02, 2003.
Hayward, T. L., Baumgartner, T. R., Checkley, D. M., Durazo, R., Gaxiola-Castro, G., Hyrenbach, K. D., et al.: The state of the California Current in 1998–1999: Transition to cool-water con-ditions, California Cooperative Oceanic Fisheries Investigations Reports, 40, 29–62, 1999.
Hill, J. K. and Wheeler, P. A.: Organic carbon and nitrogen in the northern California current system: comparison of offshore, river plume, and coastally upwelled waters (Review), Progress in Oceanography, 53, 369–387, 2002.
Huyer, A.: Coastal upwelling in the California Current system, Progress in Oceanography, 12, 259–284, 1983.
Huyer, A.: Preface to special section on enhanced Subarctic influ-ence in the California Current, 2002, art. no. 8019, Geophys. Res. Lett., 30, 8019, CCR-1-1–CCR-1-3, 2003.
Ianson, D., Allen, S. E., Harris, S. L., Orians, K. J., Varela, D. E., and Wong, C. S.: The inorganic carbon system in the coastal up-welling region west of Vancouver Island, Canada, Deep-Sea Re-search Part I – Oceanographic ReRe-search Papers, 50, 1023–1042, 2003.
Jacob, D.: Introduction to atmospheric chemistry, Princeton, NJ, Princeton university press, 1999.
Kahru, M. and Mitchell, B. G.: Influence of the El Nino-La Nina cycle on satellite-derived primary production in the California Current, Geophys. Res. Lett., 29, art. no. 1846, 27-1–27-3, 2002. Keeling, R. F. and Shertz, S. R.: Seasonal and Interannual Vari-ations in Atmospheric Oxygen and ImplicVari-ations for the Global Carbon Cycle, Nature, 358, 723–727, 1992.
Keeling, R. F., Manning, A. C., McEvoy, E. M., and Shertz, S. R.: Methods for Measuring Changes in Atmospheric O-2 Concentra-tion and Their ApplicaConcentra-tion in Southern Hemisphere Air, J. Geo-phys. Res.-A, 103, 3381–3397, 1998.
Laws, E.: Export flux and stability as regulators of community com-position in pelagic marine biological communities: implications for regime shifts (Review), Progress in Oceanography, 60, 343– 354, 2004a.
Laws, E. A.: New production in the equatorial Pacific: a compari-son of field data with estimates derived from empirical and the-oretical models, Deep-Sea Research Part I – Oceanographic Re-search Papers, 51, 205–211, 2004b.
Liu, K. K., Peng, T. H., Shaw, P. T., and Shiah, F. K.: Circula-tion and biogeochemical processes in the East China Sea and the vicinity of Taiwan: an overview and a brief synthesis, Deep-Sea Research Part II – Topical Studies in Oceanography, 50, 1055– 1064, 2003.
Ludwig, W., Probst, J. L., and Kempe, S.: Predicting the oceanic input of organic carbon by continental erosion (Review), Global Biogeochemical Cycles, 10, 23–41, 1996.
Lueker, T. J., Dickson, A. G., and Keeling, C. D.: Ocean pCO(2) calculated from dissolved inorganic carbon, alkalinity, and equa-tions for K-1 and K-2: validation based on laboratory measure-ments of CO2 in gas and seawater at equilibrium, Marine Chem-istry, 70, 105–119, 2000.
Lueker, T. J., Keeling, R. F., and Dubey, M. K.: The oxygen to carbon dioxide ratios observed in emissions from a wildfire in
Northern California, Geophys. Res. Lett., 28, 2413–2416, 2001. Lueker, T. J., Keeling, R. F., and Barnes, R.: Coastal upwelling and plankton bloom dynamics observed in atmospheric O2/N2 and CO2 records at Trinidad, California, in: Eos Trans. AGU, San Francisco: Eos Trans. AGU, OS62A-0231, 2002.
Lueker, T. J., Walker, S. J., Vollmer, M. K., Keeling, R. F., Nevison, C. D., Weiss, R. F., and Garcia, H. E.: Coastal upwelling air-sea fluxes revealed in atmospheric observations of O2/N2, CO2 and N2O, Geophys. Res. Lett., 30, 25-1–25-4, 2003.
Mangelsdorf, K., Guntner, U., and Rullkotter, J.: Climatic and oceanographic variations on the California continental margin during the last 160 kyr, Organic Geochemistry, 31, 829–846, 2000.
Manning, A. C., Keeling, R. F., and Severinghaus, J. P.: Precise atmospheric oxygen measurements with a paramagnetic oxygen analyzer, Global Biogeochemical Cycles, 13, 1107–1115, 1999. Miller, A. J., Alexander, M. A., Boer, G. J., Chai, F., Denman, K., Erickson, D. J., et al.: Potential feedbacks between Pacific Ocean ecosystems and interdecadal climate variations (Review), Bulletin of the American Meteorological Society, 84, 617–633, 2003.
Mitchell, B. G. and Kahru, M.: Algorithms for SeaWiFS standard products developed with the CalCOFI big-optical data set, Cali-fornia Cooperative Oceanic Fisheries Investigations Reports,39, 133–147, 1998.
Murphree, T., Bograd, S. J., Schwing, F. B., and Ford, B.: Large scale atmosphere-ocean anomalies in the northeast Pacific during 2002, Geophys. Res. Lett., 30, art. no. 8026, 2003a.
Murphree, T., Green-Jessen, P., Schwing, F. B., and Bograd, S. J.: The seasonal cycle of wind stress curl and its relationship to subsurface ocean temperature in the Northeast Pacific, Geophys. Res. Lett., 30, art. no. 1469, 2003b.
Nevison, C. D., Lueker, T. J., and Weiss, R. F.: Quantifying the Ni-trous Oxide Source from Coastal Upwelling, Eos Trans. AGU, Ocean Sci. Meet. Suppl., Abstract, 84, Abstract OS32D-01, 2003.
Nevison, C. D., Lueker, T. J., and Weiss, R. F.: Qualifying the Ni-trous Oxide source from coastal upwelling, Global Biogeochem-ical Cycles, 18, doi:10.1029/2003GB002110, 2004.
Opsahl, S. and Benner, R.: Distribution and Cycling of Terrigenous Dissolved Organic Matter in the Ocean, Nature, 386, 480–482, 1997.
Otsuki, A. S., Watanabe, S., and Tsunogai, S.: Absorption of at-mospheric CO2 and its transport to the intermediate layer in the Okhotsk Sea, Journal of Oceanography, 59, 709–717, 2003. Pacala, S. W., Hurtt, G. C., Baker, D., Peylin, P., Houghton, R. A.,
Birdsey, R. A., et al.: Consistent land- and atmosphere-based US carbon sink estimates, Science, 292, 2316–2320, 2001.
Pennington, J. T. and Chavez, F. P.: Seasonal fluctuations of tem-perature, salinity, nitrate, chlorophyll and primary production at station H3/M1 over 1989–1996 in Monterey Bay, California, Deep-Sea Research, Part II – Topical Studies in Oceanography, 47, 947–973, 2000.
Plattner, G., Frenzel, H., Gruber, N., Leinweber, A., Marchesiello, P., McWilliams, J. C., et al.: Physical-Biogeochemical Interac-tions and CO2 Air-Sea Exchange Along the U.S. West Coast, Eos Trans. AGU, Ocean Sci. Meet. Suppl., Abstract, 84, Abstract OS51L-01, 2003.
Prinn, R. G., Weiss, R. F., Fraser, P. J., Simmonds, P. G., Cunnold,
D. M., Alyea, F. N., et al.: A history of chemically and radia-tively important gases in air deduced from ALE/GAGE/AGAGE, J. Geophys. Res.-A, 105, 17 751–17 792, 2000.
Sarmiento, J. L. and Gruber, N.: Sinks for anthropogenic carbon, Physics Today, 55, 30–36, 2002.
Schwing, F. B., Murphree, T., and Green, P. M.: The Northern Os-cillation Index (NOI): a new climate index for the northeast Pa-cific (Review), Progress in Oceanography, 53, 115–139, 2002a. Schwing, F. B., Murphree, T., deWitt, L., and Green, P. M.: The
evolution of oceanic and atmospheric anomalies in the northeast Pacific during the El Nino and La Nina events of 1995–2001, Progress in Oceanography, 54, 459–491, 2002b.
Stephens, B. B., Keeling, R. F., Heimann, M., Six, K. D., Murnane, R., and Caldeira, K.: Testing global ocean carbon cycle models using measurements of atmospheric O-2 and CO2 concentration, Global Biogeochemical Cycles, 12, 213–230, 1998.
Strub, P. T. and James, C.: Atmospheric Conditions During the Spring and Fall Transitions in the Coastal Ocean Off Western United-States, J. Geophys. Res.-O, 93, 15 561–15 584, 1988. Strub, P. T., Allen, J. S., Huyer, A., and Smith, R. L.: Large-Scale
Structure of the Spring Transition in the Coastal Ocean Off West-ern North-America, J. Geophys. Res.-O, 92, 1527–1544, 1987a. Strub, P. T., Allen, J. S., Huyer, A., Smith, R. L., and Beardsley, R. C.: Seasonal Cycles of Currents, Temperatures, Winds, and Sea-Level over the Northeast Pacific Continental-Shelf – 35-Degrees-N to 48-Degrees-35-Degrees-N, J. Geophys. Res.-O, 92, 1507–1526, 1987b. Summerhayes, C. P., Emeis, K.-C., Angel, M. V., Smith, R. L., and Zeitzschel, B.: Upwelling in the Ocean Modern Processes and Ancient Records, in: Dahlem Workshop on Upwelling in the Ocean: Modern Processes and Ancient Records, edited by Sum-merhayes, C. P., Emeis, K.-C., Angel, M. V., Smith, R. L., and Zeitzschel, B., Berlin, John Wiley and Sons, 422, 1994. Takahashi, T., Sutherland, S. C., Sweeney, C., Poisson, A., Metzl,
N., Tilbrook, B., et al.: Global sea-air CO2flux based on
clima-tological surface ocean pCO2, and seasonal biological and tem-perature effects, Deep-Sea Research Part II – Topical Studies in Oceanography, 49, 1601–1622, 2002.
Thomas, A. C., Strub, P. T., and Brickley, P.: Anomalous satellite-measured chlorophyll concentrations in the northern California Current in 2001–2002, Geophys. Res. Lett., 30, art. no. 8022, 2003.
Thomas, H., Bozec, Y., Elkalay, K., and de Baar, H. J. W.: Enhanced open ocean storage of CO2 from shelf sea pumping, Science, 304, 1005–1008, 2004.
Tsunogai, S., Watanabe, S., and Sato, T.: Is there a “continental shelf pump” for the absorption of atmospheric CO2?, Tellus Se-ries B – Chemical & Physical Meteorology, 51, 701–712, 1999. van Geen, A., Takesue, R. K., Goddard, J., Takahashi, T., Barth,
J. A., and Smith, R. L.: Carbon and nutrient dynamics during coastal upwelling off Cape Blanco, Oregon, Deep-Sea Research Part II – Topical Studies in Oceanography, 47, 975–1002, 2000. Walsh, J. J.: Importance of Continental Margins in the Marine
Bio-geochemical Cycling of Carbon and Nitrogen, Nature, 350, 53– 55, 1991.
Wanninkhof, R.: Relationship between Wind Speed and Gas Ex-change over the Ocean, J. Geophys. Res.-O, 97, 7373–7382, 1992.
Wheeler, P. A., Huyer, A., and Fleischbein, J.: Cold halocline, increased nutrients and higher chlorophyll off Oregon in 2002,
Geophys. Res. Lett., 30, art. no. 8021, 2003.
Wofsy, S. C. and Harriss, R. J.: The North American Carbon Pro-gram (NACP), in: Agencies of the U.S. Global Change Research Program, 1–62, 2002.
Yool, A. and Fasham, M. J. R.: An examination of the “continental shelf pump” in an open ocean general circulation model, Global Biogeochemical Cycles, 15, 831–844, 2001.
![Fig. 5. [O 2 ] sampled off Trinidad Head in May 2002. Expressed as % saturation, the data show [O 2 ] with the greatest concentrations at the surface, decreasing toward shore and with depth to near or below saturation at 15 m.](https://thumb-eu.123doks.com/thumbv2/123doknet/14741927.576754/6.892.467.811.92.537/sampled-trinidad-expressed-saturation-greatest-concentrations-decreasing-saturation.webp)

![Fig. 6. Hydrographic profile data from the Pacific Northwest plotted vs. temperature. Data from several cruises located from Oregon to central California and 1990 to 1998 are represented in plots of [O 2 ], [N 2 O] and pCO 2](https://thumb-eu.123doks.com/thumbv2/123doknet/14741927.576754/8.892.95.800.95.935/hydrographic-profile-pacific-northwest-plotted-temperature-california-represented.webp)

