HAL Id: inserm-01856125
https://www.hal.inserm.fr/inserm-01856125
Submitted on 9 Aug 2018
HAL is a multi-disciplinary open access
archive for the deposit and dissemination of
sci-entific research documents, whether they are
pub-lished or not. The documents may come from
teaching and research institutions in France or
abroad, or from public or private research centers.
L’archive ouverte pluridisciplinaire HAL, est
destinée au dépôt et à la diffusion de documents
scientifiques de niveau recherche, publiés ou non,
émanant des établissements d’enseignement et de
recherche français ou étrangers, des laboratoires
publics ou privés.
Impact of the EARL harmonization program on
automatic delineation of metabolic active tumour
volumes (MATVs)
Charline Lasnon, Blandine Enilorac, Hosni Popotte, Nicolas Aide
To cite this version:
Charline Lasnon, Blandine Enilorac, Hosni Popotte, Nicolas Aide. Impact of the EARL harmonization
program on automatic delineation of metabolic active tumour volumes (MATVs). EJNMMI Research,
SpringerOpen, 2017, 7 (1), �10.1186/s13550-017-0279-y�. �inserm-01856125�
S H O R T C O M M U N I C A T I O N
Open Access
Impact of the EARL harmonization program
on automatic delineation of metabolic
active tumour volumes (MATVs)
Charline Lasnon
1,2†, Blandine Enilorac
3†, Hosni Popotte
4and Nicolas Aide
2,3,5*Abstract
Background: The clinical validation of the EARL harmonization program for standardised uptake value (SUV) metrics is well documented; however, its potential for defining metabolic active tumour volume (MATV) has not yet been investigated. We aimed to compare delineation of MATV on images reconstructed using conventional ordered subset expectation maximisation (OSEM) with those reconstructed using point spread function modelling (PSF-reconstructed images), and either optimised for diagnostic potential (PSF) or filtered to meet the EANM/EARL harmonising standards (PSF7).
Methods: Images from 18 stage IIIA-IIIB lung cancer patients were reconstructed using all the three methods. MATVs were then delineated using both a 40% isocontour and a gradient-based method. MATVs were compared by means of Bland–Altman analyses, and Dice coefficients and concordance indices based on the unions and intersections between each pair of reconstructions (PSF vs OSEM, PSF7vs PSF and PSF7vs OSEM).
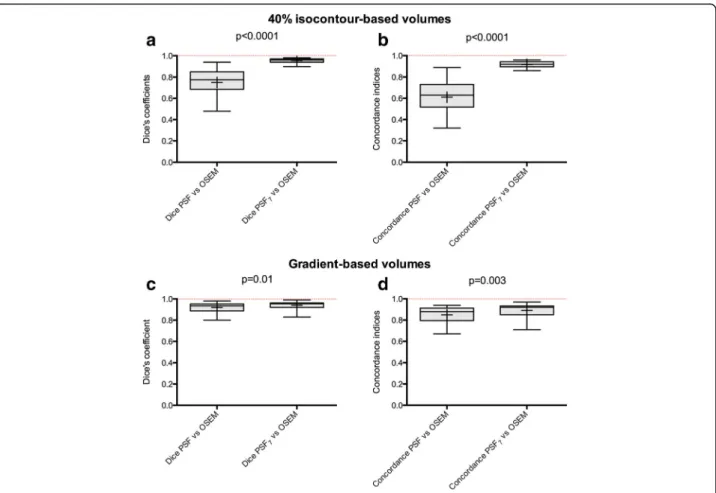
Results: Using the 40% isocontour method and taking the MATVs delineated on OSEM images as a reference standard, the use of PSF7images led to significantly higher Dice coefficients (median value = 0.96 vs 0.77;P < 0.0001)
and concordance indices (median value = 0.92 vs 0.64;P < 0.0001) than those obtained using PSF images.
The gradient-based methodology was less sensitive to reconstruction variability than the 40% isocontour method; Dice coefficients and concordance indices were superior to 0.8 for both PSF reconstruction methods. However, the use of PSF7images led to narrower interquartile ranges and significantly higher Dice coefficients (median value = 0.96 vs 0.94;
P = 0.01) and concordance indices (median value = 0.89 vs 0.85; P = 0.003) than those obtained with PSF images. Conclusion: This study demonstrates that automatic contouring of lung tumours on EARL-compliant PSF images using the widely adopted automatic isocontour methodology is an accurate means of overcoming reconstruction variability in MATV delineation. Although gradient-based methodology appears to be less sensitive to reconstruction variability, the use of EARL-compliant PSF images significantly improved the Dice coefficients and concordance indices, demonstrating the importance of harmonised-images, even when more advanced contouring algorithms are used. Keywords: FDG, PET, MATV, Harmonization, EARL accreditation program
* Correspondence:aide-n@chu-caen.fr
†Equal contributors 2
INSERM U1086 « ANTICIPE », BioTICLA, François Baclesse Cancer Centre, Caen, France
3Nuclear Medicine Department, University Hospital, Avenue Côte de Nacre, 14000 Caen, France
Full list of author information is available at the end of the article
© The Author(s). 2017 Open Access This article is distributed under the terms of the Creative Commons Attribution 4.0 International License (http://creativecommons.org/licenses/by/4.0/), which permits unrestricted use, distribution, and reproduction in any medium, provided you give appropriate credit to the original author(s) and the source, provide a link to the Creative Commons license, and indicate if changes were made.
Background
Although standard metrics such as standardised uptake values (either SUVmax or SUVpeak) are widely used as
prognostic tools or for monitoring of therapy in cancer treatment [1], metabolically active tumour volume (MATV) has recently been receiving a lot of interest as a pretreatment prognostic tool for various types of can-cer [2–5]. Delineation of MATV is also useful for radio-therapy planning in various types of cancer, including non-small cell lung cancer (NSCLC) [6]. This growing interest in MATV is illustrated in Fig. 1, which shows the number of articles using MATV published over the past 10 years. The impact of PET imaging parameters and automatic tumour delineation in radiotherapy plan-ning has been well documented [7–9] and has indicated a requirement for improved delineation methodologies. Recent studies in non-Hodgkin lymphoma (NHL) have shown high MATV to be predictive of overall survival [10]; although, widely disparate cut-off values have been used, which have fuelled the ongoing discussion on the need to standardise the quality of PET images and delin-eation methods.
Harmonization programs, such as the EANM/EARL (European Association of Nuclear Medicine/EANM Re-search Ltd) accreditation program [11], are designed to harmonise data acquisition, processing, and analysis to fa-cilitate comparisons of PET quantitative values within multicentre trials, or in sites equipped with multiple PET/ CT scanners, regardless of the PET/CT system used. Given that centres running PET systems with advanced re-construction algorithms often wish to use them with pa-rameters chosen to achieve optimal lesion detection, EARL-accredited centres tend to use two-PET datasets: one for optimal lesion detection and image interpretation and another filtered for harmonised quantification [12].
The EARL program has been well validated for stand-ard SUV metrics [12–15], but clinical validation of this harmonization program for MATV delineation is still
lacking. This study examined MATVs delineated in stage IIIA-IIIB lung cancer patients, with the aim of compar-ing MATVs in PSF-reconstructed images optimised for diagnosis (PSF), PSF-reconstructed images with a filter chosen to meet harmonising standards (PSF7), and
EARL-compliant images reconstructed using ordered subset expectation maximisation (OSEM). Stage III NSCLCs were chosen, as these stages are typically treated by radiation therapy or radio-chemotherapy, and many centres use FDG PET MATV delineation to opti-mise tumour targeting. MATVs were compared not only in terms of absolute and relative values but also using a concordance measure, which gives a representative geo-metrical description of changes in MATV, combining both volume and positional differences [16].
Methods
Patient selection
Eighteen consecutive biopsy-proven stage IIIA-IIIB lung cancer patients who had been scanned for staging pur-poses were included in this retrospective study. This study was approved by the local ethics committee (Ref A12-D24-VOL13, Comité de protection des personnes Nord-Ouest III), and the requirement for informed con-sent was waived.
PET/CT examinations
Patients who had fasted for 6 h previous to the examin-ation were injected with 18F-FDG after 15-min of rest in a warm room (mean injected dose ±SD = 3.89 ± 0.44 MBq/Kg). All PET imaging studies were performed 60 ± 5 min post injection, on a Biograph TrueV system (Siemens Medical Solutions, Erlangen, Germany), with a 6-slice spiral CT component, according to the EANM guidelines [17].
A free-breathing CT acquisition was performed first, using the following parameters: 60 mAs, 130 kVp, pitch 1, and 6 × 2-mm collimation. The PET emission acquisi-tion was then subsequently performed in a 3-D mode. Patients were scanned from the skull base to the mid-thighs, with time per bed acquisitions of 160 and 220 s for normal weight (BMI≤25 kg/m2) and overweight pa-tients (BMI >25 kg/m2), respectively.
PET reconstruction
The Biograph TrueV system is equipped with PSF recon-struction (HD; TrueX, Siemens Medical Solutions) but has no time of flight capability.
The standard reconstruction used in our department was a PSF reconstruction algorithm (HD; TrueX, Sie-mens Medical Solutions; 3 iterations and 21 subsets) without filtering. We did not use any post filtering as modelling the PSF during the iterative reconstruction in-troduces correlations between neighbouring voxels in a Fig. 1 Numbers of articles related to MATV as a function of the year
of publication. Publications were identified using a MEDLINE search with the following enquiry: (“MATV” or “MTV”) and “PET”. Only human studies were included
manner similar to smoothing filters and thus has been shown to achieve maximal performance with little to no filtering [18]. Raw data were also reconstructed with an OSEM reconstruction algorithm (4 iterations and 8 sub-sets), and a PSF reconstruction algorithm (3 iterations and 21 subsets) incorporating a 7-mm Gaussian filter (PSF7). As shown in a previous study [12], this latter
re-construction leads to protocol-specific images with NEMA NU-2 phantom-based filtering that meet EANM 1.0 quantitative harmonisation standards. The OSEM re-construction parameters also met the EANM require-ments on activity recovery.
The matrix size for all reconstructions was 168 × 168 voxels, resulting in isotropic voxels of 4.07 × 4.07 × 4.07 mm. Scatter and CT attenuation corrections were also applied.
PET tumour delineation
PET images were contoured by two experienced PET readers using MIM image-contouring tools (MIM-5.6, MIM Software Inc, Cleveland, OH). Two different con-touring methods were performed, a 40% of SUVmax
thresholding technique and a gradient-based technique involving the PET edge contouring tool [19, 20]. The procedures focused only on the primary tumour and did not include involved node(s), except in cases of bulky disease, where tumoural and nodal uptake could not be separated.
Comparison of tumour volumes and statistical analysis
MATVs were compared by determining the union and the intersection between each pair of reconstruction methods (PSF vs OSEM and PSF7vs OSEM), and then
computing the Dice coefficients and concordance indi-ces as follows:
Dice’s coefficients ¼2 MATV1ð ∩ MATV2Þ
MATV1þ MATV2
Concordance indices¼MATV1 ∩ MATV2
MATV1 ∪ MATV2
where MATV1 and MATV2 are two volumes delineated on different reconstructions for a given tumour and ∪ and∩ are respectively the union and the intersection be-tween the volumes. Representative volumes and their union and intersection are shown in Fig.2.
These indices give a representative geometrical de-scription of changes in MATVs, combining both volume and positional changes [16]. Their values vary between 0 where the MATVs are completely disjointed and 1 where the MATVs match perfectly in terms of size, shape, and location.
Quantitative data are presented as mean and standard de-viation (SD) or median and interquartile range, as
appropriate. Bland–Altman analyses were used to compare MATVs obtained using the three reconstruction methods. The metrics obtained on each of the three sets of PET im-ages were compared globally using Friedman tests with a post hoc Dunn test [21] used to compare each pair of re-constructions (PSF vs OSEM, PSF7 vs PSF and PSF7 vs
OSEM). The Friedman non-parametric test was chosen be-cause not all the quantitative values had a normal distribu-tion, as tested with the Shapiro Wilk normality test.
The Dice coefficients and concordance indices between the OSEM and PSF or PSF7 reconstructions were
com-pared using the Wilcoxon test for paired samples. Inter-observer variability was assessed with Lin’s concordance coefficient [11]. Moreover, the whole analysis (comparison of volumes and Dice coefficients and concordance indices) was performed in duplicate with volumes extracted by the two observers. For all statistical tests, a two-tailed P value of less than 0.05 was considered statistically significant. Graphs and analyses were performed using Prism (version 5.0f, GraphPad Software, La Jolla, CA).
Results
Patient characteristics
Eighteen patients (16 males, 2 females; mean (±SD) age 61 (±11) years) were included. The patient characteris-tics and their TNM and AJCC stages are listed in Tables 1 and 2, respectively.
Fig. 2 A representative example of automatic delineation of a tumour. MATVs derived from OSEM, PSF, and PSF7reconstructions, as well as their unions and intersections, are shown on axial slices from a 61-year-old patient presenting with a stage IIIA squamous cell lung cancer. Panels a and b display 40% isocontour-based volumes and gradient-based volumes, respectively
Comparison of tumour volumes calculated using the three reconstruction techniques
Forty percent isocontour method
Tumour delineation on unfiltered PSF images resulted in significantly smaller volumes (median = 18.6 cm3, interquartile range 4 to 37) than obtained with the OSEM algorithm (median = 36.4 cm3, interquartile range 7.1 to 50.2; P < 0.001). The use of EARL-compliant PSF images (PSF7) resulted in volumes similar to those
obtained with OSEM reconstructions (median = 34.6 cm3, interquartile range 7.9 to 51.4; no significant difference; Fig. 3a).
The mean percentage difference between unfiltered PSF and OSEM reconstructions for isocontour-based MATVs was 51.5% (95% CI −1.1 to 104; Fig. 4a). After application of the 7-mm Gaussian filter, this difference was reduced to−3% (95% CI −12.6 to 16.7; Fig. 4b).
Gradient-based method
When the PET edge tool was utilised, no significant dif-ference was observed in the volumes delineated by the unfiltered PSF (median = 51.3 cm3, interquartile range 10.2 to 82.8), OSEM (median = 48.7 cm3, interquartile range 9.6 to 82.8), and PSF7 (median = 49.3 cm3,
inter-quartile range 9.6 to 86.8) reconstructions (Fig. 3b). The mean percentage difference between the unfil-tered PSF and OSEM reconstructions for
isocontour-Table 1 Patient characteristics Characteristic Gender Males 16 (88.8) Females 2 (11.1) Age (years) Range 37–81 Mean (SD) 61 (10.9) Body habitus (kg/m2),n (%) BMI≤25 10 (55.6) BMI >25 8 (44.4) Histological diagnosis,n (%)
Small cell lung cancer 1 (5.6) Non-small cell lung cancer 17 (94.4)
Squamous cell carcinoma 10 (55.6) Adenocarcinoma 5 (27.8) Large cell lung cancer 2 (11.1)
Table 2 TNM stages and AJCC anatomic stage
Patients TNM AJCC stage
1 T2N2M0 IIIA 2 T3N1M0 IIIA 3 T2N2M0 IIIA 4 T4N3M0 IIIB 5 T3N1M3 IIIA 6 T4N0M0 IIIA 7 T3N2M0 IIIA 8 T4N2M0 IIIB 9 T4N1M0 IIIA 10 T3N2M0 IIIA 11 T4N0M0 IIIA 12 T4N0M0 IIIA 13 T2N3M0 IIIB 14 T4N2M0 IIIB 15 T3N2M0 IIIA 16 T2N2M0 IIIA 17 T4N1M0 IIIA 18 T1N2M0 IIIA
Fig. 3 Impact of the EARL harmonization strategy on MATVs defined by the isocontour and gradient-based delineation methods (observer 1). MATVs are shown asTukey boxplots (lines displaying the median, 25th, and 75th percentiles;cross represents the mean values). Legends forp values: ***<0.001; **<0.01; *<0.05. ns non significant. a 40% isocontour-based volumes. b Gradient-based volumes
based MATVs was 2.7% (95% CI −15.5 to 21.9; Fig. 4c). After application of the 7-mm Gaussian filter, the mean percentage difference was reduced to 1.1% (95% CI −12.1 to 10; Fig. 4d).
Concordance between MATVs from unfiltered PSF, OSEM, and PSF EARL-compliant reconstructions
Forty percent isocontour method
With consideration of MATVs delineated on OSEM images as the reference standard, the use of PSF7images resulted in
significantly higher Dice coefficients (median value = 0.96 vs 0.77, P < 0.0001; Fig. 5a) and concordance indices (median value = 0.92 vs 0.64, P < 0.0001; Fig. 5b) than those obtained with unfiltered PSF images. The interquartile ranges were also narrower when the PSF7images were used.
Gradient-based method
In comparison to the OSEM method, the Dice coeffi-cients and concordance indices were superior to 0.8 with either the unfiltered PSF- or PSF7-delineated MATVs.
Despite this high similarity, the use of PSF7 images
re-sulted in significantly higher Dice coefficients (median value = 0.96 vs 0.94; P = 0.01) and concordance indices (median value = 0.89 vs 0.85; P = 0.003), and narrower interquartile ranges were observed for PSF7 images
(Fig. 5c, d).
Representative images of the isocontour- and gradient-based tumour delineations using all the three recon-struction methods are shown in Fig. 6.
Inter-observer variability for the 40% isocontour and gradient-based methods
There was an almost perfect inter-observer agreement between each pair of volumes assessed by both ob-servers, with Lin concordance coefficient greater than 0.99 in all cases (Additional file 1: Figure S1).
Regarding the comparison of tumour volumes calcu-lated using the three reconstruction techniques, similar trends were found for both observers, except when com-paring PSF and OSEM volumes delineated with the gradient-based method: for observer 2, a statistically sig-nificant difference was found between OSEM and PSF volumes (Additional file 2: Figure S2).
When it comes to the concordance between MATVs from unfiltered PSF, OSEM, and PSF EARL-compliant re-constructions, similar results were obtained (Additional file 3: Figure S3). Using the 40% isocontour method and taking the MATVs delineated on OSEM images as a reference standard, the use of PSF7images led to significantly higher
Dice coefficients (median value = 0.96 vs 0.75, P = 0.0002) and concordance indices (median value = 0.93 vs 0.61, P = 0.0002) than those obtained using PSF images. The gradient-based methodology was also found less sensitive to reconstruction variability than the 40% isocontour method. Dice coefficients and concordance indices were su-perior to 0.8 for both PSF reconstruction methods. The use of PSF7images led to narrower interquartile ranges and
sig-nificantly higher Dice coefficients (median value = 0.95 vs 0.94; P = 0.01) and concordance indices (median value = 0.91 vs 0.89; P = 0.02) than those obtained with PSF images. Fig. 4 Comparison of MATVs from PSF images optimised for diagnostic potential and EARL-compliant PSF7images (observer 1). Relationships between MATVs extracted from OSEM reconstructions and PSF or PSF7reconstructions, for the 40% isocontour-based methods (a, b) and gradient-based methods (c, d), assessed using Bland–Altman plots
Fig. 5 Impact of the EARL harmonization strategy on Dice and concordance indices between MATVs extracted from OSEM images and PSF images (observer 1). The PSF7images were filtered to meet EARL requirements while PSF images were optimised for diagnostic potential. Data are shown asTukey boxplots (lines displaying the median, 25th, and 75th percentiles; crosses represents the mean values). Dice coefficients and concordance indices are shown for both the isocontour-based method (a, b) and gradient-based method (c, d).ns not significant
Fig. 6 Representative images of isocontour- and gradient-based automatic contouring of PSF images optimised for diagnostic and EARL-compliant purposes. Maximum intensity projections and transverse slices at the level of a necrotic tumour in the right upper lobe of the lung are shown for OSEM, unfiltered PSF images, and PSF images filtered to meet EARL requirements (PSF7). Dice and concordance indices are given for each contouring method, using the MATV extracted from the OSEM images as a reference standard
Discussion
This study demonstrates that automatic contouring of lung tumours on EARL-compliant PSF images using a widely adopted automatic isocontour methodology is an accurate means of overcoming reconstruction variability in MATV delineation. With OSEM used as a reference, this harmonization strategy led to concordance indices greater than 0.9, with very narrow confidence intervals. This supports the use of EARL-compliant images in multicentre studies, where MATVs extracted from 18F-FDG PET are used for tumour targeting or as a prognos-tic tool (for example, using the median value of pooled data as a cut-off value). EARL-compliant images could also be used in clinical routine in centres running more than one PET system, a situation that is more frequently being encountered.
The gradient-based methodology appears less sensitive to reconstruction variability, with median values for Dice coef-ficients and concordance indices between the MATVs de-lineated on OSEM and PSF images greater than 0.8. However, the use of EARL-compliant PSF images signifi-cantly improved these indices, demonstrating the value of harmonised-images, even when more advanced contouring algorithms such as gradient-based contouring are utilised.
In this study, we focused on PSF reconstruction, which implements the detector response function. At the edges of the field of view (FOV), photons are likely to strike crystals at an angle and, as the depth-of-interaction is not known, they may travel through another crystal be-fore they light up. This phenomenon leads to incorrect lines of response, especially at the edge of the FOV; therefore, resolution is not uniform throughout the FOV. The aim of PSF reconstruction is to minimise this effect, thus decreasing partial volume effects, which in turn decreases the spill-in and spill-over within and around a tumour lesion and improves image contrast. In line with these properties of PSF reconstruction, con-touring around lung tumours with the isocontour meth-odology on PSF images led to significantly smaller volumes than obtained from OSEM images. PSF model-ling is available from the major PET vendors [22–24]. Though the improvement of spatial resolution may vary depending on the PET system, as well as corrections for the Gibbs artefact [25–27] impacting on quantitation for small lesions, PSF reconstruction consistently increases SUV metrics compared to standard OSEM reconstruc-tion. Therefore, we feel that results similar to those re-ported in the present study would be obtained with other systems when using the isocontour method.
The present study did not explore other methods for improving tumour delineation on PET/CT images, such as advanced contouring methodologies like contrast-orientated isocontour [28, 29] or the FLAB algorithm [30]. The parameters accounting for the respective
weight of tumour and background uptake in the choice of the optimal threshold used in the contrast-orientated isocontour are known to be specific to the system used [29]. We therefore assume that EARL-compliant images would be useful for contouring of tumours with this al-gorithm in a multicentre setting.
With regards to the use of MATV for radiotherapy planning, our study focused on the initial and crucial step of automatic tumour contouring on PET images. We used automatic contouring so that no other con-founding factor such as inter-observer variability [6] could affect the MATVs. As reported in a recent consen-sus paper from the IAEA [31], the final gross tumour volume used for tumour targeting will also depend on other diagnostic modalities and the use of margin and consensus reading between PET readers and radiation oncologists.
Conclusion
This study shows that automatic contouring of lung tu-mours on EARL-compliant PSF images using the widely adopted automatic isocontour methodology is an accurate means to overcome reconstruction variability in MATV delineation. Although the gradient-based methodology ap-pears to be less sensitive to reconstruction variability, the use of EARL-compliant PSF images significantly improved the Dice coefficient and concordance indices, suggesting that the use of harmonised-images is still important, even with more advanced contouring algorithms.
Additional files
Additional file 1: Figure S1. Inter-observer concordance for volume delineation. Relationships between MATVs extracted from OSEM
reconstructions and PSF or PSF7reconstructions for observers were compared using the Lin concordance coefficient (ρc) for the 40% isocontour (a) and gradient-based (b) methods. (TIFF 8917 kb)
Additional file 2: Figure S2. Impact of the EARL harmonization strategy on MATVs defined by the isocontour and gradient-based delineation methods (observer 2). MATVs are shown as Tukey boxplots (lines displaying the median, 25th and 75th percentiles; cross represents the mean values). Legends forp values: ***<0.001; **<0.01; *<0.05. ns, not significant. (TIFF 17693 kb)
Additional file 3: Figure S3. Impact of the EARL harmonization strategy on Dice and concordance indices between MATVs extracted from OSEM images and PSF images (observer 2). The PSF7images were filtered to meet EARL requirements while PSF images were optimised for diagnostic potential. Data are shown as Tukey boxplots (lines displaying the median, 25th, and 75th percentiles; crosses represents the mean values). Dice coefficients and concordance indices are shown for both the isocontour method (a and b) and gradient-based method (c and d). ns, not significant. (TIFF 17434 kb)
Abbreviations
EANM:European Association of Nuclear Medicine; MATV: Metabolic active tumour volume; NHL: Non-Hodgkin lymphoma; NSCLC: Non-small cell lung cancer; OSEM: Ordered subset expectation maximisation; PET/CT: Positron emission tomography/computed tomography; PSF: Point-spread function; SUV: Standardised uptake value
Acknowledgements
The authors are indebted to Dr Alison Johnson for her review of the manuscript.
Authors’ contributions
NA, CL and HP contributed to the conceptualization. NA, CL, HP and BE did the data gathering, formal analysis and investigation. NA and CL did the methodology and the writing of the manuscript. NA is responsible for the supervision. All authors approved the final version of the manuscript.
Competing interests
The authors declare that they have no competing interests.
Ethics approval and consent to participate
All procedures involving human participants were in accordance with the ethical standards of the institutional research committee and the 1964 Helsinki Declaration and its later amendments. This study was approved by the local ethics committee (Ref A12-D24-VOL13, Comité de protection des personnes Nord-Ouest III), and the requirement for informed consent was waived.
Publisher’s Note
Springer Nature remains neutral with regard to jurisdictional claims in published maps and institutional affiliations.
Author details
1Nuclear Medicine Department, François Baclesse Cancer Centre, Caen, France.2INSERM U1086 « ANTICIPE », BioTICLA, François Baclesse Cancer Centre, Caen, France.3Nuclear Medicine Department, University Hospital, Avenue Côte de Nacre, 14000 Caen, France.4Radiation Oncology, François Baclesse Cancer Centre, Caen, France.5Normandie University, Caen, France.
Received: 4 January 2017 Accepted: 16 March 2017
References
1. Shang J, Ling X, Zhang L, Tang Y, Xiao Z, Cheng Y, et al. Comparison of RECIST, EORTC criteria and PERCIST for evaluation of early response to chemotherapy in patients with non-small-cell lung cancer. Eur J Nucl Med Mol Imaging. 2016;43:1945–53. doi:10.1007/s00259-016-3420-7.
2. Bazan JG, Duan F, Snyder BS, Horng D, Graves EE, Siegel BA, et al. Metabolic tumor volume predicts overall survival and local control in patients with stage III non-small cell lung cancer treated in ACRIN 6668/RTOG 0235. Eur J Nucl Med Mol Imaging. 2017;44:17–24. doi:10.1007/s00259-016-3520-4. 3. Bazan JG, Koong AC, Kapp DS, Quon A, Graves EE, Loo Jr BW, et al.
Metabolic tumor volume predicts disease progression and survival in patients with squamous cell carcinoma of the anal canal. J Nucl Med. 2013; 54:27–32. doi:10.2967/jnumed.112.109470.
4. Gauthe M, Richard-Molard M, Fayard J, Alberini JL, Cacheux W, Lievre A. Prognostic impact of tumour burden assessed by metabolic tumour volume on FDG PET/CT in anal canal cancer. Eur J Nucl Med Mol Imaging. 2017;44: 63–70. doi:10.1007/s00259-016-3475-5.
5. Takeuchi S, Rohren EM, Abdel-Wahab R, Xiao L, Morris JS, Macapinlac HA, et al. Refining prognosis in patients with hepatocellular carcinoma through incorporation of metabolic imaging biomarkers. Eur J Nucl Med Mol Imaging. 2016. doi:10.1007/s00259-016-3583-2.
6. van Baardwijk A, Bosmans G, Boersma L, Buijsen J, Wanders S, Hochstenbag M, et al. PET-CT-based auto-contouring in non-small-cell lung cancer correlates with pathology and reduces interobserver variability in the delineation of the primary tumor and involved nodal volumes. Int J Radiat Oncol Biol Phys. 2007;68:771–8. doi:10.1016/j.ijrobp.2006.12.067.
7. Cheebsumon P, Boellaard R, de Ruysscher D, van Elmpt W, van Baardwijk A, Yaqub M, et al. Assessment of tumour size in PET/CT lung cancer studies: PET- and CT-based methods compared to pathology. EJNMMI Res. 2012;2: 56. doi:10.1186/2191-219x-2-56.
8. Cheebsumon P, van Velden FH, Yaqub M, Frings V, de Langen AJ, Hoekstra OS, et al. Effects of image characteristics on performance of tumor delineation methods: a test-retest assessment. J Nucl Med. 2011;52:1550–8. doi:10.2967/jnumed.111.088914.
9. Cheebsumon P, Yaqub M, van Velden FH, Hoekstra OS, Lammertsma AA, Boellaard R. Impact of [(1)(8)F]FDG PET imaging parameters on automatic tumour delineation: need for improved tumour delineation methodology. Eur J Nucl Med Mol Imaging. 2011;38:2136–44. doi:10.1007/s00259-011-1899-5.
10. Mikhaeel NG, Smith D, Dunn JT, Phillips M, Moller H, Fields PA, et al. Combination of baseline metabolic tumour volume and early response on PET/CT improves progression-free survival prediction in DLBCL. Eur J Nucl Med Mol Imaging. 2016;43:1209–19. doi:10.1007/s00259-016-3315-7. 11. Lin LI. A concordance correlation coefficient to evaluate reproducibility.
Biometrics. 1989;45:255–68.
12. Lasnon C, Desmonts C, Quak E, Gervais R, Do P, Dubos-Arvis C, et al. Harmonizing SUVs in multicentre trials when using different generation PET systems: prospective validation in non-small cell lung cancer patients. Eur J Nucl Med Mol Imaging. 2013;40:985–96. doi:10.1007/s00259-013-2391-1. 13. Lasnon C, Salomon T, Desmonts C, Do P, Oulkhouir Y, Madelaine J, et al.
Generating harmonized SUV within the EANM EARL accreditation program: software approach versus EARL-compliant reconstruction. Ann Nucl Med. 2016. doi:10.1007/s12149-016-1135-2.
14. Quak E, Le Roux PY, Hofman MS, Robin P, Bourhis D, Callahan J, et al. Harmonizing FDG PET quantification while maintaining optimal lesion detection: prospective multicentre validation in 517 oncology patients. Eur J Nucl Med Mol Imaging. 2015;42:2072–82. doi:10.1007/s00259-015-3128-0.
15. Quak E, Le Roux PY, Lasnon C, Robin P, Hofman MS, Bourhis D, et al. Does PET SUV harmonization impact PERCIST response classification? Journal of nuclear medicine : official publication. Soc Nucl Med. 2016. doi:10.2967/ jnumed.115.171983.
16. Hanna GG, Hounsell AR, O'Sullivan JM. Geometrical analysis of radiotherapy target volume delineation: a systematic review of reported comparison methods. Clin Oncol (R Coll Radiol). 2010;22:515–25. doi:10.1016/j.clon.2010. 05.006.
17. Kuhnert G, Boellaard R, Sterzer S, Kahraman D, Scheffler M, Wolf J, et al. Impact of PET/CT image reconstruction methods and liver uptake normalization strategies on quantitative image analysis. Eur J Nucl Med Mol Imaging. 2015. doi:10.1007/s00259-015-3165-8.
18. Kadrmas DJ, Casey ME, Conti M, Jakoby BW, Lois C, Townsend DW. Impact of time-of-flight on PET tumor detection. J Nucl Med. 2009;50:1315–23. doi: 10.2967/jnumed.109.063016.
19. Callahan J, Kron T, Schneider-Kolsky M, Dunn L, Thompson M, Siva S, et al. Validation of a 4D-PET maximum intensity projection for delineation of an internal target volume. Int J Radiat Oncol Biol Phys. 2013;86:749–54. doi:10. 1016/j.ijrobp.2013.02.030.
20. Geets X, Lee JA, Bol A, Lonneux M, Gregoire V. A gradient-based method for segmenting FDG-PET images: methodology and validation. Eur J Nucl Med Mol Imaging. 2007;34:1427–38. doi:10.1007/s00259-006-0363-4.
21. Dunn OJ. Multiple comparisons using rank sums. Technometrics. 1964;6: 241–52. doi:10.1080/00401706.1964.10490181.
22. Bettinardi V, Presotto L, Rapisarda E, Picchio M, Gianolli L, Gilardi MC. Physical performance of the new hybrid PETCT Discovery-690. Med Phys. 2011;38:5394–411. doi:10.1118/1.3635220.
23. Kotasidis FA, Zaidi H. Experimental evaluation and basis function optimization of the spatially variant image-space PSF on the Ingenuity PET/ MR scanner. Med Phys. 2014;41:062501. doi:10.1118/1.4875689.
24. Panin VY, Kehren F, Michel C, Casey M. Fully 3-D PET reconstruction with system matrix derived from point source measurements. IEEE Trans Med Imaging. 2006;25:907–21.
25. Nuyts J. Unconstrained image reconstruction with resolution modelling does not have a unique solution. EJNMMI Physics. 2014;1:98. doi:10.1186/ s40658-014-0098-4.
26. Rogasch JM, Hofheinz F, Lougovski A, Furth C, Ruf J, Grosser OS, et al. The influence of different signal-to-background ratios on spatial resolution and F18-FDG-PET quantification using point spread function and time-of-flight reconstruction. EJNMMI Physics. 2014;1:12. doi:10.1186/2197-7364-1-12. 27. Zeng GL. Gibbs artifact reduction by nonnegativity constraint. J Nucl Med
Technol. 2011;39:213–9. doi:10.2967/jnmt.110.086439.
28. Schaefer A, Kremp S, Hellwig D, Rube C, Kirsch CM, Nestle U. A contrast-oriented algorithm for FDG-PET-based delineation of tumour volumes for the radiotherapy of lung cancer: derivation from phantom measurements and validation in patient data. Eur J Nucl Med Mol Imaging. 2008;35:1989–99. doi:10.1007/s00259-008-0875-1.
29. Schaefer A, Nestle U, Kremp S, Hellwig D, Grgic A, Buchholz HG, et al. Multi-centre calibration of an adaptive thresholding method for PET-based delineation of tumour volumes in radiotherapy planning of lung cancer. Nuklearmedizin Nucl Med. 2012;51:101–10. doi:10.3413/Nukmed-0452-11-12.
30. Hatt M, Cheze Le Rest C, Albarghach N, Pradier O, Visvikis D. PET functional volume delineation: a robustness and repeatability study. Eur J Nucl Med Mol Imaging. 2011;38:663–72. doi:10.1007/s00259-010-1688-6.
31. Konert T, Vogel W, MacManus MP, Nestle U, Belderbos J, Gregoire V, et al. PET/CT imaging for target volume delineation in curative intent radiotherapy of non-small cell lung cancer: IAEA consensus report 2014. Radiother Oncol. 2015;116:27–34. doi:10.1016/j.radonc.2015.03.014.
Submit your manuscript to a
journal and benefi t from:
7 Convenient online submission 7 Rigorous peer review7 Immediate publication on acceptance 7 Open access: articles freely available online 7 High visibility within the fi eld
7 Retaining the copyright to your article