HAL Id: hal-01358611
https://hal.sorbonne-universite.fr/hal-01358611
Submitted on 1 Sep 2016HAL is a multi-disciplinary open access archive for the deposit and dissemination of sci-entific research documents, whether they are pub-lished or not. The documents may come from teaching and research institutions in France or abroad, or from public or private research centers.
L’archive ouverte pluridisciplinaire HAL, est destinée au dépôt et à la diffusion de documents scientifiques de niveau recherche, publiés ou non, émanant des établissements d’enseignement et de recherche français ou étrangers, des laboratoires publics ou privés.
Genetic variation 25.1 Mb upstream of tissue factor
pathway inhibitor is associated with TFPI plasma levels
and venous thromboembolism
Jessica Dennis, Vinh Truong, Dylan Aïssi, Alejandra Medina-Rivera, Stefan
Blankenberg, Marine Germain, Mathieu Lemire, Lina Antounians, Mete
Civelek, Renate Schnabel, et al.
To cite this version:
Jessica Dennis, Vinh Truong, Dylan Aïssi, Alejandra Medina-Rivera, Stefan Blankenberg, et al.. Ge-netic variation 25.1 Mb upstream of tissue factor pathway inhibitor is associated with TFPI plasma levels and venous thromboembolism. Journal of Thrombosis and Haemostasis, Wiley, 2016, 14 (10), pp.1960-1970. �10.1111/jth.13431�. �hal-01358611�
Genetic variation 25.1 Mb upstream of TFPI is associated with tissue factor pathway inhibitor plasma levels and venous thromboembolism
Jessica Dennis1, Vinh Truong1, Dylan Aïssi2-4, Alejandra Medina-Rivera5,6, Stefan
Blankenberg7, Marine Germain2-4, Mathieu Lemire8, Lina Antounians,6,9 Mete
Civelek10, Renate Schnabel7, Phil Wells11, Michael D. Wilson6,9, Pierre-Emmanuel
Morange12-14, David-AlexandreTrégouët2-4, and France Gagnon1 on behalf of the
INVENT Consortium
1Dalla Lana School of Public Health, University of Toronto, Toronto, Canada;
2Sorbonne Universités, UPMC Univ Paris 06; 3INSERM, UMR_S 1166, F-75013, Paris,
France; 4ICAN Institute for Cardiometabolism and Nutrition, F-75013, Paris, France; 5Laboratorio Internacional de Investigación sobre el Genoma Humano, Universidad
Nacional Autónoma de México, Santiago de Querétaro, Mexico; 6Genetics and
Genome Biology, Hospital for Sick Children, Toronto, Ontario; 7Department of
General and Interventional Cardiology, University of Hamburg, Hamburg, Germany;
8Ontario Institute for Cancer Research, Toronto, Canada; 9Department of Molecular
Genetics, University of Toronto; 10Center for Public Health Genomics, Department of
Biomedical Engineering, University of Virginia, Charlottesville, USA, 11Ottawa
Hospital Research Institute, Ottawa, Canada; 12INSERM, UMR_S 1062, 13005,
Marseille, France; 13Inra, UMR_INRA 1260, 13005, Marseille, France; 14Aix Marseille
Université, 13005 Marseille, France
Running Title: Genetic dissection of TFPI plasma level variation Corresponding author:
France Gagnon, MSc, PhD
Dalla Lana School of Public Health 155 College St. Toronto, ON M5T3M7 Canada
Tel.: 416 978 0130
E-mail: france.gagnon@utoronto.ca
Essentials
Tissue factor pathway inhibitor (TFPI) regulates the blood coagulation cascade.
We replicated previously reported linkage of TFPI plasma levels to the chromosome 2q region.
The putative causal locus, rs62187992, was associated with TFPI plasma levels and thrombosis.
rs62187992 was marginally associated with TFPI expression in human aortic endothelial cells.
Abstract
Background: Tissue factor pathway inhibitor (TFPI) regulates fibrin clot formation,
and low TFPI plasma levels increase the risk of arterial and venous
thromboembolism (VTE). TFPI plasma levels are also heritable, and a previous linkage scan implicated the chromosome 2q region, but no specific genes.
Objectives: We sought to replicate the linkage region in an independent sample and
to identify the causal locus. Methods: We first ran a linkage analysis of
microsatellite markers and TFPI plasma levels in 251 individuals from the F5L Family Study and replicated the linkage peak on chromosome 2q (LOD=3.06). We next defined a follow-up region that included 112603 SNPs under the linkage peak, and meta-analyzed associations between these SNPs and TFPI plasma levels across the F5L Family Study and MARTHA, a study of 1033 unrelated VTE patients. SNPs with FDR q<0.10 were tested for association with TFPI plasma levels in 892 patients with coronary artery disease in the AtheroGene study. Results and Conclusions: One SNP, rs62187992, was associated with TFPI plasma levels in all three samples (β=+0.14 P=4.23x10⁻⁶ combined; β=+0.16, P=0.02 in F5L Family Study; β=+0.13,
P=6.3x10⁻⁴ in MARTHA; β=+0.17, P=0.03 in AtheroGene) and contributed to the
linkage peak in the F5L Family Study. rs62187992 was also associated with clinical VTE (odds ratio=0.90, P=0.03) in the INVENT consortium of over 7000 cases and their controls and was marginally associated with TFPI expression (β=+0.19, P=0.08) in human aortic endothelial cells, a primary site of TFPI synthesis. The biological mechanisms underlying these associations remain to be elucidated.
Keywords: Blood Coagulation; Genetic Association Studies; Genetic Linkage;
Introduction
Tissue factor pathway inhibitor (TFPI) regulates the blood coagulation cascade. It impedes early stages of the extrinsic coagulation pathway by binding the procoagulants tissue factor (TF)-FVIIa, and FXa [1], and also limits a growing clot by preventing the incorporation of FVa into prothrombinase, the enzyme that converts prothrombin into thrombin [2]. Mice missing the TFPI gene die in utero from disseminated intravascular coagulation [3] and in humans, prospective studies show a threshold effect for low TFPI plasma levels and thrombosis risk. Subjects with baseline TFPI plasma levels in the lowest 5% of the distribution had a nearly two-fold increased risk of incident venous thromboembolism (VTE) in a nested case-control study of 534 VTE cases and 1091 matched controls [4]. Likewise, in a nested case-control study of 296 coronary heart disease patients and 563 matched controls, subjects with baseline TFPI levels in the lowest 10% of the distribution had a greater than two-fold increased risk of incident nonfatal myocardial infarction and coronary death [5].
TFPI plasma levels are associated with both non-genetic and genetic factors. Non-genetic covariates include age, sex, smoking, oral contraceptive use, body mass index, cholesterol levels, as well as several markers of coagulation and endothelial cell activation [5-10]. Whether these correlations are causal or an indirect effect of underlying cardiovascular disease, however, is unclear [11].
Between 27 and 52% of the variability in TFPI plasma levels is attributable to genetics [12-14]. Early searches for genetic risk factors focused on the TFPI gene itself, and although meta-analyses confirmed that rs5940 and rs7586970 in TFPI were associated with TFPI plasma levels [15], much variability in TFPI plasma levels remains unexplained. The Genetic Analysis of Idiopathic Thrombosis (GAIT) study is the only published genome-wide study of TFPI plasma levels to date, and through a linkage analysis, identified a single locus on chromosome 2q upstream of TFPI [12]. The linkage signal, however, was not explained by rs5940 in TFPI (rs7586970 was not tested). We sought to replicate these linkage results and to identify the putative variant(s) underlying the linkage signal.
Materials and Methods Overall Strategy
Our analytic strategy comprised three steps. First, we conducted a linkage analysis of TFPI plasma levels in 251 individuals from five extended pedigrees from the French-Canadian Family Study on Factor V Leiden (F5L) Thrombophilia (F5L Family Study) to replicate the GAIT linkage findings. Second, we fine-mapped the chromosome 2q region defined by the F5L Family Study and GAIT linkage peaks. We meta-analyzed associations between single nucleotide polymorphisms (SNPs) in this region and TFPI plasma levels across the F5L Family Study and the
MARseilleTHrombosis Association (MARTHA) Study, which included 1033
unrelated cases of VTE, and tested significant SNPs for association with TFPI plasma levels in a third study sample, AtheroGene, which included 892 subjects with
coronary artery disease. We identified one SNP associated with TFPI plasma levels across all three study samples. In the third step, we validated [16] this SNP for its role in thrombotic events in nearly 7000 cases and 53,000 controls from the International Network against Thrombosis (INVENT) collaboration [17].
Study Samples
The F5L Family Study included 369 individuals from 5 French-Canadian families [18, 19]. Probands were identified from the Thrombosis Clinic of The Ottawa Hospital, Ottawa, Canada, between 2005 and 2006 and had idiopathic, objectively diagnosed VTE, and carried the F5L mutation. Idiopathic VTE was VTE in the absence of immobilization, surgery, fracture with a plaster cast, multi-system trauma, pregnancy, or cancer in the previous 6 months. VTE was diagnosed by venography, compression ultrasound, magnetic resonance imaging, computed tomography, ventilation/perfusion lung scan, spiral computed tomography, and/or by autopsy. Probands were free of strong genetic risk factors for VTE: protein S, protein C, and antithrombin deficiencies, and homozygosity for the F5L mutation.
Probands’ biological relatives 10 years of age and older were eligible to participate in the study. All invited subjects consented (N=255), completed an
interviewer-administered questionnaire on their personal and medical information, and provided blood samples. The research ethics boards of the University of
Toronto and the Ottawa Hospital Research Institute approved this study.
The MARTHA Study included 1592 patients with objectively diagnosed VTE seen at the Thrombophilia Centre of La Timone Hospital, Marseille, France, between January 1994 and October 2005 [19, 20]. Subjects were recruited at least three months after the VTE event, and only if none of the following had occurred in the three months preceding the VTE event: immobilization for 7 days or more, surgery, trauma, oral contraceptive use, or pregnancy. VTE was diagnosed by venography, Doppler ultrasound, spiral computed tomographic scanning angiography and/or ventilation/perfusion lung scan. None of the participants carried strong genetic risk factors for VTE (protein S, protein C, antithrombin deficiency, lupus anticoagulant, or homozygosity for the F5L or F2 20210A mutations). All subjects were white Europeans, and the majority was of self-reported French descent. A physician interviewed subjects about their personal and medical histories, and participants provided a fasting blood sample. The Ethics Committee at La Timone Hospital approved this study.
The AtheroGene Study included coronary artery disease patients undergoing coronary angiography at the Department of Medicine II of the Johannes Gutenberg-University Mainz or the Bundeswehrzentralkrankenhaus Koblenz between June 1999 and February 2004 [5, 21]. Subjects completed a questionnaire and provided a blood sample before the coronary angiography. Subjects were of European origin, of German nationality, and living in the Rhein-Mainz area of Germany. The Ethics Committee of the University of Mainz approved this study.
Genotyping and Imputation
F5L Family Study participants were genotyped using a panel of 1079 microsatellite markers from DeCODE [18]. Markers were mapped to cM positions using the Marshfield Medical Research Foundation sex-averaged genetic maps [22], and distances were converted to Haldane distances. Markers were spaced, on average, 3.4 cM apart.
Study participants were also genotyped with the Illumina Human660W-Quad beadchip [18, 19], and genotype data from all 255 individuals passed quality
control. We imputed additional SNP genotypes using the pre-phasing approach in SHAPEIT v2.r778 [23, 24], the imputation software IMPUTE v2.3.1 [25], and the 1000 Genomes Phase 1 Total European Ancestry (EUR) population (2010-11-23 release) [26]. We filtered imputed SNPs with fewer than 20 observations of the minor allele and with low imputation quality (info<0.3), for a total of 6,159,088 included SNPs.
MARTHA subjects were genotyped with the Illumina Human610-Quad or 660W-Quad beadchips [20], and after applying quality control filters, 1542
individuals remained in the analysis. We imputed genotypes using MACH version 1.0.18.c [27, 28] and haplotypes from the 1000 Genomes Total European Ancestry (EUR) population (2010-08 release), and the 7,804,320 imputed SNPs with
MAF>0.01 and acceptable imputation quality (r2>0.3) were used in subsequent
analyses [29].
AtheroGene subjects were genotyped with the Affymetrix Genome-Wide Human SNP 6.0 array. SNPs with significant (p<10-5) deviation from
Hardy-Weinberg Equilibrium, with minor allele frequency less than 1% or having a genotyping call rate < 99% were filtered out. We imputed genotypes in 1762 individuals using MACH version 1.0.18.c [27, 28] and haplotypes from the 1000 Genomes Total European Ancestry (EUR) population (2010-11 release), analyzed in minimac (release 2012-03-14) [23, 30]. The 9,471,142 imputed SNPs with
MAF>0.01 and acceptable imputation quality (r2>0.3) were used for replication
analysis.
Biological Measurements and Medication Use
We measured free TFPI plasma levels using the Asserachrom® Free TFPI enzyme immunoassayfrom DiagnosticaStago (Asnières, France) in the F5L Family, MARTHA, and AtheroGene studies. The assay’s normal reference interval was 5.2-14.8 ng/mL. Data were available from 251 individuals from the F5L Family Study, 1170 individuals from MARTHA, and 892 individuals from AtheroGene. Although
TFPI was measured from frozen samples in MARTHA, we ensured that values were comparable to those from fresh plasma by calculating the correlation between TFPI and vWF plasma levels, both markers of endothelial cell dysfunction, in MARTHA and the F5L Family Study. TFPI and vWF measured in fresh plasma in the F5L Family study were significantly correlated (r2=0.13, P=0.008), as were TFPI (frozen
plasma) and vWF (fresh plasma) in MARTHA (r2=0.23, p<0.0001), suggesting that
TFPI in frozen plasma was stable over storage time. All analyses were of log-transformed TFPI plasma levels to improve model fit, unless noted otherwise. We used the manufacturers’ standard laboratory protocols to measure other lipid and hematological traits relevant to TFPI.
TFPI plasma levels spike after heparin injection [6], which is administered in the acute phase of a VTE [31], or prophylactically in patients undergoing coronary angiography [32]. Heparin had been administered to none of the subjects in the F5L Family Study, but to 137 subjects in MARTHA undergoing inherited thrombophilia testing, and to 359 subjects in AtheroGene. Subjects undergoing thrombophilia testing may have differed systematically from the remaining MARTHA sample, so we excluded MARTHA subjects on heparin. In AtheroGene, on the other hand, heparin administration did not vary systematically across patient subgroups, so we included all subjects on heparin and adjusted for heparin use.
Joint Segregation and Linkage Analyses
We used SOLAR [33] to estimate the total additive genetic heritability of TFPI plasma levels in the F5L Family Study, conditioning on age and sex, and to run variance components multipoint and two-point linkage analyses with
microsatellites, as was done in the GAIT study [12].
We compared the SOLAR results to those from an analysis using Loki [34, 35], which implements a Bayesian Markov chain Monte Carlo routine and is less sensitive to the trait’s distributional assumptions [36]. Starting values were specified for the number of loci (N=2), which were assumed to follow a Poisson distribution, and age and sex were included as covariates. Linkage results from Loki
were reported as Bayes Factors, with log10(Bayes Factors) between 1 and 10
defining “strong evidence” for linkage [35].
Using SOLAR, the chromosome 2q region was the highest peak genome-wide, and the LOD score of the region exceeded the threshold (LOD>3) for candidate region significance. In Loki, Bayes Factors supported “strong evidence” for linkage. We therefore restricted all subsequent linkage analyses to chromosome 2. We intended to fine-map the linkage region using SNP data, and so next confirmed the microsatellite linkage results using SNP markers, which were selected from the clean SNPs on the Illumina Human660W-Quad beadchip. Eligible markers had MAF >0.2 and pairwise r2<0.2, and were mapped to cM positions according to the
Rutger’s sex-averaged map for the Illumina 660W Quad Beadchip [37]. We selected the first SNP on chromosome 2, followed by all subsequent SNPs separated by at least 0.5 cM, for a total of 390 markers on chromosome 2, spaced 0.7 cM apart on average. We analyzed the pruned SNP set using multipoint and two-point linkage analyses in SOLAR, adjusting for age and sex.
We also conducted three additional sensitivity analyses using the chromosome 2 SNP marker set and SOLAR: we tested an inverse-normal
transformation of TFPI plasma levels to account for the slightly elevated residual kurtosis observed in the analysis of log-transformed TFPI plasma levels; we excluded three individuals whose TFPI plasma levels exceeded three times the interquartile range from the third quartile in the F5L Family Study; and we added covariates associated with TFPI plasma levels in the F5L Family Study (high density lipoprotein cholesterol, lipoprotein (a), von Willebrand factor, and FVII, identified using a backwards selection model). All SNP linkage analyses included age and sex as covariates.
Candidate Region Fine-Mapping
Ultimately, our linkage analysis led us to a 70 cM region on chromosome 2q defined by the GAIT and F5L Family Study (SNP) linkage regions. Linkage cM positions were mapped to bp positions using the Rutger’s sex-averaged map for the Illumina 660W Quad Beadchip [37] and our region spanned
chr2:165,147,999-231,778,585 in the hg19 assembly. This region included 112,603 genotyped and imputed SNPs common to the F5L Family and MARTHA studies, each of which was tested for association with TFPI plasma levels in an additive genetic model. In the F5L Family study, we tested for association with GEMMA [38], which uses a mixed model to account for family structure, and adjusted for age and sex. In MARTHA, we used mach2qtl [27, 28], and adjusted for age, sex, the first four principal
components, vitamin K antagonist use, and antiplatelet use. We used an inverse-variance weighted model implemented in METAL [39] to meta-analyze results across both studies. Heterogeneity was quantified by the I2 statistic and the
heterogeneity P.
SNPs with false discovery rate (FDR) q-values <0.10 were tested for replication in AtheroGene, since simulation studies have shown that q-value
thresholds greater than 0.05 may be required in GWAS to discover truly associated SNPs [40]. We modeled associations between SNPs and TFPI plasma levels in AtheroGene under an additive genetic model, and adjusting for age, sex, the first four principal components, heparin use, and antiplatelet use.
As a final step, we attempted to validate [16] any TFPI-associated SNPs for their role in thrombosis by conducting a look-up in a large published meta-GWAS of VTE, the International Network against Thrombosis (INVENT) collaboration, which comprised 7,507 VTE cases and 52,632 controls from 12 studies [17].
Results
Our workflow involved looking for TFPI plasma level-associated variants in three distinct study samples (Figure 1). Individuals in the F5L Family Study were younger than those in MARTHA and AtheroGene, were equally likely to be male or female, and 6% had a history of VTE (Table 1). TFPI plasma levels ranged from 3.4 to 28.8 ng/mL in the F5L Family study, from 1.9 to 59.6 ng/mL in MARTHA, and from 1.80 to 334.0 ng/mL in AtheroGene (due to the higher prevalence of subjects on heparin).
The total additive genetic heritability of TFPI plasma levels was 40.9% (P =1.48x10⁻⁵) in the F5L Family Study. Using the same approach as in GAIT, i.e.,
microsatellite markers and SOLAR, the chromosome 2q peak was the highest peak genome-wide (Figure 2), with LOD scores of 3.06 in the multipoint and 2.67 in the two-point analyses (peak marker D2S126). The peak was upstream of the TFPI gene. Markov chain Monte Carlo methods in Loki confirmed the SOLAR findings, providing “strong evidence” for linkage in the 2q region (Supplementary Figure 1).
In the linkage analysis of SNPs on chromosome 2 using SOLAR, the
chromosome 2q region had a peak multipoint LOD score of 1.88 (Figure 3A) and two-point LOD score of 2.67 at marker rs7564113. Results were similar using the inverse-normal transformation and after adjusting for covariates (Supplementary Figure 2, panels A and C). When we excluded the three individuals with extreme TFPI plasma levels, however, the peak was reduced (Supplementary Figure 2, panel B). All three individuals were from different families, all were male, but otherwise had no unifying characteristics.
We next fine-mapped the GAIT and F5L Family Study chromosome 2q
linkage region. Our candidate region spanned 70 cM on chromosome 2, from 170 to 240 cM, and from 165,147,999 bp to 231,778,585 bp, hg19 assembly (Figure 3). We tested the association of 112,603 SNPs in this region with TFPI plasma levels in the F5L Family Study and MARTHA (quantile-quantile plot provided in Supplementary Figure 3), and 38 had meta-analyzed q-values below our pre-specified 10% FDR threshold. The 38 SNPs corresponded to six independent genomic regions after filtering SNPs in perfect LD (r2=1 in the 1000 Genomes Phase 1 reference
population), and a tag SNP from each region was tested for replication in AtheroGene (Table 2). One region representing three SNPs (rs62187992,
rs7602135, and rs73071785) was suggestively associated with TFPI plasma levels in Atherogene (Supplementary Table 1), and while the P values of all three SNPs were not statistically significant after correcting for six tests, the direction and magnitude of association of these SNPs with TFPI plasma levels was similar across study samples. We therefore took the lead SNP, rs62187992, forward for further analyses.
The rs62187992 “A” allele had a frequency of 0.06 to 0.07 across all study samples and had a consistent positive association with TFPI plasma levels (additive
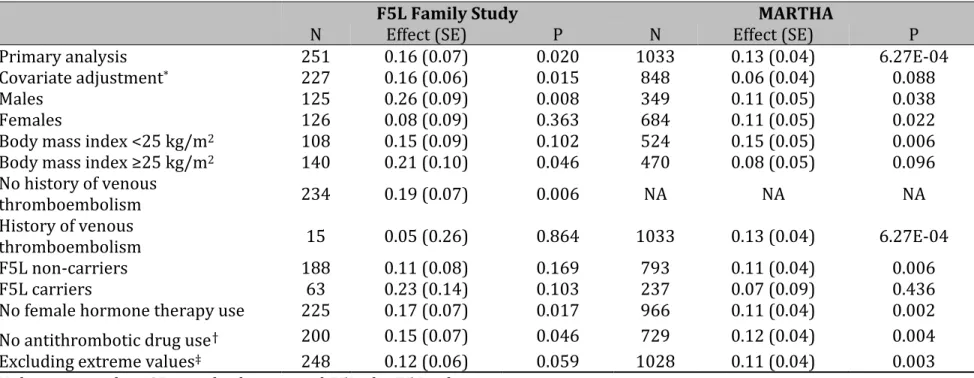
allele effect β=+0.16 in F5L Family Study, β=+0.13 in MARTHA, and β=+0.17 in AtheroGene). The pooled additive allele effect across all three studies was β=+0.14 (SE 0.03), with P=4.23x10⁻⁶. Results were unchanged across all sensitivity analyses
in the F5L Family and MARTHA Studies (Table 3).
Linkage analyses conditional on rs62187992 further implicated the SNP in TFPI plasma level variability. The chromosome 2q signal was reduced when rs62187992 was added as a covariate to the multipoint SOLAR SNP model (maximum LOD 1.14; Figure 3B), suggesting that rs62187992 explained at least some of the linkage signal [41].
In an attempt to identify additional SNPs underlying the linkage signal, we also re-ran our candidate region association analyses, conditional on rs62187992. Analyses were run separately in the F5L Family and MARTHA studies, and
associations were meta-analyzed with METAL. The minimum meta-analysis FDR q-value was 0.30 (Figure 3B; Supplementary Figure 3), suggesting no residual allelic heterogeneity across the F5L Family and MARTHA study samples.
In comparison, we also tested two TFPI SNPs, rs5940 and rs7586970, identified in a recent meta-analysis [15]. The chromosome 2q linkage signal was not attenuated when rs5940 or rs7586970 were added to the model (results not shown), and neither SNP was associated with TFPI plasma levels in either the F5L Family or MARTHA studies (Supplementary Table 2).
Last, we assessed the association of rs62187992 with the risk of the clinical thrombosis in the INVENT meta-GWAS of VTE. The rs62187992 “A” allele was less frequent in 7,507 cases than in their 52,632 controls and increasing copies of the allele were associated with a 10% reduced relative risk of VTE (odds ratio=0.90, 95% confidence interval 0.84 to 0.98, P=0.03). A P value threshold of 0.05 was deemed statistically significant since we tested a single SNP, obviating the need for multiple testing correction. Results were homogenous across the 12 assessed studies (I2=0, P=0.74), and the inverse association between the rs62187992 “A”
allele and VTE risk was consistent with the allele’s positive association with TFPI plasma levels.
rs62187992 is 25.1 Mb upstream of TFPI, in an intergenic region 139 kb upstream of ERBB4 and 322 kb downstream of IKZF2. rs62187992 is also intronic to a predicted long non-coding RNA (ENSG00000273118.1) that overlaps the 3’ end of IKZF2. To better understand the biological implication of variability at this locus, we tested the association between rs62187992 and expression of TFPI, IKZF2, and
ERBB4 in human aortic endothelial cells (EC), a primary site of TFPI synthesis, in
147 heart transplant donors [42]. The rs62187992 “A” allele was marginally associated with increased TFPI (β=+0.19, P=0.08) and decreased IKZF2 (β=-0.05, P=0.08) expression in this small dataset, but was not associated with the expression of ERBB4 (β=-0.02, P=0.57).
Discussion
We replicated the chromosome 2q linkage to TFPI plasma levels originally reported in the GAIT study and identified a SNP that contributed to the linkage peak. The rs62187992 “A” allele was associated with elevated TFPI plasma levels across three European ancestry study samples ascertained on cardiovascular disease, with a consistent magnitude and direction of effect. The combined effect was highly statistically significant (P=4.23x10⁻⁶) in the context of a candidate locus study.
Moreover, the rs62187992 “A” allele was associated with a reduced risk of VTE in a recent meta-analysis of nearly 60,000 individuals, and gene expression analysis in a relevant cell type suggested that rs62187992 is an eQTL for TFPI.
Very little is known of the genetics of TFPI, despite high heritability estimates across multiple populations and study designs [12-14]. The GAIT study is the only genome-wide study of TFPI plasma levels reported to date, and it included 397 individuals from 21 Spanish families, 12 of which were ascertained on VTE or arterial thrombosis. The F5L Family Study had a similar study design, families ascertained on thrombosis, and found the same linkage signal on chromosome 2 upstream of TFPI. Nonetheless, variants in TFPI (rs5940 and rs7586970) did not explain the linkage peak in the GAIT or in the F5L Family Study. rs5940 and
meta-analysis [15], but were not replicated in the present meta-analysis. As explanation, the meta-analysis result for rs5940 was borderline statistically significant and driven by early, small, candidate gene studies, whose effect sizes may have been upwardly biased, while rs7586970 was specifically associated with total as opposed to free TFPI, which was measured in the present analysis. Several small studies have also reported associations between TFPI plasma levels and rare mutations in candidate coagulation genes, including PROS1 [43, 44] and F5 [45]. Nonetheless, much
remains to be learned about the biology and genetics of TFPI plasma level regulation [15].
rs62187992 (and its perfect proxies rs7602135 and rs73071785) is located in a dynamic regulatory region 25.1 Mb upstream of TFPI. Using HaploReg v4 [46], rs7602135 appears to have the most regulatory potential of the three SNPs. It overlaps an ‘enhancer’ chromatin state in three separate embryonic stem cell lines and a mesenchymal stem cell line (from which endothelial and hematopoietic cells differentiate), and its minor allele is predicted to increase the similarity
to regulatory motifs for two transcription factors expressed in EC, BDP1 and COUP-TFII. Further suggesting dynamic regulatory potential of this region, rs7602135 is 4 bp away from a polymorphic CpG site (rs1320116, minor allele frequency 34.8%) that is differentially methylated in the DNA methylation maps of the Roadmap Epigenomics Consortium [47].
Our gene expression results suggestively associated rs6287992 to TFPI and
IKZF2 expression. IKZF2 encodes the Ikaros Family Zinc Finger 2 (Helios), a
hematopoietic transcription factor expressed in hematopoietic stem cells [48] and in cells of the lymphoid lineage [49, 50] – cells that also express TFPI [51]. One possibility is that Helios affects the epigenetic landscape in hematopoietic stem cells, which impacts future TFPI expression in differentiated cells. Alternatively, the Genome Tissue Expression Project (GTEx, 38 tissues, v 6.0) reports low IKZF2 expression across non-hematopoietic tissues, and Helios may regulate TFPI expression directly in vascular EC.
Our study included healthy individuals (most F5L Family Study participants), patients with a history of VTE (MARTHA), and patients with coronary artery disease
(AtheroGene), resulting in differences in the timing of TFPI measurements relative to disease, and in medication use. Cardiovascular disease increases TFPI plasma levels [6, 10, 11, 52, 53], and levels tend to stay elevated in coronary artery disease [54, 55]. In accordance, we observed increasing TFPI plasma levels across the F5L Family, MARTHA, and AtheroGene study samples. Despite this heterogeneity, we found that the rs62187992 “A” allele was associated with increased TFPI plasma levels in all study samples, even in sensitivity analyses of medication use.
Nonetheless, clinical heterogeneity across study samples may have hampered our efforts to identify additional SNPs contributing to the chromosome 2q linkage signal.
Free TFPI, measured in all three study samples, is the most common measure of TFPI in epidemiological studies [5, 6, 9, 56] but captures only ~4% of the total body pool of TFPI [57]. The free TFPI assay measures circulating levels of TFPI-α, one of two common TFPI isoforms in humans [57], but most TFPI-α is either C-terminal truncated and bound to lipoproteins in the circulation, bound to the endothelial cell surface and released upon heparin infusion, or sequestered within platelets [57]. Our study could not detect SNPs that affected these pools of TFPI, since no methods exist to measure the fractions of TFPI-α in platelets and
monocytes, nor was our study designed to detect SNPs that affected TFPI-β plasma levels, or TFPI activity. Nonetheless, measures of free TFPI and of TFPI activity are often correlated [58], and the original chromosome 2q signal in GAIT was linked to TFPI activity levels [12].
We replicated a linkage peak on chromosome 2q originally reported in the only genome-wide study of TFPI plasma levels to date. We confirmed that SNPs in
TFPI did not explain the linkage signal and used multiple complementary study
samples to implicate rs62187992 in TFPI plasma level variability and in VTE risk. rs62187992 is intergenic, and the minor allele was marginally associated with
IKZF2 and TFPI expression at a primary site of TFPI expression. Our work suggests
novel etiologic pathways in thrombosis, and functional experiments are warranted to characterize the biology of our findings.
J. Dennis, F. Gagnon, and D.-A. Trégouët conceptualized the research. F. Gagnon, P. Wells, D.-A. Trégouët, P.-E. Morange, S. Blankenberg, and R. Schnabel designed the F5L Family, MARTHA, and AtheroGene studies and collected the data. J. Dennis led the data analysis, with support from V. Truong, D. Aïssi, A. Medina-Rivera, M. Germain, M. Lemire, L. Antounians, and M.D. Wilson. All authors
contributed to the revision process and approved the manuscript for publication. A complete list of INVENT collaborators is provided in the Appendix.
The authors have no conflict-of-interest to declare.
Acknowledgements
This work was supported by the Canadian Institutes of Health Research (Grant MOP 86466) and by the Heart and Stroke Foundation of Canada (Grant T6484). J. Dennis is a Vanier Canada Graduate Scholar and Fellow in the Canadian Institutes of Health Research Strategic Training for Advanced Genetic Epidemiology (CIHR STAGE) program. F. Gaganon and M.D. Wilson hold Canada Research Chairs. M.D. Wilson and A. Medina-Rivera were supported by Heart and Stroke Foundation of Ontario (Bridge Grant 7486).
Statistical analyses of the MARTHA and Atherogen dataset were performed using the C2BIG computing cluster, funded by the Région Ile de France, Pierre and Marie Curie University, and the ICAN Institute for Cardiometabolism and Nutrition (ANR-10-IAHU-05).
The authors are thankful to Nicholas L. Smith for his comments during the review process, to Veronica Codoni for analytic support, and to the individuals who participated in the studies.
References
1 Novotny WF, Girard TJ, Miletich JP, Broze GJ, Jr. Purification and
characterization of the lipoprotein-associated coagulation inhibitor from human plasma. J Biol Chem. 1989; 264: 18832-7.
2 Wood JP, Bunce MW, Maroney SA, Tracy PB, Camire RM, Mast AE. Tissue factor pathway inhibitor-alpha inhibits prothrombinase during the initiation of blood coagulation. Proc Natl Acad Sci U S A. 2013; 110: 17838-43.
10.1073/pnas.1310444110.
3 Huang ZF, Higuchi D, Lasky N, Broze GJ, Jr. Tissue factor pathway inhibitor gene disruption produces intrauterine lethality in mice. Blood. 1997; 90: 944-51. 4 Zakai NA, Lutsey PL, Folsom AR, Heckbert SR, Cushman M. Total tissue factor pathway inhibitor and venous thrombosis. The Longitudinal Investigation of
Thromboembolism Etiology. Thromb Haemost. 2010; 104: 207-12. 10.1160/TH09-10-0693.
5 Morange PE, Simon C, Alessi MC, Luc G, Arveiler D, Ferrieres J, Amouyel P, Evans A, Ducimetiere P, Juhan-Vague I, Group PS. Endothelial cell markers and the risk of coronary heart disease: the Prospective Epidemiological Study of Myocardial Infarction (PRIME) study. Circulation. 2004; 109: 1343-8.
10.1161/01.CIR.0000120705.55512.EC.
6 Morange PE, Blankenberg S, Alessi MC, Bickel C, Rupprecht HJ, Schnabel R, Lubos E, Munzel T, Peetz D, Nicaud V, Juhan-Vague I, Tiret L, Atherogene I.
Prognostic value of plasma tissue factor and tissue factor pathway inhibitor for cardiovascular death in patients with coronary artery disease: the AtheroGene study. J Thromb Haemost. 2007; 5: 475-82. 10.1111/j.1538-7836.2006.02372.x. 7 Morange PE, Renucci JF, Charles MA, Aillaud MF, Giraud F, Grimaux M, Juhan-Vague I. Plasma levels of free and total TFPI, relationship with cardiovascular risk factors and endothelial cell markers. Thromb Haemost. 2001; 85: 999-1003.
8 Hansen JB, Grimsgaard S, Huseby N, Sandset PM, Bonaa KH. Serum lipids and regulation of tissue factor-induced coagulation in middle-aged men. Thromb Res. 2001; 102: 3-13.
9 Dahm A, Van Hylckama Vlieg A, Bendz B, Rosendaal F, Bertina RM, Sandset PM. Low levels of tissue factor pathway inhibitor (TFPI) increase the risk of venous thrombosis. Blood. 2003; 101: 4387-92. 10.1182/blood-2002-10-3188.
10 Sakkinen PA, Cushman M, Psaty BM, Kuller LH, Bajaj SP, Sabharwal AK, Boineau R, Macy E, Tracy RP. Correlates of antithrombin, protein C, protein S, and TFPI in a healthy elderly cohort. Thromb Haemost. 1998; 80: 134-9.
11 Winckers K, ten Cate H, Hackeng TM. The role of tissue factor pathway inhibitor in atherosclerosis and arterial thrombosis. Blood Rev. 2013; 27: 119-32. 10.1016/j.blre.2013.03.001.
12 Almasy L, Soria JM, Souto JC, Warren DM, Buil A, Borrell M, Munoz X, Sala N, Lathrop M, Fontcuberta J, Blangero J. A locus on chromosome 2 influences levels of tissue factor pathway inhibitor: results from the GAIT study. Arterioscler Thromb
Vasc Biol. 2005; 25: 1489-92. 10.1161/01.ATV.0000166602.04711.2e.
13 Warren DM, Soria JM, Souto JC, Comuzzie AG, Fontcuberta J, Blangero J, MacCluer JW, Almasy L. Heritability of Hemostasis Phenotypes and Their
Correlation with Type 2 Diabetes Status in Mexican Americans. Human Biology. 2005; 77: 1-15. 10.1353/hub.2005.0034.
14 Bladbjerg EM, de Maat MP, Christensen K, Bathum L, Jespersen J, Hjelmborg J. Genetic influence on thrombotic risk markers in the elderly--a Danish twin study. J
Thromb Haemost. 2006; 4: 599-607. 10.1111/j.1538-7836.2005.01778.x.
15 Dennis J, Kassam I, Morange PE, Tregouet DA, Gagnon F. Genetic
determinants of tissue factor pathway inhibitor plasma levels. Thromb Haemost. 2015; 114: 245-57. 10.1160/TH14-12-1043.
16 Konig IR. Validation in genetic association studies. Brief Bioinform. 2011; 12: 253-8. 10.1093/bib/bbq074.
17 Germain M, Chasman DI, de Haan H, Tang W, Lindstrom S, Weng LC, de Andrade M, de Visser MC, Wiggins KL, Suchon P, Saut N, Smadja DM, Le Gal G, van Hylckama Vlieg A, Di Narzo A, Hao K, Nelson CP, Rocanin-Arjo A, Folkersen L,
Monajemi R, Rose LM, Brody JA, Slagboom E, Aissi D, Gagnon F, Deleuze JF, Deloukas P, Tzourio C, Dartigues JF, Berr C, Taylor KD, Civelek M, Eriksson P, Cardiogenics C, Psaty BM, Houwing-Duitermaat J, Goodall AH, Cambien F, Kraft P, Amouyel P, Samani NJ, Basu S, Ridker PM, Rosendaal FR, Kabrhel C, Folsom AR, Heit J, Reitsma PH, Tregouet DA, Smith NL, Morange PE. Meta-analysis of 65,734 individuals identifies TSPAN15 and SLC44A2 as two susceptibility loci for venous
thromboembolism. Am J Hum Genet. 2015; 96: 532-42. 10.1016/j.ajhg.2015.01.019. 18 Antoni G, Morange PE, Luo Y, Saut N, Burgos G, Heath S, Germain M, Biron-Andreani C, Schved JF, Pernod G, Galan P, Zelenika D, Alessi MC, Drouet L, Visvikis-Siest S, Wells PS, Lathrop M, Emmerich J, Tregouet DA, Gagnon F. A multi-stage multi-design strategy provides strong evidence that the BAI3 locus is associated with early-onset venous thromboembolism. J Thromb Haemost. 2010; 8: 2671-9. 10.1111/j.1538-7836.2010.04092.x.
19 Antoni G, Oudot-Mellakh T, Dimitromanolakis A, Germain M, Cohen W, Wells P, Lathrop M, Gagnon F, Morange PE, Tregouet DA. Combined analysis of three genome-wide association studies on vWF and FVIII plasma levels. BMC Med Genet. 2011; 12: 102. 10.1186/1471-2350-12-102.
20 Oudot-Mellakh T, Cohen W, Germain M, Saut N, Kallel C, Zelenika D, Lathrop M, Tregouet DA, Morange PE. Genome wide association study for plasma levels of natural anticoagulant inhibitors and protein C anticoagulant pathway: the MARTHA project. Br J Haematol. 2012; 157: 230-9. 10.1111/j.1365-2141.2011.09025.x. 21 Wild PS, Zeller T, Schillert A, Szymczak S, Sinning CR, Deiseroth A, Schnabel RB, Lubos E, Keller T, Eleftheriadis MS, Bickel C, Rupprecht HJ, Wilde S, Rossmann H, Diemert P, Cupples LA, Perret C, Erdmann J, Stark K, Kleber ME, Epstein SE, Voight BF, Kuulasmaa K, Li M, Schafer AS, Klopp N, Braund PS, Sager HB, Demissie S, Proust C, Konig IR, Wichmann HE, Reinhard W, Hoffmann MM, Virtamo J, Burnett MS, Siscovick D, Wiklund PG, Qu L, El Mokthari NE, Thompson JR, Peters A, Smith AV, Yon E, Baumert J, Hengstenberg C, Marz W, Amouyel P, Devaney J, Schwartz SM, Saarela O, Mehta NN, Rubin D, Silander K, Hall AS, Ferrieres J, Harris TB, Melander O, Kee F, Hakonarson H, Schrezenmeir J, Gudnason V, Elosua R, Arveiler D, Evans A, Rader DJ, Illig T, Schreiber S, Bis JC, Altshuler D, Kavousi M, Witteman JC,
Uitterlinden AG, Hofman A, Folsom AR, Barbalic M, Boerwinkle E, Kathiresan S, Reilly MP, O'Donnell CJ, Samani NJ, Schunkert H, Cambien F, Lackner KJ, Tiret L,
Salomaa V, Munzel T, Ziegler A, Blankenberg S. A genome-wide association study identifies LIPA as a susceptibility gene for coronary artery disease. Circ Cardiovasc
Genet. 2011; 4: 403-12. 10.1161/CIRCGENETICS.110.958728.
22 Broman KW, Murray JC, Sheffield VC, White RL, Weber JL. Comprehensive human genetic maps: individual and sex-specific variation in recombination. Am J
Hum Genet. 1998; 63: 861-9. 10.1086/302011.
23 Howie B, Fuchsberger C, Stephens M, Marchini J, Abecasis GR. Fast and accurate genotype imputation in genome-wide association studies through pre-phasing. Nat Genet. 2012; 44: 955-9. 10.1038/ng.2354.
24 O'Connell J, Gurdasani D, Delaneau O, Pirastu N, Ulivi S, Cocca M, Traglia M, Huang J, Huffman JE, Rudan I, McQuillan R, Fraser RM, Campbell H, Polasek O, Asiki G, Ekoru K, Hayward C, Wright AF, Vitart V, Navarro P, Zagury JF, Wilson JF, Toniolo D, Gasparini P, Soranzo N, Sandhu MS, Marchini J. A general approach for haplotype phasing across the full spectrum of relatedness. PLoS Genet. 2014; 10: e1004234. 10.1371/journal.pgen.1004234.
25 Howie BN, Donnelly P, Marchini J. A flexible and accurate genotype imputation method for the next generation of genome-wide association studies.
PLoS Genet. 2009; 5: e1000529. 10.1371/journal.pgen.1000529.
26 Delaneau O, Marchini J, Genomes Project C, Genomes Project C. Integrating sequence and array data to create an improved 1000 Genomes Project haplotype reference panel. Nat Commun. 2014; 5: 3934. 10.1038/ncomms4934.
27 Li Y, Willer C, Sanna S, Abecasis G. Genotype imputation. Annu Rev Genomics
Hum Genet. 2009; 10: 387-406. 10.1146/annurev.genom.9.081307.164242.
28 Li Y, Willer CJ, Ding J, Scheet P, Abecasis GR. MaCH: using sequence and genotype data to estimate haplotypes and unobserved genotypes. Genet Epidemiol. 2010; 34: 816-34. 10.1002/gepi.20533.
29 Rocanin-Arjo A, Cohen W, Carcaillon L, Frere C, Saut N, Letenneur L, Alhenc-Gelas M, Dupuy AM, Bertrand M, Alessi MC, Germain M, Wild PS, Zeller T, Cambien F, Goodall AH, Amouyel P, Scarabin PY, Tregouet DA, Morange PE, CardioGenics C. A meta-analysis of genome-wide association studies identifies ORM1 as a novel gene controlling thrombin generation potential. Blood. 2014; 123: 777-85.
10.1182/blood-2013-10-529628.
30 Fuchsberger C, Abecasis GR, Hinds DA. minimac2: faster genotype imputation. Bioinformatics. 2015; 31: 782-4. 10.1093/bioinformatics/btu704. 31 Lip GYH, Hull RD. Rationale and indications for indefinite anticoagulation in patients with venous thromboembolism. UpToDate, Last updated: Oct 19, 2015 edn: Wolters Kluwer, 2015, Topic 94740 Version 12.0.
32 Cutlip D, Levin T. Antithrombotic therapy for elective percutaneous coronary intervention: General use. UpToDate, Last updated: Sep 14, 2015 edn: Wolters Kluwer, 2015, Topic 1576 Version 31.0.
33 Almasy L, Blangero J. Multipoint quantitative-trait linkage analysis in general pedigrees. Am J Hum Genet. 1998; 62: 1198-211. 10.1086/301844.
34 Heath SC. Markov chain Monte Carlo segregation and linkage analysis for oligogenic models. Am J Hum Genet. 1997; 61: 748-60. 10.1086/515506.
35 Kass RE, Raftery AE. Bayes Factors. Journal of the American Statistical
36 Wijsman EM, Yu D. Joint oligogenic segregation and linkage analysis using bayesian Markov chain Monte Carlo methods. Mol Biotechnol. 2004; 28: 205-26. 10.1385/MB:28:3:205.
37 Kong X, Murphy K, Raj T, He C, White PS, Matise TC. A combined linkage-physical map of the human genome. Am J Hum Genet. 2004; 75: 1143-8.
10.1086/426405.
38 Zhou X, Stephens M. Genome-wide efficient mixed-model analysis for association studies. Nat Genet. 2012; 44: 821-4. 10.1038/ng.2310.
39 Willer CJ, Li Y, Abecasis GR. METAL: fast and efficient meta-analysis of genomewide association scans. Bioinformatics. 2010; 26: 2190-1.
10.1093/bioinformatics/btq340.
40 Craiu RV, Sun L. Choosing the lesser evil: Trade-off between false discovery rate and non-discovery rate. Statistica Sinica. 2008; 18: 861-9.
41 Almasy L, Blangero J. Exploring positional candidate genes: linkage conditional on measured genotype. Behav Genet. 2004; 34: 173-7.
10.1023/B:BEGE.0000013731.03827.69.
42 Erbilgin A, Civelek M, Romanoski CE, Pan C, Hagopian R, Berliner JA, Lusis AJ. Identification of CAD candidate genes in GWAS loci and their expression in vascular cells. J Lipid Res. 2013; 54: 1894-905. 10.1194/jlr.M037085.
43 Castoldi E, Simioni P, Tormene D, Rosing J, Hackeng TM. Hereditary and acquired protein S deficiencies are associated with low TFPI levels in plasma. J
Thromb Haemost. 2010; 8: 294-300. 10.1111/j.1538-7836.2009.03712.x.
44 Mulder R, ten Kate MK, Kluin-Nelemans HC, Mulder AB. PROS1 Heerlen polymorphism is associated with increased free plasma tissue factor pathway inhibitor levels. Thromb Haemost. 2012; 107: 594-6. 10.1160/TH11-08-0549. 45 Duckers C, Simioni P, Spiezia L, Radu C, Gavasso S, Rosing J, Castoldi E. Low plasma levels of tissue factor pathway inhibitor in patients with congenital factor V deficiency. Blood. 2008; 112: 3615-23. 10.1182/blood-2008-06-162453.
46 Ward LD, Kellis M. HaploReg: a resource for exploring chromatin states, conservation, and regulatory motif alterations within sets of genetically linked variants. Nucleic Acids Res. 2012; 40: D930-4. 10.1093/nar/gkr917.
47 Roadmap Epigenomics C, Kundaje A, Meuleman W, Ernst J, Bilenky M, Yen A, Heravi-Moussavi A, Kheradpour P, Zhang Z, Wang J, Ziller MJ, Amin V, Whitaker JW, Schultz MD, Ward LD, Sarkar A, Quon G, Sandstrom RS, Eaton ML, Wu YC, Pfenning AR, Wang X, Claussnitzer M, Liu Y, Coarfa C, Harris RA, Shoresh N, Epstein CB, Gjoneska E, Leung D, Xie W, Hawkins RD, Lister R, Hong C, Gascard P, Mungall AJ, Moore R, Chuah E, Tam A, Canfield TK, Hansen RS, Kaul R, Sabo PJ, Bansal MS, Carles A, Dixon JR, Farh KH, Feizi S, Karlic R, Kim AR, Kulkarni A, Li D, Lowdon R, Elliott G, Mercer TR, Neph SJ, Onuchic V, Polak P, Rajagopal N, Ray P, Sallari RC, Siebenthall KT, Sinnott-Armstrong NA, Stevens M, Thurman RE, Wu J, Zhang B, Zhou X, Beaudet AE, Boyer LA, De Jager PL, Farnham PJ, Fisher SJ, Haussler D, Jones SJ, Li W, Marra MA, McManus MT, Sunyaev S, Thomson JA, Tlsty TD, Tsai LH, Wang W, Waterland RA, Zhang MQ, Chadwick LH, Bernstein BE, Costello JF, Ecker JR, Hirst M, Meissner A, Milosavljevic A, Ren B, Stamatoyannopoulos JA, Wang T, Kellis M. Integrative
analysis of 111 reference human epigenomes. Nature. 2015; 518: 317-30. 10.1038/nature14248.
48 Park SM, Gonen M, Vu L, Minuesa G, Tivnan P, Barlowe TS, Taggart J, Lu Y, Deering RP, Hacohen N, Figueroa ME, Paietta E, Fernandez HF, Tallman MS, Melnick A, Levine R, Leslie C, Lengner CJ, Kharas MG. Musashi2 sustains the mixed-lineage leukemia-driven stem cell regulatory program. J Clin Invest. 2015; 125: 1286-98. 10.1172/JCI78440.
49 Hahm K, Cobb BS, McCarty AS, Brown KE, Klug CA, Lee R, Akashi K, Weissman IL, Fisher AG, Smale ST. Helios, a T cell-restricted Ikaros family member that
quantitatively associates with Ikaros at centromeric heterochromatin. Genes Dev. 1998; 12: 782-96.
50 Thornton AM, Korty PE, Tran DQ, Wohlfert EA, Murray PE, Belkaid Y, Shevach EM. Expression of Helios, an Ikaros transcription factor family member,
differentiates thymic-derived from peripherally induced Foxp3+ T regulatory cells. J
Immunol. 2010; 184: 3433-41. 10.4049/jimmunol.0904028.
51 Crawley J, Lupu F, Westmuckett AD, Severs NJ, Kakkar VV, Lupu C.
Expression, Localization, and Activity of Tissue Factor Pathway Inhibitor in Normal and Atherosclerotic Human Vessels. Arteriosclerosis, Thrombosis, and Vascular
Biology. 2000; 20: 1362-73. 10.1161/01.atv.20.5.1362.
52 Novo G, Caplice N, Tantillo R, Bonura F, Simari R, Novo S. TFPI antigen and activity levels in patients with asymptomatic atherosclerosis and target organ acute and chronic complications. Int Angiol. 2005; 24: 366-71.
53 Soejima H, Ogawa H, Yasue H, Kaikita K, Nishiyama K, Misumi K, Takazoe K, Miyao Y, Yoshimura M, Kugiyama K, Nakamura S, Tsuji I, Kumeda K. Heightened tissue factor associated with tissue factor pathway inhibitor and prognosis in patients with unstable angina. Circulation. 1999; 99: 2908-13.
54 Winckers K, Siegerink B, Duckers C, Maurissen LF, Tans G, Castoldi E, Spronk HM, Ten Cate H, Algra A, Hackeng TM, Rosendaal FR. Increased tissue factor
pathway inhibitor activity is associated with myocardial infarction in young women: results from the RATIO study. J Thromb Haemost. 2011; 9: 2243-50. 10.1111/j.1538-7836.2011.04497.x.
55 Brodin E, Borvik T, Sandset PM, Bonaa KH, Nordoy A, Hansen JB. Coagulation activation in young survivors of myocardial infarction (MI)--a population-based case-control study. Thromb Haemost. 2004; 92: 178-84. 10.1267/THRO04070178. 56 Winckers K, Ten Cate-Hoek AJ, Beekers KC, Erkens P, Hamulyak K, Ten Cate H, Hackeng TM. Impaired tissue factor pathway inhibitor function is associated with recurrent venous thromboembolism in patients with first unprovoked deep venous thrombosis. J Thromb Haemost. 2012; 10: 2208-11.
10.1111/j.1538-7836.2012.04884.x.
57 Wood JP, Ellery PE, Maroney SA, Mast AE. Biology of tissue factor pathway inhibitor. Blood. 2014; 123: 2934-43. 10.1182/blood-2013-11-512764.
58 Dahm AE, Andersen TO, Rosendaal F, Sandset PM. A novel anticoagulant activity assay of tissue factor pathway inhibitor I (TFPI). J Thromb Haemost. 2005; 3: 651-8. 10.1111/j.1538-7836.2005.01237.x.
Table 1. Study sample characteristics
Characteristic F5L Family
Study (N=251) (N=1033) MARTHA AtheroGene (N=892)
Female Sex, N (%) 126 (50.2) 684 (66.2) 200 (22.4) Mean age (SD) 40.5 (18.0) 47.5 (15.2) 61.1 (9.8) History of Thrombosis*, N (%) 15 (6.0) 1033 (100) 271 (30.4) Mean TFPI (SD), in ng/mL 8.3 (3.8) 13.5 (6.5) 24.8 (40.4) F5L Mutation Carrier, N (%) 63 (25.1) 237 (22.9) ND Current smoker 61 (24.3) 234 (22.7) 360 (40.3) Female hormone therapy use, N
(%) 18 (7.2) 66 (6.4) ND
Mean body mass index (SD), in
kg/m2 26.9 (5.9) 25.4 (4.8) 27.6 (3.7)
Antiplatelet use, N (%) 17 (6.8) 69 (6.7) 753 (84.4) Anticoagulant use, N (%)
Vitamin K antagonists 8 (3.2) 235 (22.7) ND Heparin (Low molecular
weight or unfractioned) 0 0 359 (40.2) N denotes number; SD, standard deviation; TFPI, tissue factor pathway inhibitor; F5L, the F5 Leiden mutation, and ND, not determined.
*Thrombosis is defined as venous thromboembolism in the F5L Family Study and in
Table 2. Six independent SNPs (r2<1 in the 1000 Genomes Phase 1 reference population), were associated with TFPI plasma
levels in a meta-analysis of the F5L and MARTHA study samples (FDR q-value<0.10), and were tested for replication in AtheroGene
Meta-Analysis AtheroGene
SNP Position (hg19) Alleles* Study
Sample MAF Effect †
(SE) P I2 Het P Effect †
(SE) P FDR q-value MAF Effect † (SE) P rs58075497 213477859 A/C F5L 0.07 0.12 (0.06) 0.042 0 0.812 0.14 (0.03) 7.61x10⁻⁶ 0.052 0.07 (0.08) -0.07 0.364 MARTHA 0.07 (0.04) 0.14 6.64x10⁻⁵ rs62187961 213503382 C/G F5L 0.09 0.14 (0.06) 0.017 0 0.827 0.12 (0.03) 1.25x10⁻⁵ 0.052 0.08 (0.08) -0.12 0.129 MARTHA 0.08 (0.03) 0.12 2.94x10⁻⁴ rs58997504 213532247 G/T F5L 0.07 0.11 (0.06) 0.061 0 0.718 0.13 (0.03) 3.29x10⁻⁵ 0.099 0.07 (0.08) -0.16 0.058 MARTHA 0.06 (0.04) 0.14 1.94x10⁻⁴ rs62187992 213542695 G/A F5L 0.06 0.16 (0.07) 0.020 0 0.719 0.13 (0.03) 3.38x10⁻⁵ 0.099 0.07 (0.08) 0.17 0.042 MARTHA 0.06 (0.04) 0.13 6.27x10⁻⁴ rs16851554 215024392 T/G F5L 0.09 -0.15 (0.06) 0.008 0 0.374 -0.11 (0.02) 3.50x10⁻⁶ 0.052 0.13 (0.08) -0.05 0.581 MARTHA 0.14 (0.02) -0.10 8.48x10⁻⁵ rs17816758 215073685 C/T F5L 0.12 -0.18 (0.06) 0.001 0 0.321 -0.14 (0.03) 1.51x10⁻⁶ 0.052 0.07 (0.08) 0.02 0.852 MARTHA 0.08 (0.03) -0.12 3.12x10⁻⁴
MAF denotes minor allele frequency; SE, standard error; Het, heterogeneity; and FDR, false discovery rate.
*Allele format is major/minor. †Effect is relative to the minor allele.
Table 3. Sensitivity analyses of the association between rs62187992 and TFPI plasma levels in the F5L Family and MARTHA
studies
F5L Family Study MARTHA
N Effect (SE) P N Effect (SE) P
Primary analysis 251 0.16 (0.07) 0.020 1033 0.13 (0.04) 6.27E-04 Covariate adjustment* 227 0.16 (0.06) 0.015 848 0.06 (0.04) 0.088
Males 125 0.26 (0.09) 0.008 349 0.11 (0.05) 0.038
Females 126 0.08 (0.09) 0.363 684 0.11 (0.05) 0.022
Body mass index <25 kg/m2 108 0.15 (0.09) 0.102 524 0.15 (0.05) 0.006
Body mass index ≥25 kg/m2 140 0.21 (0.10) 0.046 470 0.08 (0.05) 0.096
No history of venous thromboembolism 234 0.19 (0.07) 0.006 NA NA NA History of venous thromboembolism 15 0.05 (0.26) 0.864 1033 0.13 (0.04) 6.27E-04 F5L non-carriers 188 0.11 (0.08) 0.169 793 0.11 (0.04) 0.006 F5L carriers 63 0.23 (0.14) 0.103 237 0.07 (0.09) 0.436
No female hormone therapy use 225 0.17 (0.07) 0.017 966 0.11 (0.04) 0.002 No antithrombotic drug use† 200 0.15 (0.07) 0.046 729 0.12 (0.04) 0.004
Excluding extreme values‡ 248 0.12 (0.06) 0.059 1028 0.11 (0.04) 0.003
N denotes number, SE, standard error, and F5L, the F5 Leiden mutation.
*Covariate adjustment included HDL, lipoprotein (a), von Willebrand Factor, and FVII in the F5L Family Study, and oral
contraceptives, F5L mutation, body mass index, von Willebrand Factor, and protein S in MARTHA. In both study samples, potential covariates were identified from the literature, and associated covariates were identified by backwards model selection.
†Antithrombotic medication included vitamin K antagonists and antiplatelet agents.
‡Extreme values were defined as greater than three times the interquartile range from the third quartile in the study sample
Supplementary Table 2. Previously reported SNPs in the TFPI gene were not
associated with TFPI plasma levels in the F5L Family or MARTHA studies
SNP Position (hg19) Alleles* Study Sample MAF Effect†
(SE) P rs5940 188331704 C/T F5L 0.17 0.04 (0.05) 0.39 MARTHA 0.025 (0.11) 0.05 0.66 rs7586970 188343497 T/C F5L 0.21 -0.02 (0.04) 0.65 MARTHA 0.33 (0.02) -0.03 0.06 MAF denotes minor allele frequency; SE, standard error; Het, heterogeneity; and FDR, false discovery rate.
*Allele format is major/minor. †Effect is relative to the minor allele.