HAL Id: hal-00282447
https://hal.archives-ouvertes.fr/hal-00282447
Submitted on 27 May 2008HAL is a multi-disciplinary open access archive for the deposit and dissemination of sci-entific research documents, whether they are pub-lished or not. The documents may come from teaching and research institutions in France or abroad, or from public or private research centers.
L’archive ouverte pluridisciplinaire HAL, est destinée au dépôt et à la diffusion de documents scientifiques de niveau recherche, publiés ou non, émanant des établissements d’enseignement et de recherche français ou étrangers, des laboratoires publics ou privés.
A Chemical Microsystem for selective detection of
polluting gases in vehicle compartments
Alain Pauly, Jérôme Brunet, Christelle Varenne, Bernard Lauron, Vicente
Parra, Marcel Bouvet, Marc Dubois, André Hamwi
To cite this version:
Alain Pauly, Jérôme Brunet, Christelle Varenne, Bernard Lauron, Vicente Parra, et al.. A Chemical Microsystem for selective detection of polluting gases in vehicle compartments. Sensors & Actuators for Advanced Powertrain Applications, Oct 2007, PARIS, France. �hal-00282447�
A Chemical Microsystem for selective detection of polluting gases
in vehicle compartments.
Alain PAULY1, Jérôme BRUNET1, Christelle VARENNE1, Bernard LAURON1, Vicente PARRA2, Marcel BOUVET2, Marc DUBOIS3, André HAMWI3.
1: LASMEA, UMR 6602 CNRS/Université Blaise Pascal, 63177 AUBIERE Cedex France
2: CIM2, UMR 7071 CNRS/Université Pierre & Marie Curie Paris 6, 4, Place Jussieu, 75252 Paris Cedex 05
France
3: LMI, UMR 6002 CNRS/Université Blaise Pascal, 63177 Aubière Cedex France Abstract: This paper deals with the design of an
original microsystem devoted to the real time monitoring of air polluting gases in vehicle compartments. The selective detection is focused on two species, ozone and nitrogen dioxide, because of their specific toxicity. The gas sensing element is made of thin layers of an organic semiconductor provided with a specific chemical filter. A particular methodology of measurement is implemented, witch allows a selective sensing behaviour. On-board tests are presented.
Keywords: microsystem, gas sensor, polluting gases, ozone, nitrogen dioxide.
1. Introduction
Air pollution usually results from abnormal concentration of one or more chemical agents commonly emitted into the atmosphere. Most of these pollutants are associated with fossil fuel consumption from stationary sources or mobile sources such as motor vehicles. In industrialized countries, atmospheric pollution is not only an environmental problem but also induces serious health hazards on humans. People in urban areas spend a considerable amount of time commuting between their workplaces and homes. Thus, exposure to urban pollutants during commuting has become a concern to the general public. Traffic related exposure is known to contribute considerably to the daily total human exposure. This is especially true during peak traffic hours when most vehicles are idling or moving slowly.
The real time monitoring of in-vehicle pollutant concentrations by means of on-board devices to control the bus drivers’ exposure would be helpful even essential.
2. Gas sensors devoted to air pollution monitoring
Most studies dedicated to the determination of occupational and non-occupational exposures to traffic-related type tracer pollutants have been realized by means of passive samplers [1-4] or commercial spectroscopic gas analyzers [5-7].
exposure to most auto-pollutants are generally much higher for automobile drivers and passengers than at nearby ambient air monitoring stations or even on road sides. Driver’s exposures to these pollutants significantly exceed those endured by bicyclists, pedestrians and public transit riders.
Thus, we must distinguish two types of exposure: - the non-occupational exposure which mainly
affects pedestrians, cyclists, motorcyclists, car drivers, commuters, street residents [8-16],
- the occupational exposure which concerns taxi, bus and truck drivers but also postmen or city sweepers [3,6,7,17]. We point out that these professional groups are especially exposed because they are affected by urban pollution in non-occupational context too.
Amongst all polluting gases present in atmosphere, one can mention:
- Carbon monoxide (CO), resulting of fuel combustion in air (in engine for example), can poison blood by taking the place of oxygen molecules. This gas is very toxic and even lethal in high quantity.
- Sulphur dioxide (SO2), created by the combustion
of fossil combustibles containing sulphur and or by industrial processes, causes lung irritation and in the presence of humidity, form acid rains which are noxious for constructions and vegetation. We can notice that the rate of sulphur dioxide in atmosphere has been reduced since the last years because of the reduction of sulphur in fuel and the reduction of fuel combustion in industry. - Volatile Organic Compounds (VOCs) are formed
by several gases: hydrocarbons come from fuel and petroleum products, solvents come from paints and inks, organic compounds generated by combustion processes, nature and farming. They involve respiratory difficulties and irritation and play a fundamental role in the formation of ozone in the low atmosphere.
- Nitrogen oxides (NOx: NO and NO2) come from
cars exhausts and combustion processes and during the last years the concentration of these gases in atmosphere has increased with traffic and number of buildings. Nitrogen oxides involve lung irritations, decrease the fixation of oxygen molecules on red blood corpuscles, contribute to
rate in the low atmosphere. Nitrogen monoxide is unstable and forms quickly NO2, which is an
oxidizing gas, according to the reaction: NO + ½ O2 → NO2 (1)
- Ozone (O3) is a strong oxidising gas. It causes eye
and lung irritations, cough and respiratory troubles, contributes to the greenhouse effect and vegetation degradation. It is produced by action of light on nitrogen oxides. Under the influence of U.V rays, a nitrogen dioxide molecule generates one atomic oxygen O•:
NO2 → NO + O• (2)
By combination between the atomic oxygen and the molecular oxygen, one molecule of O3 is formed
following the process:
O• + O2 → O3 (3)
But, the concentration of O3 is limited by the
reaction:
NO + O3 → NO2 + O2 (4)
As a consequence, ozone concentration is not usually maximum at the direct source of NOx emission.
In France, the network of air quality control, named AtMO, measures, at different places, the concentration of each pollutant. The devices commonly used to control air quality devoted to those three chemical species are commercial gas analyzers whose principle of measurements is based on spectroscopic analysis.
The measurement methods used in commercial gas analyzers are summarized in Table 1. Among all gases mentioned and involved in the air pollution, in particular in urban environment, ozone (O3), nitrogen
dioxide (NO2) are the compounds whose detection is
of premium importance because of their toxicity. Most of NOx from traffic are emitted as NO, which is
less dangerous than NO2 [18,19].
In spite of the efforts made for several years by the car manufacturers aiming to the reduction in the gas pollutant emissions, the growing of the O3 rate does
not cease, and NOx emissions do not move back.
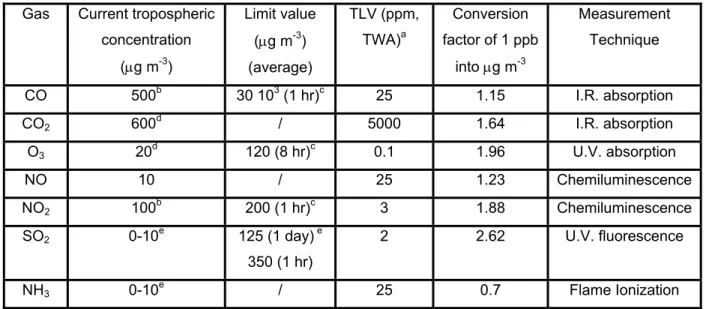
Table 1 : The analysis of atmospheric pollutants Gas Current tropospheric
concentration (µg m-3) Limit value (µg m-3) (average) TLV (ppm, TWA)a Conversion factor of 1 ppb into µg m-3 Measurement Technique CO 500b 30 103 (1 hr)c 25 1.15 I.R. absorption CO2 600d / 5000 1.64 I.R. absorption O3 20d 120 (8 hr)c 0.1 1.96 U.V. absorption NO 10 / 25 1.23 Chemiluminescence NO2 100b 200 (1 hr)c 3 1.88 Chemiluminescence SO2 0-10e 125 (1 day) e 350 (1 hr) 2 2.62 U.V. fluorescence NH3 0-10e / 25 0.7 Flame Ionization
a: Recommendation of the American Conference of Governmental Industrial Hygienists (ACGIH) 1998-1999; except for O3 : ACGIH 1999-2000.
TLV (Threshold Limit Value) is the maximum permissible concentration of a material, generally expressed in parts per million in air for some defined period of time (often 8 hours, but sometimes for 40 hours per week over an assumed working lifetime).
TWA (Time Weighted Average) This term is used in the specification of Occupational Exposure Limits (OELs) to define the average concentration of a chemical to which it is permissible to expose a worker over a period of time, typically 8 hours.
b: Airparif, Paris - France 2003.
c: Recommendations of the WHO (World Health Organisation).
d:Carbon Dioxide Information Analysis Center, U.S. Department of Energy. e: Swiss Agency for the Environment, Forests and landscape.
Gas microsensors are potentially suitable for monitoring such species thanks to their low dimensions, their low consumption power, their high level of mobility, their electric output signal easily exploited by on-board electronic systems and their ability to deliver real time response. Of course, these systems would operate in ranges of measurement compatible with the concentrations of pollutants found in the atmosphere. This answer requires the development of new sensors that are selective to the target polluting species. The search for sensing structures devoted to the detection of various polluting species such as the COVs (Volatile Organic Compounds), nitrogen oxides, dust, sulphur dioxide, carbon monoxide and ozone, knew a recent passion within universities but also in industrial research laboratories. Most of them are resistive sensors with semiconductors made from a thin layer of semiconducting material whose rate of doping is modulated by the concentration of involved gas, which injects, or traps, the free charge carriers starting from the surface exposed to the gas environment. The major advantages of this method of transduction are: i) its great easiness of implementation, ii) the potential manufacturing of the sensors by means of traditional technologies of the micro electronics, iii) as well as the easy insertion of the structures within signal treatment units located downstream from the sensor. Some of these sensors are in primary research stage, others are in process of industrialization, and others are still marketed. However, many show prejudicial drifts of the responses in time. None of them is selective to a particular gas but they have rather a selectivity associated with a type of gases with close chemical properties. In order to compensate this lack of selectivity, many researches were devoted to the use of sensors array owing sufficiently different sensitivities with respect to a particular gas [20]. The aim was to carry out a discrimination by means of the metrological data processing. If it is possible to recognize a particular gas by this means, it is difficult to determine quantitatively its concentration. Currently, the developed gas sensors are thus not easily usable as such to carry out the metrology of the air quality.
3 - Target gases and interfering species: preliminary study.
Gaseous and particular pollutants are monitored in FRANCE by AtMO network continuously by commercial gas analyzers implemented in fixed and air-conditioned stations at rural and urban places. Since these stations are not located on the roads, the concentrations measured for primary pollutants are often different than those really present in the traffic [4,6-8,12,13,19]. So, in order to estimate the air quality in the vehicle compartment, it is difficult to rely on the fixed stations measurements. Therefore,
it is judicious and more efficient to perform in-vehicle measurements.
To determine the concentration level of ozone and nitrogen dioxide in vehicle on urban streets, preliminary measurements have been carried out. An experimental vehicle equipped with two commercial gas analyzers (ultraviolet photometric ozone analyzer, model 49i, Thermo Electron Corporation, and chemiluminescent nitrogen oxides analyzer, model 42i, Thermo Electron Corporation) parked in Clermont-Ferrand down town (140000 inhabitants; population density: 3200 inhab/km² ) near a high density traffic road and close to one monitoring station of the regional air quality control network (AtMO-Auvergne) is used to measure in-vehicle oxidising pollution as a function to ambient air pollution. NO2 and O3 concentrations
are recorded every 5 minutes in a vehicle and compared to data of fixed station delivered every 15 minutes. Moreover, to reproduce bus working conditions, i.e. cyclic gate opening/closing sequence, outdoor atmospheric air is injected into the vehicle every hour during 10 minutes by means of an electric fan.
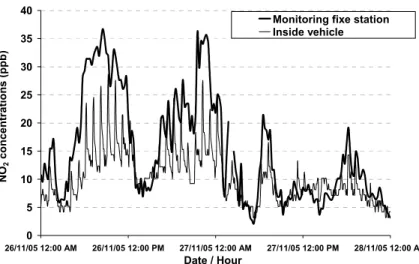
Figures 1 and 2 represent respectively the variations of NO2 and O3 concentrations during two days
measured by commercial analyzers, in the vehicle (thin line) and simultaneously in ambient atmosphere by the nearest air quality control station (thick line). Although the variation magnitudes are in the same order for these two oxidising gases in outdoor atmosphere, in-vehicle concentration variations are noticeably different. As illustrated in the figures, the average concentration of NO2 in the vehicle at the
end of each period in which the fan is switched off is higher than this relative to O3 : ozone is quickly
decomposed in passenger compartments whereas nitrogen dioxide remains the predominant oxidising gas. Such a phenomenon has been already quantified [6-12]. Moreover, if passenger compartments contribute to the dissociation of ozone, traffic density near the vehicle is another parameter leading to the same tendency. Indeed, in urban area, a high proportion of nitrogen oxides is rejected by fuel engines as NO [21]. But, ozone reacts very easily with nitric oxide to produce nitrogen dioxide in accordance with the reaction (4). So, in heavy urban traffic the concentration of O3 is
rather low whereas NO2 is predominant.
Consequently, in experimental conditions where the vehicle is driving on urban roads, the device measurements will be easily correlated to the variations of in-vehicle nitrogen dioxide level. But, in different conditions, for example when the car is moving on the outskirts of cities, outdoor ozone level becomes larger than that of nitrogen dioxide. Then, the two gases are likely to be present in the passenger compartment, so that they must be monitored.
4 - Gas sensors Microsystems 4 – 1 Gas sensors structures
In gas sensor application, the detection method may consist in following the variations of physico-chemical parameters, such as the conductivity resulting from modifications in gaseous environment of the sensing layer [22]. Then, the potentially detectable gases are these ones able to induce reversible oxidizing or reducing reactions with molecules of the layer. The use of sensing structures made of organic materials may lead to particular detection properties associated to the specific aspects of their interactions with gases. All experimental results show that neutral organic material thin films, like standard phthalocyanines ones (see Figure 3), are very sensitive to oxidising
(O2) and strongly oxidising gases (O3, NO2, Cl2) [23].
For instance, only few ppb of NO2 induces large shift
in lead phthalocyanine conductivity [24]. But the conductivity of such materials is rather insensitive to reducing species like NO, NH3, CO, even used in
large concentration (%). Thus, metallophthalocyanines are promising materials to selectively detect strong oxidising gases giving a specific selectivity to this class of species.
The resistive molecular semiconductor sensor consists in a thin film of 300 nm copper phthalocyanine (CuPc C32H16CuN8) (Figure 3)
deposited under vacuum on an alumina substrate (3x5 mm2) fitted with interdigitated Pt electrodes to measure the conductivity of the sensitive layer (Figure 4). 0 5 10 15 20 25 30 35 40 26/11/05 12:00 AM 26/11/05 12:00 PM 27/11/05 12:00 AM 27/11/05 12:00 PM 28/11/05 12:00 AM Date / Hour NO 2 concentrations (ppb )
Monitoring fixe station Inside vehicle
Figure 1: Comparison between NO2 concentration variations in ppb measured by commercial chemiluminescent
NOX analyzer in car passenger compartment (—) to those recorded at the same time by analyzer of the nearest
station of air quality control network AtMO AUVERGNE (▬) during 2 days. To reproduce gate opening/closing sequence of urban buses, outdoor atmosphere is injected by means of an electric fan during 10 minutes each hour. 0 5 10 15 20 25 30 35 40 26/11/05 12:00 AM 26/11/05 12:00 PM 27/11/05 12:00 AM 27/11/05 12:00 PM 28/11/05 12:00 AM Date / Hour O3 c onc en tr at io n s (p pb)
Monitoring fixe station Inside vehicle
Figure 2 : Comparison between O3 concentration variations in ppb measured by commercial UV photometric
O3 analyzer in car passenger compartment (—) to those recorded at the same time by analyzer of the nearest
station of air quality control network AtMO AUVERGNE (▬) during 2 days. In vehicle, outdoor air is injected by means of electric fan each hour during 10 minutes each your.
Figure 3: View of copper phthalocyanine molecule (80% van der Waals radii)
On the other side of the substrate a Pt resistor is screen-printed for heating.
4 –2 Gas sensor results
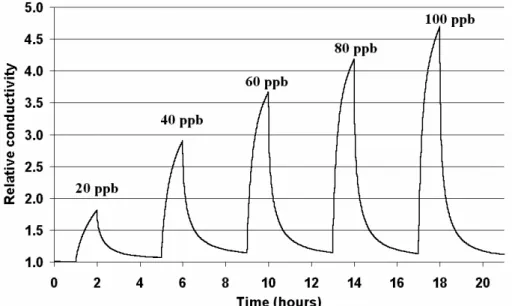
Figure 5 represents the conductivity variations of a 300 nm film of CuPc heated at 80°C submitted to various concentrations of ozone in air. The curves show a great variation of relative conductivity in coherence with the strong sensitivity of phthalocyanine materials in detection of oxidising gases. But, in all cases, thermodynamic equilibrium is not reached after one hour of exposure and desorption is not satisfying at 80°C. Moreover, reproducibility is also affected by the slow regeneration of the sensitive layer. The kinetics of
reactions may be improved by increasing the operating temperature. But this improvement is obtained to the detriment of the sensitivity. A compromise must be found in the context of the polluting gas detection: in order to enhance the sensitivity and in view of our application field, where very small quantities of gases are present, a low operating temperature was chosen, favoring adsorption processes.
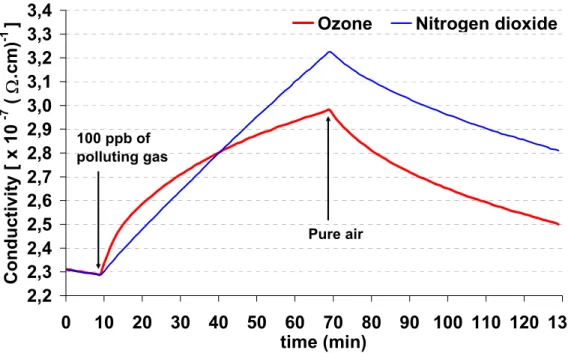
Two sensors are kept at 50°C and submitted to 100 ppb NO2 in air then to 100 ppb O3 in air. These two
results are given in Figure 6. The two polluting species give responses with roughly same sensitivities: the detection is not selective. Thus, the only assessment of the phthalocyanine sensor conductivity not allows to discriminate the nature of the polluting gas.
Figure 4: Schematic view of CuPc-based sensor device.
Figure 5: Conductivity variations of a 300 nm copper phthalocyanine layer heated at 80°C submitted to 20, 40, 60, 80, 100 ppb of ozone in air with desorption under clean air after each exposure.
2,2
2,3
2,4
2,5
2,6
2,7
2,8
2,9
3,0
3,1
3,2
3,3
3,4
0
10 20 30 40 50 60 70 80 90 100 110 120 130
time (min)
Conduct
ivi
ty [
x 10
-7(
Ω
.cm)
-1
]
Ozone
Nitrogen dioxide
100 ppb of polluting gas
Pure air
Figure 6: Conductivities of 300 nm CuPc layers at 50°C in synthetic air (20 %O2 + 80 % N2) and submitted to 100
ppb NO2 (blue line) or O3 (red line) in air.
4 – 3 Toward a selective detection of O3 by gas
sensors
The previous results relative to the copper phthalocyanine chemiresistors show:
- a lack of selectivity between ozone and nitrogen dioxide,
- a long response time, due to the diffusion of gaseous molecules in the layer.
All those problems are associated with difficulties to accomplish good evaluation of pollutants in real time.
To improve the detection characteristics, many authors have studied the dynamic response of phthalocyanine sensors under gases. In Figure 6, one can show that the kinetic of response is in favor of ozone for short exposure times. A methodology of measurement has been developed to allow the determination of the kinetics of reactions in order to bring a selective detection devoted to ozone monitoring. The principle consists in two steps:
- submission of the sensor during short time to pollutants at low temperature to favour adsorption process between sensitive material and gases and then,
- regeneration of the film under purified air at higher temperature to improve desorption process. This operation ensures the recalibration of the sensor in order to start a new period of measurements.
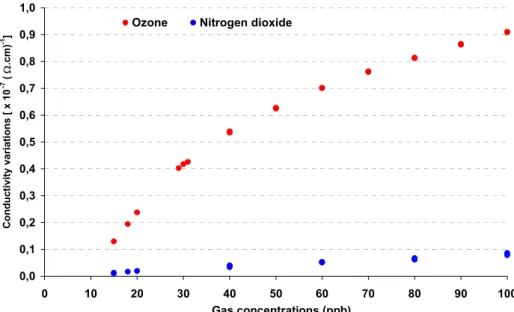
Parameters and working conditions have been optimized for O3 monitoring in atmosphere [25]. For
a period of measurement corresponding to 15
minutes the differential response ∆σ (i.e. difference of conductivity) of the sensor is given in Figure 7 giving rise to satisfying ozone selectivity because of the difference of adsorption rate between these two gases. For each concentration, ∆σ is recorded for 3 cycles of measurements. Reproducibility between each cycle is satisfying for the two oxidising gases. The 3 values of conductivity variations are approximately the same, the three points of measurements being superimposed. It can be explained by the good regeneration of the sensitive layer between each test. Others experiments have shown that the threshold of this device is under 10 ppb and that the resolution is better than 20 ppb and even 10 ppb for ozone.
Dynamic measurements avoid the problem due to too long response time as aforementioned.
4 – 4 Selectivity to NO2 as a result of
using a chemical filter
For the selective detection of NO2 in a
vehicle, ozone constitutes the most important interfering agent. Thus, to efficient monitoring of NO2
in atmosphere by phthalocyanine gas sensors, it appears necessary to eliminate O3 without altering
NO2 concentration, by means of selective filter.
Among all the material investigated as ozone filter (MnO2 powder or impregnated grids, active charcoal,
C60 powder, stainless steel cuttings, indigo
powder…), only indigo can be considered as a real selective ozone filter.
0,0 0,1 0,2 0,3 0,4 0,5 0,6 0,7 0,8 0,9 1,0 0 10 20 30 40 50 60 70 80 90 100 Gas concentrations (ppb) Conducti vi ty var ia ti o n s [ x 10 -7 ( Ω .cm ) -1]
Ozone Nitrogen dioxide
Figure 7: Conductivity variations of the CuPc-based sensor under ozone (•) and nitrogen dioxide (•) recorded during adsorption time at 80°C. For each concentration of ozone and nitrogen dioxide, the three values corresponding to three cycles of measurement are identical.
Indigo (Figure 8) is also known to be efficient to decompose ozone [26]. Indigo (KULHMANN) was recrystallized from a DMSO-water mixture, and dried at 100°C. Mass spectrum (Chemical ionization) showed the presence of only one signal at m/z = 263 (corresponding to protonated indigo molecule, MH+). Elemental analysis found the following composition C 72.30; H 3.74; N 10.57 %, in agreement with theoretical ones C 73.27; H 3.84; N 10.68 %, calculated for C16H10N2O2. Indigo was used in the
form of a powder filter working at ambient temperature, and with a minimum quantity of material to offer a significant life duration of this consumable filter.
C13 solid state NMR and FT-IR spectroscopy
performed with indigo powder pointed out that ozone reacts with indigo by an electrophilic addition to the unsaturated C-C bond to give isatin and isatoic anhydride as major reaction products [26].
On this base, passive measurement methods for ozone have been developed.
Figure 8: indigo molecule
The quantification of the filtering power of powdery materials to O3 and NO2 was led under a flow of purified
air with a controlled quantity of polluting gas through indigo. The flow was controlled by O3 and NO2 analyzers.
The results are presented in Table 2.
O3 concentration (ppb) NO2 concentration (ppb) Upstream from indigo filter (ppb) Downstream from indigo filter (ppb) Efficiency Upstream from indigo filter Downstream from indigo filter Efficiency 73 1 99 % 17 7 59 % 92 1 99 % 21 16 24 % 105 1 99 % 37 35 5 % 125 1 99 % 53 51 4 % 137 1 99 % 70 68 3 %
Whatever the concentration of ozone upstream the filter, indigo removes it with an efficiency of almost 100 %. Above 30 ppb, indigo has low influence on the concentration of NO2 diluted in the gas flow.
Indigo allows a selective elimination of ozone and a selective detection of nitrogen dioxide by a phthalocyanine gas sensor situated upstream the filter in the flow.
Indigo powder is easily sublimed to give deposited thin layers. This material is really suitable for the realization of integrated selective ozone filter elaborated as an additional evaporated filtering film onto CuPc sensitive layer. The very low intrinsic conductivity of indigo layers (σ = 2.10-10 Ω-1.cm-1)
makes them insulating. That avoids bypassing the sensitive layer. Works are in progress to optimize the structure of this composite organic gas sensor allowing a selective detection of NO2 in our context
[27].
Conclusion
We have exposed a prototype microsystem devoted to the selective measurement of nitrogen dioxide and ozone in vehicle compartment. The selective detection is achieved by means of two ways associated to two organic semiconductor gas sensors. The monitoring of the kinetic of reaction accounts for the concentration of ozone while the response of the sensor provided with an indigo filter is associated with the quantity of nitrogen dioxide. This new microsystem gas sensor achieves selectivity and real time measurements.
Acknowledgment: We would like to thank the A. N. R. project (POLL-CAP) for the financial support. References
[1] J. H. V. Wijnen, A. P. Verhoeff, H. W. A. Jans, M. V. Bruggen, The exposure of cyclists, car drivers and pedestrians to traffic-related air pollutants, International Archives of Occupational and Environmental Health 67 (1995) 187-193.
[2] L. Y. Chan, C. Y. Chan, Y. Qin, The effect of commuting microenvironement on commuter exposures to vehicular emission in Hong Kong, Atmospheric Environment 33 (1999) 1777-1787. [3] O. Hertel, P. Wilhard, R. Berkowicz, H. Skov, Exposure of bus drivers and postmen to air pollution from traffic in their working environment, Journal of Aerosol Science 28 (1997) 1102.
[4] B. Son, W. Yang, P. Breysse, T. Chung, Y. Lee, Estimation of occupational and nonoccupational nitrogen dioxide exposure for Korean taxi drivers
using microenvironmental model, Environment Research 94 (2004) 291-296.
[5] A. T. Chan, Commuter exposures and
indoor-outdoor relationships of carbon oxides in buses in Hong Kong, Atmospheric Environment 37 (2003) 3809-3815.
[6] C. C. Chan, H. Ozkaynak, J. D. Spengler, L. Sheldon, Driver exposure to Volatile Organic Compounds, CO, Ozone and NO2 under different
driving conditions, Environmental Science and Technology 25 (1991) 964-972.
[7] J.C. Limasset, F. Diebold, G. Hubert, Assessment of bus driver's exposure to the pollutants of urban traffic, The Science of the Total Environment 134 (1993) 39-49.
[8] L. Y. Chan, H. W. Y. Wu, A study of bus commuter and pesdestrian exposure to traffic air pollution in Hong Kong, Environment International 19 (1993) 121-132.
[9] G. Barrefors, G. Petersson, Exposure to volatile hydrocarbons in commuter trains and diesels buses, Environmental Technology 17 (1996) 643. [10] S. Kingham, J. Meaton, A. Sheard, O. Lawrenson, Assessment of exposure to traffic-related fumes during the journey to work, Transportation Research Part D: Transport and Environment 3 (1998) 271-274.
[11] J. H. V. Wijnen, A. P. Verhoeff, H. W. A. Jans, M. V. Bruggen, The exposure of cyclists, car drivers and pedestrians to traffic-related air pollutants, International Archives of Occupational and Environmental Health 67 (1995) 187-193.
[12] T. R. Johnson, Recent advances in the estimation of population exposure to mobile source pollutants, Journal of Exposure Analysis and Environmental Epidemiology 5 (1995) 551.
[13] L. Y. Chan, C. Y. Chan, Y. Qin, The effect of commuting microenvironement on commuter exposures to vehicular emission in Hong Kong, Atmospheric Environment 33 (1999) 1777-1787. [14] J. E. Gomez-Perales and al, Bus, minibus, metro inter-comparison of commuter's exposure to air pollution in Mexico City, Atmospheric Environment 41 (2007) 890-901.
[15] A. T. Chan, Commuter exposures and indoor-outdoor relationships of carbon oxides in buses in Hong Kong, Atmospheric Environment 37 (2003) 3809-3815.
[16] A. A. Fernandez-Bremauntz, M. R. Ashmore, Exposure of commuters to carbon monoxide in Mexico City – I. Measurements of in-vehicle
concentrations, Atmospheric Environment 29 (1995) 525-532.
[17] S. Saenghirunvattana, W. Wananukul, C. Mokkhavesa, N. Opasi, Increasing carbonmonoxide blood levels in Bangkok bus drivers, Environment International 21 (1995) 81-84.
[18] M. Kuske, J. Nicolas, Les pollutions dans l’air à l’intérieur des bâtiments. Diagnostics. Incidences sur la santé. Fondation universitaire luxembourgeoise, Province du Luxembourg, Département Prévention-Santé.
[19] F. Palmgren, R . Berkowicz, O. Hertel, E. Vignati, Effect of reduction of NOx on the NO2 levels
in urban streets, The Science of the Total Environment 189/190 (1996) 409-415.
[20] A. Guadarrama, M.L. Rodriguez-Mendez, J.A. de Saja, Conducting polymer-based array for the discrimination of odours from trim plastic materials used in automobiles, Analytica Chimica Acta 455 (2002) 41-47
[21] D. C. Carslaw, S. D. Beevers, Development of an urban inventory for road transport emissions of NO2 and comparison with estimates derived from
ambient measurements, Atmospheric Environment 39 (2005) 2049-2059.
[22] M. Passard, A. Pauly, J.P. Blanc, S. Dogo, J.P. Germain, C. Maleysson, Doping mechanisms of phthalocyanine by oxidizing gases : application to gas sensors, Thin Solid Films 237 (1994) 272-276. [23] J.D. Wright, Molecular crystals, Cambridge University Press, Cambridge, 1987.
[24] W. Göpel, J. Hesse, J.N. Zemel, Sensors : A Comprehensive survey, Vol. II, VCH, Weinheim, 1991.
[25] M. Bouvet, A. Pauly, “Molecular based gas sensors” in “ The Encyclopedia of Sensors” , Vol 6 p227-270, Edited by Craig A. Grimes, Elizabeth C. Dickey, M.V. Pishko, American Scientific Publishers, 2006.
[26] J.P. Viricelle, A. Pauly, L. Mazet, J. Brunet, M. Bouvet, C. Varenne, C. Pijolat, Selectivity improvement of semi-conducting gas sensors by selective filter for atmospheric pollutants detection”, Materials Science and Engineering C, 26 (2006) 186-195.