HAL Id: hal-02903144
https://hal.archives-ouvertes.fr/hal-02903144v2
Preprint submitted on 21 Jul 2020HAL is a multi-disciplinary open access archive for the deposit and dissemination of sci-entific research documents, whether they are pub-lished or not. The documents may come from teaching and research institutions in France or
L’archive ouverte pluridisciplinaire HAL, est destinée au dépôt et à la diffusion de documents scientifiques de niveau recherche, publiés ou non, émanant des établissements d’enseignement et de recherche français ou étrangers, des laboratoires
stereotypes in the world?
Laurent Cordonier, Florian Cafiero, Gérald Bronner
To cite this version:
Laurent Cordonier, Florian Cafiero, Gérald Bronner. Is there a relation between religiosity and gender stereotypes in the world?. 2020. �hal-02903144v2�
How to cite this paper:
Cordonier, L., Cafiero, F. & Bronner, G. (2020). Is there a relation between religiosity and gender stereotypes in the world? Working paper, https://hal.archives-ouvertes.fr/hal-02903144
Is there a relation between religiosity and gender stereotypes in the world?
Cordonier, Laurent1,2,*, Cafiero, Florian1, & Bronner, Gérald1 1 Université de Paris, LIED (CNRS, UMR 8236)
2 Université de Lausanne, THEMA (Institut des Sciences Sociales)
* Corresponding author: [email protected]
I. Introduction
In a 2020 report, the United Nations Development Programme (UNDP) points out that gender inequalities in the world have hardly decreased since 2010.1 According to the report, this situation is
partly due to the persistence of gender stereotypes, which “reinforce gendered identities and determine power relations that constrain women’s and men’s behaviour in ways that lead to inequality” (p. 6).
To measure the prevalence of gender stereotypes at country level, the UNDP uses an index called the Gender Social Norms Index (GSNI). The GSNI of a given country corresponds to the percentage of its population with at least one (GSNI) or two (GSNI2) gender stereotype(s) out of seven items tested. Overall, higher GSNI values indicate higher bias against gender equality.2
Commenting the UNDP report in the Journal de Montréal, the famous French-speaking journalist, novelist, and feminist Denise Bombardier argues that the UNDP seeks to overlook what she sees as an obvious correlation: the countries where gender stereotypes are most prevalent are Muslim countries.3
1 Human Development Perspectives report (2020), Tackling Social Norms: A game changer for gender
inequalities, United Nations Development Programme,
http://hdr.undp.org/sites/default/files/hd_perspectives_gsni.pdf
2 Human Development Perspectives report (2020), Tackling Social Norms: A game changer for gender
inequalities, United Nations Development Programme, Frequently Asked Questions – Gender Social Norms
Index (GSNI), http://hdr.undp.org/sites/default/files/frequently_asked_questions_gsni.pdf
3 Denise Bombardier says that this report “… confirme […] une corrélation que se garde bien de mettre en
évidence l’organisme des Nations unies, à savoir le lien entre le poids de la religion et les préjugés à l’égard des femmes. Les pays musulmans se situent au sommet de cette liste infâme. En Jordanie, 99,3% des gens nourrissent des préjugés. Au Qatar, 99,7%, au Nigeria, 99,7%, en Libye, 99,1%, en Malaisie, 98,5% et au Mali, 98,8%. La prime de la honte est détenue par le Pakistan, où seulement 0,2% de la population n’exprime pas de préjugés à l’endroit des femmes, selon les critères de l’étude.”
Bombardier, D. (7 mars 2020). L’égalité des sexes: les faits bruts. Le Journal de Montréal, en ligne,
https://www.journaldemontreal.com/2020/03/07/legalite-des-sexes-les-faits-bruts?fbclid=IwAR0EcsTpZI-UrKgAvEvkWUVaeqQQiYjurPTeQKU_lZzlJe1bABwfDR9QiaM
Islam would thus be a cause of the persistence of sexist stereotypes in the world and, therefore, a cause of the persistence of gender inequalities.
However, the apparent link between Islam and high levels of gender stereotypes can mask more important factors, starting with countries’ level of development. Indeed, visual inspection of the UNDP data suggests that countries with the lowest levels of gender stereotypes (Andorra, Sweden, the Netherlands, Norway, etc.) are all highly developed and educated countries.
Moreover, as Denise Bombardier herself acknowledges, some non-Muslim countries, but where religious sentiment is strong, are also at the top of the list of the most sexist countries (e.g., Zimbabwe, Ghana, the Philippines, India). Therefore, it is possible that it is not Islam per se that is associated with strong gender stereotypes, but high levels of religiosity, regardless of the religion in question.
In this working paper, we explore whether and to what extent the following three variables explain the international variance of gender stereotypes: Islam, religiosity, and development. Our results, based on data from 75 countries accounting for 81 percent of the world population, suggest that religiosity and development are more important factors explaining the international variance of gender stereotypes than Islam.
II. Material and Method
2.1 Dependent variable
Gender Social Norms Index (GSNI and GSNI2)
The GSNI of a given country corresponds to the percentage of its population with at least one (GSNI) or two (GSNI2) gender stereotype(s) out of seven items tested (e.g.: “Men make better political leaders than women do”; “University is more important for a man than for a woman”; “Men make better business executives than women do”). Overall, higher GSNI values indicate higher bias against gender equality.
The GSNI and GSNI2 are based on data from the World Values Survey wave 5 (2005–2009) and wave 6 (2010–2014). These data include 75 countries accounting for 81 percent of the world population.
Source of the data: Human Development Perspectives report (2020), Tackling Social Norms: A game changer for gender inequalities, United Nations Development Programme, Table A1, 20-21, http://hdr.undp.org/sites/default/files/hd_perspectives_gsni.pdf
2.2 Independent variables
Muslim-majority countries
The 75 countries for which we had a GSNI and a GSNI2 were classified as either predominantly Muslim countries (1) or not (0).
Muslim-majority countries (1): N = 23; other countries (0): N = 52.
Religiosity
To assess the level of religiosity of the 75 countries included in this study, we used the responses to item V9 of the World Values Survey wave 5 (2005-2009) and wave 6 (2010-2014). This item is as follows: “How religion is important in your live?” Responses range from 1 = “Very important” to 4 = “Not at all important”. We recoded the responses to this item to reverse its directionality. Therefore, in our study, responses range from 1 = “Not at all important” to 4 = “Very important”. Then, we averaged the responses by country. The average of each country corresponds to its level of religiosity.
Source of the data: World Values Survey wave 5 (2005–2009) and wave 6 (2010–2014), http://www.worldvaluessurvey.org/WVSDocumentationWV6.jsp
Human Development Index (HDI)
The UNDP describes the Human Development Index as follows: “The Human Development Index (HDI) is a summary measure of average achievement in key dimensions of human development: a long and healthy life, being knowledgeable and have a decent standard of living. The HDI is the geometric mean of normalized indices for each of the three dimensions. The health dimension is assessed by life expectancy at birth, the education dimension is measured by mean of years of schooling for adults aged 25 years and more and expected years of schooling for children of school entering age. The standard of living dimension is measured by gross national income per capita.”
We used the HDI of 2010 for all countries, which corresponds to the midpoint of the GSNI and Religiosity data collection period (2005–2014).
Source of the data: United Nations Development Programme, http://hdr.undp.org/en/data# All data used in this study are in the Appendix of this paper.
2.3 Analyses
We performed multiple linear regression analyses to assess the relation between GSNI and GSNI2, as dependent variables, and Muslim majority, Religiosity, and HDI as independent variables.
III. Results
3.1 Descriptive statistics
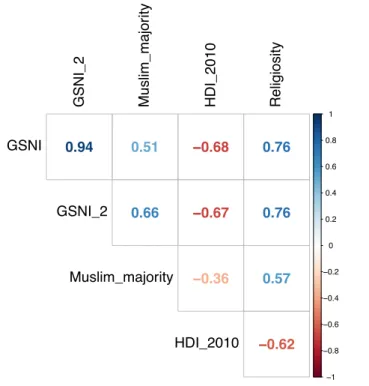
Figure 1 – Pearson correlations between all the variables. N = 75 countries. All p < 0.01.
A B
Figure 2 – Pearson correlations between Religiosity and (A) GSNI (N = 75 countries, R = 0.76, p < 0.001), (B) GSNI2 (N = 75 countries, R = 0.76, p < 0.001). Grey surfaces: confidence intervals (95%). 0.94 0.51 0.66 −0.68 −0.67 −0.36 0.76 0.76 0.57 −0.62 −1 −0.8 −0.6 −0.4 −0.2 0 0.2 0.4 0.6 0.8 1 GSNI_2 Muslim_major ity HDI_2010 Religiosity GSNI GSNI_2 Muslim_majority HDI_2010 R = 0.76 , p = 3e−15 0 25 50 75 100 2.0 2.5 3.0 3.5 4.0 Religiosity GSNI R = 0.76 , p = 4.5e−15 0 25 50 75 100 2.0 2.5 3.0 3.5 4.0 Religiosity GSNI_2
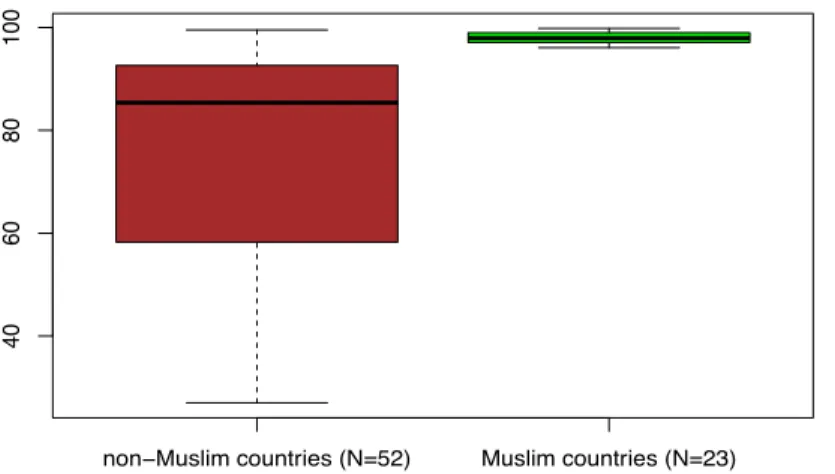
Figure 3 – GSNI of the non-Muslim countries (on the left, in brown; N = 52) and of the Muslim countries (on the right, in green; N = 23). The difference between the two groups of countries is significant (bilateral t-test: t(73)=5.09, p < 0.001).
Figure 4 – GSNI2 of the non-Muslim countries (on the left, in brown; N = 52) and of the Muslim countries (on the right, in green; N = 23). The difference between the two groups of countries is significant (bilateral t-test: t(73)=7.53, p < 0.001).
Figure 5 – Religiosity of the non-Muslim countries (on the left, in brown; N = 52) and of the Muslim countries (on the right, in green; N = 23). The difference between the two groups of countries is significant (bilateral t-test: t(73)=5.99, p < 0.001).
non−Muslim countries (N=52) Muslim countries (N=23)
40
60
80
100
non−Muslim countries (N=52) Muslim countries (N=23)
20
40
60
80
100
non−Muslim countries (N=52) Muslim countries (N=23)
2.0
2.5
3.0
3.5
Figure 6 – HDI (2010) of the non-Muslim countries (on the left, in brown; N = 52) and of the Muslim countries (on the right, in green; N = 23). The difference between the two groups of countries is significant (bilateral t-test: t(73)=3.32, p < 0.01).
3.2 Analytical statistics
Table 1 – Multiple linear regression analysis, dependent variable: GSNI; independent variables: Muslim majority, Religiosity, and HDI. N = 75 countries.
non−Muslim countries (N=52) Muslim countries (N=23)
0.4 0.5 0.6 0.7 0.8 0.9
Table 2 – Multiple linear regression analysis, dependent variable: GSNI2; independent variables: Muslim majority, Religiosity, and HDI. N = 75 countries.
IV. Discussion
Results of this study show that Islam per se is not the main cause of the persistence of gender stereotypes in the world. Among the 75 countries included in this study, the prevalence of gender stereotypes is more strongly correlated with levels of religiosity and development than with Muslim-majority countries versus other countries. Moreover, regression analyses show that religiosity and development are factors explaining the international variance of both GSNI and GSNI2, while Muslim majority is a significant additional factor in the explanation of the international variance of GSNI2 only (i.e., the percentage of the population with at least two gender stereotypes out of seven).
There are undoubtedly many other factors associated with the persistence of gender stereotypes around the world. But low levels of development – hence, low levels of education – and strong religiosity seem to play an important role in this regard.
Appendix: Data used in this study
Country GSNI GSNI_2 Muslim_majority HDI_2010 Religiosity
Algeria 97.83 87.00 1 0.730 3.88
Argentina 75.41 42.49 0 0.818 2.55 Armenia 94.11 81.28 0 0.729 3.47 Australia 46.24 23.00 0 0.866 2.18 Azerbaijan 99.14 93.82 1 0.732 2.96 Belarus 90.37 71.70 0 0.792 2.47 Brazil 89.50 52.39 0 0.726 3.40 Bulgaria 76.84 44.40 0 0.779 2.52 Burkina Faso 98.38 85.86 1 0.375 3.81 Canada 51.53 23.26 0 0.895 2.82 Chile 74.40 42.20 0 0.800 2.70 China 88.27 64.42 0 0.702 1.62 Colombia 91.40 57.21 0 0.729 3.35 Cyprus 81.05 49.44 0 0.850 3.21 Ecuador 93.34 58.90 0 0.716 3.52 Estonia 76.34 51.19 0 0.844 1.98 Ethiopia 85.27 35.14 0 0.412 3.73 Finland 51.16 22.67 0 0.903 2.48 France 56.00 26.81 0 0.872 2.28 Georgia 94.09 77.12 0 0.732 3.81 Germany 62.60 33.07 0 0.920 2.05 Ghana 99.16 92.69 0 0.554 3.91 Haiti 98.91 92.82 0 0.467 2.97 Hungary 65.89 40.36 0 0.826 2.22 India 98.28 83.25 0 0.581 3.59 Indonesia 97.44 80.36 1 0.666 3.93 Iran 98.54 92.49 1 0.756 3.72 Iraq 97.50 90.58 1 0.652 3.82 Japan 68.81 41.67 0 0.885 1.88 Jordan 99.33 95.67 1 0.728 3.93 Kazakhstan 96.22 79.02 1 0.764 2.65
Korea (Republic of) 87.07 62.91 0 0.882 2.64
Lebanon 96.08 82.33 1 0.751 3.25 Libya 99.13 92.89 1 0.757 3.96 Malaysia 98.54 88.38 1 0.773 3.81 Mali 98.82 93.36 1 0.403 3.90 Mexico 87.70 51.00 0 0.739 3.37 Moldova 90.06 67.21 0 0.681 2.98 Morocco 96.25 80.58 1 0.618 3.88 Netherlands 39.75 15.88 0 0.911 1.92 New Zealand 46.14 21.28 0 0.899 2.25 Nigeria 99.73 94.99 1 0.484 3.87 Norway 41.27 16.00 0 0.942 2.17 Pakistan 99.81 98.07 1 0.524 3.87 Palestine 98.00 92.30 1 0.671 3.84 Peru 87.96 49.99 0 0.721 3.29 Philippines 98.87 86.80 0 0.672 3.84 Poland 79.75 47.31 0 0.835 3.18 Qatar 99.73 94.90 1 0.834 3.99 Romania 85.50 60.84 0 0.797 3.34 Russian Federation 86.83 68.56 0 0.780 2.42 Rwanda 99.15 89.39 0 0.488 3.09 Serbia 82.62 48.61 0 0.762 2.86 Singapore 92.34 73.20 0 0.909 3.11 Slovenia 59.21 28.25 0 0.881 2.18 South Africa 96.32 80.90 0 0.662 3.38 Spain 50.50 25.16 0 0.865 2.06 Sweden 30.01 10.75 0 0.906 1.99 Switzerland 56.03 26.94 0 0.932 2.41 Thailand 95.47 74.50 0 0.721 3.45
Trinidad and Tobago 85.99 51.25 0 0.788 3.69
Tunisia 96.35 84.07 1 0.717 3.94
Turkey 96.52 85.70 1 0.743 3.55
Ukraine 86.53 65.40 0 0.732 2.78
United States 57.31 30.07 0 0.911 2.98 Uruguay 74.60 36.70 0 0.774 2.28 Uzbekistan 97.93 87.73 1 0.665 3.02 Viet Nam 92.89 69.17 0 0.653 2.21 Yemen 97.80 92.10 1 0.499 3.94 Zambia 96.84 80.56 0 0.531 3.71 Zimbabwe 99.52 84.78 0 0.472 3.79