HAL Id: tel-01261518
https://tel.archives-ouvertes.fr/tel-01261518
Submitted on 25 Jan 2016HAL is a multi-disciplinary open access archive for the deposit and dissemination of sci-entific research documents, whether they are pub-lished or not. The documents may come from teaching and research institutions in France or abroad, or from public or private research centers.
L’archive ouverte pluridisciplinaire HAL, est destinée au dépôt et à la diffusion de documents scientifiques de niveau recherche, publiés ou non, émanant des établissements d’enseignement et de recherche français ou étrangers, des laboratoires publics ou privés.
The bacterial communities of sand-like surface soils of
the San Rafael Swell (Utah, USA) and the Desert of
Maine (USA)
Yang Wang
To cite this version:
Yang Wang. The bacterial communities of sand-like surface soils of the San Rafael Swell (Utah, USA) and the Desert of Maine (USA). Agricultural sciences. Université Paris-Saclay, 2015. English. �NNT : 2015SACLS120�. �tel-01261518�
1 NNT : 2015SACLS120
THESE DE DOCTORAT
DE L’UNIVERSITE PARIS-SACLAY,
préparée à l’Université Paris-Sud
ÉCOLE DOCTORALE N°577
Structure et Dynamique des Systèmes Vivants
Spécialité de doctorat : Sciences de la Vie et de la Santé
Par
Mme Yang WANG
The bacterial communities of sand-like surface soils of the San Rafael Swell (Utah,
USA) and the Desert of Maine (USA)
Thèse présentée et soutenue à Orsay, le 23 Novembre 2015
Composition du Jury :
Mme. Marie-Claire Lett , Professeure, Université Strasbourg, Rapporteur Mme. Corinne Cassier-Chauvat , Directeur de Recherche, CEA, Rapporteur M. Armel Guyonvarch, Professeur, Université Paris-Sud, Président du Jury M. Olivier Martin, Directeur de Recherche, INRA, Examinateur
3
Acknowledgements
There are so many persons I would like to thank for helping me in the study and in the
life as a Ph.D. student in France. Firstly, I would like to express my sincere gratitude
to my supervisor, Pr. Michael S. DuBow, for his continuous support and guidance.
His guidance helped me in all the time of research and writing of this thesis, with his
patience and immense knowledge.
Besides my supervisor, I would like to thank the rest of my thesis committee: Prof.
Roland Mastrippolito and Prof. Olivier Lespinet, for their insightful comments and
encouragement.
My study in France was supported by the China Scholarship Council. I am very
grateful for the great opportunity they offered me to become a Ph.D. student in the
university of Paris-Sud and financial supports in life.
I am grateful to my fellow labmates of the team of Prof. Michael DuBow: Jorge
Osman, Nga Nguyen, Gustavo Ribeiro, Christophe Regeard, and Micheline Terruer,
for helping me solving the problems in research and their supports in my life in
France.
Last but not the least, I would like to thank my family, my parents and my beloved
husband for their encouragement all the time, and sharing with me all the happiness
4
Table of contents.
Acknowledgements ... 3 List of Figures ... 7 List of Tables ... 8 List of abbreviations ... 9 CHAPTER 1. Introduction ... 101.1. Identification of bacterial diversity and Next Generation Sequencing technology ... 11
1.1.1. Introduction on the development of techniques for the identification of bacteria ... 11
1 1.1.2. Introduction to 16S ribosomal RNA ... 14
1.1.3. Metagenomics and the Next Generation Sequencing techniques ... 17
1.1.4. Bioinformatics for Meta-barcode Sequencing ... 24
1.2. Arid Environments ... 30
1.2.1. Introduction to Arid Environments ... 30
1.2.2. Characteristics of Drylands and Desert Soils ... 34
1.2.3. Drylands in North America ... 37
1.2.4. Analogue Sites for Mars ... 40
1.2.5. Desertification ... 41
1.3. Desert Biodiversity ... 43
1.3.1. Plants and Animals ... 43
1.3.2. Desert Microbiology ... 45
1.3.3. Bacterial Diversity ... 48
1.3.4. Bacteria in Desert-like Environments and Bacteria involved in Weathering ... 51
1.4. Relationship of Environmental Factors and Soil Bacterial Diversity ... 53
1.4.1. General introduction to the relationships of environmental factors and soil microbial diversity ... 53
5
1.4.3. Adaptation of Bacteria to Arid Environments ... 59
1.5. Objective of Thesis ... 61
CHAPTER 2: Bacterial Communities of the Desert of Maine ... 62
Abstract ... 64
Introduction ... 65
Materials and Methods ... 67
Results ... 70 Discussion ... 73 Acknowledgements ... 78 References ... 79 Tables ... 85 Figure Legends ... 89
CHAPTER 3: Bacterial communities of the deserts in Utah ... 93
Abstract ... 95
Introduction ... 96
Materials and Methods ... 99
Results ... 102 Discussion ... 107 Acknowledgements ... 112 References ... 113 Tables ... 121 Figure Legends ... 127
4. CHAPTER 4: Discussion and perspective ... 132
4.1. Discussion ... 133
4.1.1. Quality Control ... 134
4.1.2. Chimera Check ... 138
4.1.3. Taxonomic Classification of Sequences ... 142
4.1.4. OTU Clustering ... 145
6
7
List of Figures
Figure 1.1. Nucleic acid-based methods in identifying bacteria. ... 13
Figure 1.2. Distribution of variable regions in 16S rRNA from E. coli (Chuan et al 2014). ... 14
Figure 1.3. Three-domain system based on taxonomy of 16S rRNA, Carl Woese and George E. Fox, 1977 ... 15
Figure 1.4. 16S rRNA secondary structure, adapted from Y. Pablo (2014) ... 17
Figure 1.5. The 454 pyrosequencing chemistry (Petrosino et al 2009) ... 20
Figure 1.6. Process of Pyrosequencing (Margulies et al 2005). ... 21
Figure 1.7. Process of Illumina Sequencing ... 22
Figure 1.8. Analysis Process of Data from Meta-barcode Sequencing. ... 24
Figure 1.9. Map of Global Distribution of Dry Land. Regions with declined color follows the aridity index (AI) of the UNEP. Arrows show the major intercontinental trajectories for desert dust (Laitty 2009). ... 31
Figure 1.10. Classification of deserts. The pictures are from three different types of deserts: A. the Arabian Desert; B. the Gobi Desert; C. the Nambi Desert ... 32
Figure 1.11. The major types of desert landscapes: A. sand desert, B. stone desert, C. rock desert, D. plateau deserts, E. mountain deserts ... 35
Figure 1.12. Map of North American deserts (Laity 2009) ... 37
Figure 4.1. Quality score distribution of raw sequences ... 135
Figure 4.2. Comparison of quality score distribution of sequences trimmed using the three different methods. ... 136
Figure 4.3. Number of chimeras detected by the Uchime and Decipher. ... 139
Figure 4.4. Number of sequences detected by the two programs in the Kumtagh sample ... 140
8
List of Tables
Table 1.1. Comparison of different methods to calculate distances between
microbial communities ... 28
Table 1.2. Summary of studies of hot deserts (Makhalanyane et al 2015) ... 33
Table 4.1. The Phred quality score related to the base calling error probalities.134
Table 4.2. Comparison of different methods for quality control of sequences
(original number of sequences is 22320). ... 136
Table 4.3. Diversity result before and after trimming. ... 137
Table 4.4. Percentage of potential non-chimeric sequences classified at
different taxonomic levels. ... 140
Table 4.5. Summary of sequences in each database assigned to different
taxonomic level ... 143
Table 4.6. Classification result of a sample from desert in Utah ... 143
Table 4.7. Summary of classification using different classifieres with 1000
sequences randomly selected from gold_database downloaded from
Usearch. ... 144
9
List of abbreviations
ATP: adenosine tri-phosphate
BLAST: Basic Local Alignment Search Tool
FISH: catalyzed reporter deposition fluorescent in situ hybridization
CFU: colony-forming units
DAPI: 4,6-diamidino-2-phenylindole
DGGE: Denaturing Gradient Gel Electrophoresis
DNA: Deoxyribonucleic acid
FISH: fluorescence in-situ hybridization
NGS: next-generation sequencing
OTU: operational taxonomic unit
PAR: photosynthetically active radiation
PCoA: Principal coordinates analysis
PCR: Polymerase Chain Reaction
qPCR: Real time quantitative PCR
RDP: Ribosomal Database Project
rRNA: Ribosomal Ribonucleic Acid
RNA: ribonucleic acid
SRA: Sequence Read Archive
T-RFLP: terminal restriction fragment length polymorphism
UNEP: United Nations Environment Programme
UPGMA: Unweighted Pair Group Method with Arithmetic Mean
10
11
1.1. Identification of bacterial diversity and Next Generation
Sequencing technology
1.1.1. Introduction on the development of techniques for the
identification of bacteria
Since microorganisms were first recognized after the invention of microscopes in the
17th century, scientists have been looking for ways to isolate microorganisms in pure
culture and to characterize isolates to differentiate them from each other [1]. Methods
that can be used to characterize microbial isolates, as well as for classification of
microorganisms, are essential for research in microbiology.
Traditional methods of bacterial identification based on phenotypic differences of
organisms relied on cultivation under laboratory conditions, using gram staining,
colony morphology differences and biochemical tests. However, these methods of
bacterial identification had two major drawbacks. First, they can only be used for
organisms that are able to be cultivated in vitro, which is extremely biased, as it
selects only the small minority of bacteria that can grow in a laboratory situation [2].
As well, it frequently takes a long time to delineate characteristics of a clone culture,
especially for those that grow slowly. Second, some strains exhibit unique phenotypic
characteristics that do not fit into patterns that have been classified as marks of any
known microbial categories [3]. These limits to databases will often not be suitable
for identification and classification of environmental isolates.
The development of molecular biology offered a set of powerful new tools to
accelerate the identification of microorganisms, which allows the examination of
12
within individual strains [4,5]. Accurate and definitive microorganism identification
has been used in a wide variety of research and applications [6], including disease
diagnosis associated with microbial infections, food production, agriculture and
environmental studies [7].
Carl Woese, in 1977, first found that the 16S rRNA gene, one of the genes that makes
ribosomal RNA, has evolutionary relationships in all prokaryotic organisms, and the
distances of the sequences of 16S rRNA between different organisms likely indicates
evolutionary distances [8]. With the development of the Polymerase Chain Reaction
(PCR) techniques in the last decade of the 20th century and improvements in nucleic
acid sequencing techniques, ribosomal RNA (or DNA) sequencing gradually became
the basis for classification of microorganisms and the new gold standard for the
taxonomy of microorganisms [9,10].
Now, methods of bacterial identification can be broadly sorted into two
categories-genotypic techniques based on profiling an organism's genetic material,
and phenotypic techniques based on profiling either metabolism or chemical
composition of microorganisms [11]. The two methods focus on different
characteristics of microorganisms and are frequently combined as complementary
approaches in applications of microbiology research.
Phenotypic methods. Phenotypic techniques can generate direct functional
information, such as activities of certain enzymes, and metabolic activities in specific
groups of organisms [12]. They can also offer valuable information on physical and
functional activities at the protein level. Phenotypic methods include traditional
morphological characteristics, biochemical testing (presence of various enzymes),
serological tests (test on specific antibodies, such as ELISA, and Western blotting),
13
Genotypic methods. Genotypic techniques in general have the advantage over
phenotypic methods of being independent of the physiological state of an organism
(such as conditions or stresses in growth) [2]. They are based on the profile of a
universal component (DNA or RNA), and certain of these fragments or sequences are
unique to an individual organism or a group of closely related organism [14]. By
comparing the information of different sequences generated by these fragments,
organisms can be identified or classified [15]. Genotypic techniques can be classified
into two major categories: fingerprint-based and sequence-based, and PCR is
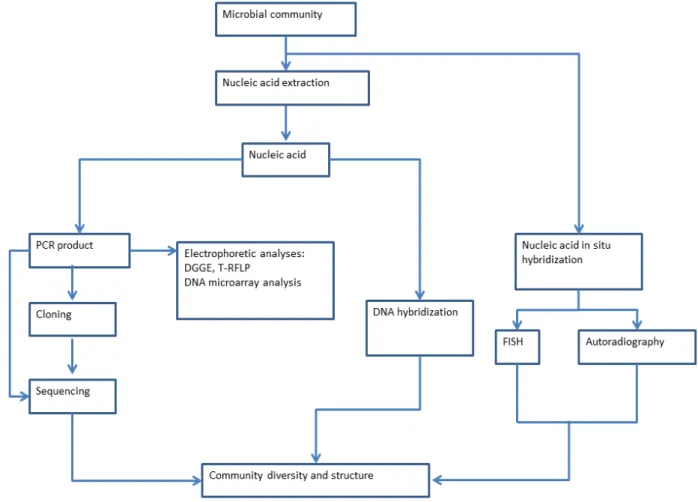
generally essential to both methods. The most commonly used nucleic acid-based
methods in identifying bacteria are shown in Fig 1.
14
1 1.1.2. Introduction to 16S ribosomal RNA
The 16S small ribosomal RNA gene (16S rRNA) is a component of the 30S small
subunit of prokaryotic ribosomes. The genes for ribosomal RNA have evolved as
organisms evolved, and the slight changes that have occurred can provide clues as to
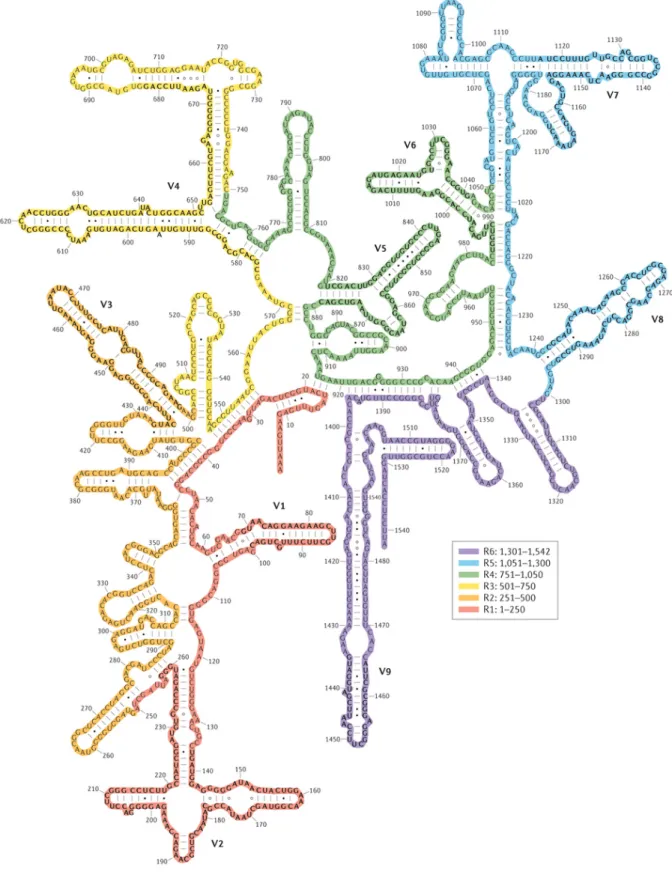
how closely or distantly various organisms are related. The 16S rRNA genes comprise
nine hypervariable regions (V1-V9) that demonstrate considerable sequence diversity
among different bacteria, and nine conserved regions (C1-C9) that remain consistent
across different bacterial groups [16]. The distribution of these regions in 16S rRNA
are shown in Figure 2.
PCR amplification and analysis of the 16S rRNA genes have been widely used as a
culture-independent method for documentation of the evolutionary history and
taxonomic assignment of individual organisms, as well as in characterization of
microbial communities [17]. The 16S rRNA gene has a number of clear advantages
that make it optimal as a marker for these types of studies [18]:
i. The length of this gene is convenient for amplification and sequencing, and
certain length of its fragments (one or more variable regions) are sufficient for
classification of sequences to deep level.
ii. The highly conserved regions can be used for design of universal PCR primers; Figure 1.2. Distribution of variable regions in 16S rRNA from E. coli (Chuan et al 2014).
15
iii. The variable regions of this gene allow for accurate taxonomic classification and
phylogenetic identification of microbial communities [19];
iv. Lateral transfer of this gene between taxa are rare [19];
v. Since this gene has been widely sequenced in microbial diversity research, there
are many reference databases including a large amount of sequences with
taxonomic information, which is convenient to assign query sequences to known
taxonomic groups and compare community composition across studies [20].
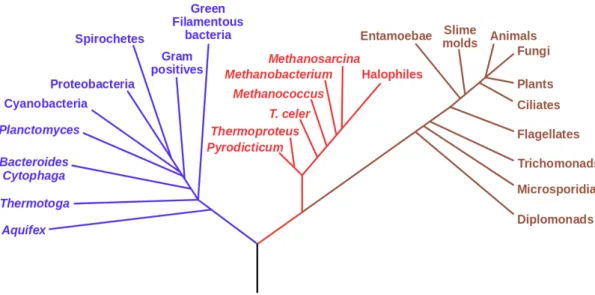
In 1977, Carl Woese and George E. Fox introduced phylogenetic taxonomy of 16S
ribosomal RNA and the three-domain system “tree of life” (Figure 3), through
analysis of the 16S rRNA sequences [21]. They first discovered the third domain
Archaea, and separated it from Bacteria. Over the past two decades, 16S rRNA gene
sequencing analysis has made great studies, and has become the “gold standard” for
the taxonomy of microorganisms.
Figure 1.3. Three-domain system based on taxonomy of 16S rRNA, Carl Woese and
16
Despite the advantages of the 16s rRNA gene in the classification of bacteria, it is not
perfect for some applications. For example, when sequence variation of the 16S rRNA
between two microorganisms is very small, distance measurements of this gene may
not be able to provide accurate information, such as the presence of similar species in
the same genus [22]. The secondary structure of 16S rRNA (Fig. 4) may include
valuable information [18], and has not yet been well explored in taxonomy studies.
Also, in research about bacterial diversity and community structure using sequence
profiles of the 16S rRNA genes, the copy numbers of this gene are regularly assumed
to be consistent among different bacterial groups. These differences can affect the
estimation of the abundance of different bacteria [23]. In addition, the classification of
microorganisms based on 16S rRNA gene sequences relies on a well constructed
database. However, current databases, including RDP, Silva, Greengenes and
Genbank databases for 16S rRNA sequences, still have limits on the coverage of
different taxonomic groups, especially at a deep level [24,25]. Thus multiple
approaches, such as the whole-genome molecular techniques and the use of more
target genes, combined with the 16S rRNA gene, could offer more accurate
17
18
1.1.3. Metagenomics and the Next Generation Sequencing techniques
Metagenomics is the study of the genetic material recovered directly from
environmental samples [26]. With the development of next generation sequencing
(NGS, also termed high-throughput sequencing; HTS) after 2004, metagenomics is
helping to access the taxonomic and functional composition of microbial
communities in any environmental biome, without the need to isolate or culture them
in the laboratory [27]. While traditional microbiology relies on cultivated clonal
cultures, the vast majority of microbial biodiversity had been missed [1]. Massively
parallel sequencing techniques have revolutionized sequencing capabilities, far
beyond the electrophoresis-based “first generation” sequencing, and launched the
“next-generation” in genomic science. Metagenomics has already been successfully
applied in many fields, including the analysis of the microbiome of natural water and
soil environments, some extreme physical and chemical environments, food supply
chains, animals, and human health. In recent years, to explore the taxonomic
complexity, meta-barcode methods are broadly used, which is an amplicon-based
approach, based on PCR-targeted sequencing of selected genetic species markers
(such as some hypervariable regions of the 16S rRNA gene) [28].
Shotgun sequencing methods are also widely used in metagenomic samples, since
shotgun metagenomics can provide information about both which organisms are
present and what metabolic processes are possible in the community [29]. DNA
sequences are randomly broken up into many small pieces and then reassembled by
matching regions of overlap. Many organisms, which may be overlooked using
traditional culturing techniques, may be retained as small sequence segments using
shotgun sequencing. So to achieve the high coverage of different community
members, especially under-represented ones, full sequencing of the genomes of large
19
Organisms and gene functions of the microbial communities in a specific
environment can be obtained by shotgun sequencing of the whole metagenome.
However, if we only need to analyses the taxonomic composition and biodiversity
assessment of microbial community, an environmental DNA (e-DNA),
meta-barcoding approaches can constitute an effective and less expensive solution
[28]. It uses universal PCR primers, which are assumed to cover all the species
belonging to the explored taxonomic range, and culture-independent sequencing of a
selected genetic taxonomic marker (meta-barcode) from a mass collections of
organisms or from e-DNA. The PCR products are then sequenced on a next
generation sequencer, such as the Roche 454 and Illumina sequencers.
The 16S rRNA gene is commonly used to identify bacteria by meta-barcodes. In the
case of recent versions of 454 technology, 16S rRNA gene sequences provides
information of bacterial community biodiversity and relative taxa abundance down to
the genus level [30].
The first metagenomic studies conducted high-throughput sequencing used massively
parallel 454 pyrosequencing [31]. Three other technologies commonly applied to
environmental sampling are the Ion Torrent Personal Genome Machine, the Illumina
MiSeq or HiSeq and the Applied Biosystems SOLiD systems [32]. These techniques
for sequencing DNA generate shorter fragments than traditional Sanger sequencing.
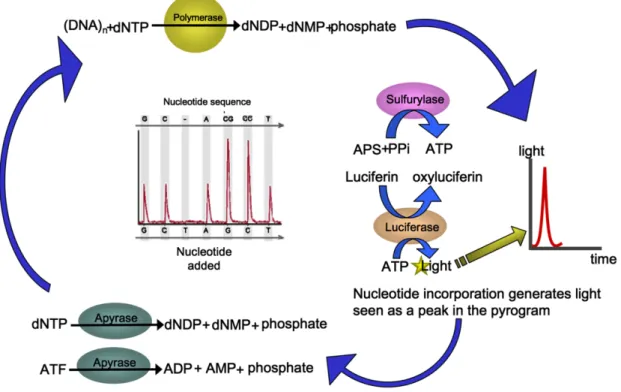
The Roche 454 Genome Sequencer
In 2008, 454 Sequencing launched the GS Titanium series reagents for use on the
Genome Sequencer FLX instrument. This uses a large-scale parallel pyrosequencing
system with the ability to sequence 400-600 million nt per run with 400-500 nt read
lengths [33]. The system relies on fixing nebulized and adapter-ligated DNA
20
fixed to these beads is then amplified by PCR. The technique is built on 4-enzyme
real-time monitoring of DNA synthesis by bioluminescence, using a cascade that,
upon nucleotide incorporation, ends in a detectable light signal (bioluminescence).
The pyrosequencing chemistry is shown in Figure 5.
Genomic DNA fragments (such as 16S rRNA gene amplicons), are ligated to short
adaptors, which provide priming sequences for both PCR amplification and
sequencing of the sample-library fragments. Single-stranded template DNA (sstDNA)
library is immobilized onto beads. The beads containing a library fragment carry a
single sstDNA molecule. The bead-bound library is emulsified with the amplification
reagents in a water-in-oil mixture. Each bead is captured within its own micro-reactor
where PCR amplification occurs. Sequencing-by-synthesis then occurs by the DNA
polymerase-driven generation of inorganic pyrophosphate, resulting in the formation
of adenosine triphosphate (ATP) and ATP-dependent conversion of luciferin to
oxyluciferin (Fig. 6). The generation of oxyluciferin results in the emission of
photons of light, and the amplitude of each signal is directly related to the presence of Figure 1.5. The 454 pyrosequencing chemistry (Petrosino et al 2009)
21
one or more nucleosides [35].
The Illumina Genome Analyzer
Illumina sequencing also use sequencing-by-synthesis methods. It begins with the
attachment of single stand template DNA (sstDNA) to primers on a slide, and the slide
is flooded with nucleotides and DNA polymerase. Four different nucleotides (ATCG)
are added, and these nucleotides are fluorescently labelled, with the colour
corresponding to the base. They also have a terminator, so that only one base is added
at a time. The four bases then compete for binding sites on the sstDNA to be
sequenced and non-incorporated molecules are washed away [36]. After each Figure 1.6. Process of Pyrosequencing (Margulies et al 2005).
22
synthesis, a laser is used to excite the dyes and a photograph of the incorporated base
is taken (Figure 7). Illumina sequencing only uses DNA polymerase, instead of
multiple enzymes required by pyrosequencing. The current MiSeq platform can yield
~50 million 300 nt reads per run [37].
Figure 1.7. Process of Illumina Sequencing
Ion Torrent Personal Genome Machine
Unlike Illumina and 454, Ion torrent sequencing does not use optical signals. Instead,
it exploits the fact that addition of a dNTP to a DNA polymer releases an H+ ion[38].
DNA fragments of approximately 200 bp in length with adaptors are placed onto a
bead. Then, DNA strands are amplified on the bead by emulsion PCR, with each bead
in a single well of a slide. Like 454, the slide is flooded with a single type of dNTP,
along with buffers and polymerase. The pH is detected in each of the wells, as each
H+ ion released will decrease the pH. So the sequences of the read are determined by
detecting the changes in pH .
23
long repeats (homopolymers). The read length in achieved by Ion Torrent
semiconductor sequencing is currently 400 nt, and the throughput is currently lower
than that of other high-throughput sequencing technologies [39].
Among the three most widely used sequencing techniques, 454 pyrosequencing is
24
1.1.4. Bioinformatics for Meta-barcode Sequencing
The massively-parallel sequencing methods are capable of producing millions of
reads, which presents a huge challenge for data storage, analyses and other
manipulations [41]. Once sequencing is complete, raw sequence data must go through
several analysis steps (Figure 8). A generalized data analysis pipeline for
meta-barcode sequencing data includes: 1) preprocessing the data to remove adapter
sequences and grouping to different libraries according to the specific barcodes, 2)
checking the quality score of each base to remove low-quality reads, 3) mapping of
the data to a reference database or stand-along alignment of the sequence reads not
relying on a reference database, and remove chimera sequences, 4) assign the
sequences to their taxonomic classes, 5) cluster sequences to operational taxonomic
unit (OTU) at a specific similarity level (normally 97%), and 6) statistical analysis of
microbial community diversity within an environmental library (α-diversity) or between different libraries (β-diversity), based on OTU distribution or phylogenetic distances. Many free online tools and software packages exist to perform the
bioinformatics necessary to analyze sequence data.
25
Cleaning of Raw Data
Raw data obtained from a sequencer needs to be grouped by barcodes (for multiple
samples), and primers and adapters are removed from each read [42]. Then, the data
are reformatted to fasta or fastQ format for further analysis. Several criteria are
applied to remove sequence noise [43]: (i) noise length that extends the range of
selected marker gene, (ii) more than one mismatch to the primer or barcode sequences,
and (iii) the presence of homopolymers of > 8 bp in length. Then, the sequences are
checked for quality score by trimming off the ends that normally contain low-quality
bases, or filter off low-quality sequences (such as those that contain too many
ambiguous bases, average quality scores are low, etc.). Regular pipelines available for
these analysis procedures are Mothur [44], Qiime [45], and Galaxy [46].
Chimera sequences can be produced during the PCR process, originating from two or
more parental sequences, that can be a large part of NGS sequencing errors. Several
programs are used to detect chimeras from the data, using reference databases or
de-novo methods, such as UChime [47], Decipher [48], and Chimera Slayer [49].
Since it is difficult to identify chimeras from data generated by massive sequence
amplification, sometimes different methods can be combined.
Sequence Classification
Currently, the bioinformatics methods used to assign metagenomics sequences to
their taxonomic classes adopt essentially three approaches, similarity-based methods,
composition-based methods, and phylogenetic-based methods [28,50].
For the similarity-based methods, even short sequences (about 200 bp) can be
classified, and the classification of sequences commonly relies on its comparison to
curated collections of sequences in a reference database. So the absence of reference
26
assignment accuracy. Currently, the most widely used reference resources available
for 16S rRNA gene-based identification of microorganisms are the Greengenes [51],
Ribosomal Database Project Ⅱ(RDP Ⅱ) [52], and SILVA databases [53].
The composition-based methods use a feature space consisting of 6-8 base
subsequences (words) to assign the metagenomic sequences to taxonomically
annotated reference sequences [54]. The reference data are pre-treated using different
methods, such as the naïve Bayesian classifier and the k-nearest-neighbor algorithms.
This approach requires more computational abilities than the similarity-based
methods.
The phylogenetic-based methods calculates the phylogenetic distances according to a
reference evolutional phylogenetic tree, and assigns the sequences using maximum
likelihood, neighbor-joining algorithms, etc. This method requires huge
computational demands, that are not available to all researchers. To achieve both
accuracy and efficiency in the classification of meta-barcode sequences, some
programs combine different algorithms [55].
Statistical Analysis
To study the biodiversity of microbial communities, Operational Taxonomical Units
(OTU) are commonly used, since it is difficult to calculate on their real species
numbers in different communities [56,57]. For meta-barcode sequencing data, not all
sequences can be classified at deep taxonomic levels, which makes it more efficient to
use OTU methods to reveal the structure of microbial communities [58]. OTUs are
clustered based on sequence similarity, and the most accepted similarity is 97%,
representing the potential distances among different species, although 95% or 99%
are also used [59].
27
two algorithms are broadly used, picking OTUs based on alignment to reference
database (ie. Mothur and RDP Ⅱ pipelines), and picking OTUs based on the
calculation of sequence distances among each other, such as the Uparse) [60,61].
After OTU tables are generated, further statistical analyses can be performed.
Two biodiversity indices are broadly used to estimate the richness and evenness of a
microbial community, Chao 1 and Shannon, based on the distribution of OTU
populations in a community [62,63].
Chao 1 Estimator calculates the estimated true species diversity of a sample by the
equation (The calculations for the bias-corrected Chao1 richness estimator in the
program EstimateS).
The Shannon diversity index (H) is another index that is commonly used to
characterize species diversity in a community. Shannon's index accounts for both
abundance and evenness of the species present.
Other statistical methods, such as rarefaction curves and the Simpson Index, are also
28
Comparisons Between Communities
To investigate the differences between two microbial communities or among multiple
libraries based on their composition, distance matrices are calculated using different
algorithms, such as Bray-Curtis [64], Jaccard [65], Sorenson [66], weighted and
un-weighted Unifrac [67]. OTU-based or phylogenetic-based distance matrices
between every pair of community samples are presented in a square matrix. A
comparison of different methods is shown in Table 1. Then, the matrix can be plotted
using Principal Coordinate Analysis (PCoA) [68], UPMGA-tree (Unweighted Pair
Group Method with Arithmetic Mean) or other bioinformatic methods [69]. Pearson
correlation coefficients, to explore the relationship between microbial community
structure and environmental factors, or between different taxa is also used [70].
Table 1.1. Comparison of different methods to calculate distances between microbial
communities
Dissimilarity Measures Species numbers Phylogenetic
Incidence (presence or absence)
Sorensen Un-weighted UniFrac
29
List of Data Analysis Platforms and Pipelines for Meta-barcode Sequencing
1. Ribosomal Database Project (RDP Ⅱ)
http://rdp.cme.msu.edu/ 2. Mothur http://www.mothur.org/wiki/Main_Page 3. Qiime http://qiime.org/ 4. Usearch http://www.drive5.com/usearch/
5. SILVA rRNA database project
http://www.arb-silva.de/ 6. Galaxy https://galaxyproject.org/ 7. MGRAST http://metagenomics.anl.gov/ 8. Prinseq http://prinseq.sourceforge.net/ 9. Greengenes http://greengenes.lbl.gov/cgi-bin/nph-index.cgi 10. ESPRIT http://www.ijbcb.org/ESPRITPIPE/php/onlinetool.php 11. CAMERA http://metagenomics.anl.gov/ 12. R http://www.r-project.org/
30
1.2. Arid Environments
1.2.1. Introduction to Arid Environments
Hot deserts are regions of land that have little rainfall, where few plants and animals
generally exist. Aridity is the dominant climatic factor over about one-third of the
land surface of the world, as approximately 7.5% of global land area is classified as
extremely arid (hyperarid), 12.5% arid, and about 17.7% semiarid. If dry-subhumid
areas (9.9%) are included in the classification, then drylands comprise about 47% of
the Earth’s land surface (United Nations Environment Programme, UNEP 1992). In
total, about 49 million km2 are affected by aridity. Of the total surface area of arid
climate, Africa is 36.7%, Asia 31.7%, North America 12%, Australia 10.8%, and
South America 8.8% [71,72]. To sum up, the dry areas of the world occupy more land
than any other major climatic type [73].
Deserts are considered to be the hyperarid and arid regions, and semiarid and
dry-subhumid regions the desert fringes. It is difficult to derive an exact definition of a
desert, as aspects of climate (precipitation, evaporation, and temperature),
geomorphic features, and flora and fauna, show considerable variation. Although they
may share common features such as wide temperature variation, winds,
geomorphology, shifting sands, and plant and animal life, they are not components of
all arid environments. There are many aridity indexes to measure the level of aridity
for a region, an assessment of the extent of drylands broadly applied is aridity index
(AI) conducted by Hulme and Marsh (1990) on behalf of UNEP (1992), where
AI = P / PET,
P stands for the mean precipitation of a fixed time period, PET is potential
31
An examination of the distribution of deserts based on the AI is shown in Fig 9. The
delimitation of the different types of dryland environments by AI values are
dry-subhumid (AI = 0.50 - < 0.65), semi-arid (AI = 0.20 - < 0.50), arid (AI = 0.05 - <
0.20), and hyper-arid (AI = < 0.05).
The classification of deserts relies on combinations of the total amount of annual
rainfall, temperature, humidity, or other factors. In general, deserts are classified into
3 categories (Fig 10): Hot and dry deserts (such as South and Central America, Africa
and Australia), Cold deserts (such as Antarctic, Greenland), Coastal deserts (mostly
found on the western edges of a continent, and a famous one is the Atacama Desert in
Chile). Table 2 shows a summary of studies of hot deserts [74].
Figure 1.9. Map of Global Distribution of Dry Land. Regions with declined color
follows the aridity index (AI) of the UNEP. Arrows show the major intercontinental
32
Figure 1.10. Classification of deserts. The pictures are from three different types of
33
Table 1.2. Summary of studies of hot deserts (Makhalanyane et al 2015)
Classification Country Name Approx.
size (km2) Approx. temperature range (℃) Approx. precipitation (mm/yr) Average soil pH Average soil organic carbon (%) References
Hyperarid Chile Atacama
-Sechura 105 000 -5~40 0~20 6.6~9.2 0.1~2.6 [75-77]
Hyperarid-arid
Southwestern
Africa Namib 81 000 5~45 5~100 7.9~8.5 0.1~0.3 [78,79] Northern Afirca Sahara 9 100 000 -5~45 5~150 7.6~7.9 0.1~1.2 [80-82]
Arid Southern
Mongolia Gobi 53 000 -20~30 30-100 7.7~10.2 0.1-2.64 [83]
Arid-semiarid
Arabian
Peninsula Arabian 2 300 000 5~40 25~230 7~7.5 NA [84] South Africa Karoo 395 000 2~40 50~200 6.9~9 0.3~1.3 [85] Southwestern
USA Mojave 152 000 -10~50 30~300 7.1~9.4 0.04~0.1 [86] Central Australia Simpson 180 000 5~40 50~400 6.5~7 0.1~0.3 [87,88]
North Mexico /Southwestern USA Chihuahuan 455 000 10~40 70~400 5.9~6.2 0.2~1.9 [89] Southwestern USA Sonoran 312 000 -10~50 70~400 5~8.6 0.4~2 [90] Southwestern Africa Kalahari 520 000 -10~45 100~250 7.7~8.7 0.1~0.5 [91-93] Israel Negev 13 000 5~40 100~300 7.2~8 0.5~0.7 [94] India/Pakistan Thar 200 000 4~50 200~300 7.9~8.1 0.3~0.4 [95] Semiarid Southern Australia Gibson 156 000 6~40 200~400 NA 0.06 [96] Northwestern
Australia Great Sandy 285 000 10~40 250~370 5.8~6 0.1~1.1 [96] Northern
34
1.2.2. Characteristics of Drylands and Desert Soils
Climate. The world’s deserts can be divided into three categories (Meigs 1953): hot
deserts in tropical and subtropical latitudes, temperate deserts in higher latitudes in
continental interiors, and coastal deserts found on the west coasts of continents in
tropical latitudes. Hot inland deserts are identified by large temperature variations,
and the persistence of high daily temperatures, with maximum temperatures
commonly between 45 and 49°C [73]. Temperatures on the soil surface can be
considerably higher, as much as 75-80℃ [98]. Temperate deserts are characterized by
considerable seasonal variations in temperature, and a dependable period of cold
temperatures. These deserts are at higher latitudes than hot deserts, some precipitation
occurs as snow, and soil moisture is often frozen. They have hot summers
counterbalanced by relatively cold winters. In the arid regions of Antarctica, mean
winter temperatures may be as low as -30℃ [99]. Coastal deserts tend to have
relatively low seasonal and diurnal ranges of temperature.
Precipitation. Deserts generally receive relatively low amounts of total annual
precipitation. Spatial variation in rainfall is high, which leads to the high biodiversity
in some desert areas [100]. Rainfall in deserts tends to fall in pulses [101], which can
vary considerably in magnitude and timing. For some deserts at coastal areas, where
rainfall is very low, fog becomes the major resource of precipitation [102]. The high
level of fog in coastal desert fog zones provide habitats extremely favorable for lichen
growth [103]. Mountain snow plays an important role in water storage and release in
deserts that are in proximity to high-altitude mountain ranges. High runoff from desert
slopes may offer sufficient water availability to agriculture and helps dampen the
variability of the hydrograph [104].
Landscapes. There are five major types of desert landscapes that are commonly
35
deserts (Fig 11). The sand desert landscape probably accounts for 15-20% of desert
land [104], and is thus not as common as often perceived. Stone deserts usually have a
gravel surface, which is covered by rocks too large to be carried away by wind or
water, and also known as desert pavement. Rock desert landscapes normally have
bare rock surfaces. Plateau landscapes are often found in a desert landform of
mountain-and-basin deserts. Mountain deserts constitute a landscape form called
shield desert, where wind is a more effective force than water, compared with
mountain-and basin desert.
Saline Soils. Soils from desert environments are dominated by a mineral component
with low organic matter, but the repeated accumulation of water in certain soils can
cause salts to precipitate [105]. When the water table rises to within about 2 m of the
ground level, water may begin to rise to the surface by capillary action. Then,
dissolved salts will be carried up to the surface, and concentrate in the upper layers of
the soil as water is evaporated [106]. Salinity changes the electrochemical balance of
soil particles, which is harmful to plant cells, and can also increases soil erosion.
Radiation. The desert atmosphere is relatively clear. Clouds are rare, and the water
Figure 1.11. The major types of desert landscapes: A. sand desert, B. stone desert, C. rock
36
vapor content is low. The paucity of clouds has several important consequences.
Incoming solar energy approaches a maximum in arid regions owing to the lack of
cloud cover. Approximately 80% of solar radiation at the top of the atmosphere
reaches the surface [73]. The distribution of radiation is characterized as seasonal,
normally reaching a peak in June in the Northern Hemisphere and December in the
Southern Hemisphere [107].
Desert Dust. Mineral dust is the most important export from the world’s arid zones to
the global Earth system, and affects atmospheric, oceanic, biological, terrestrial and
human processes and systems [108]. It is responsible for suppression of rainfall [109],
long-distance microorganisms transport, risks to human health, and agricultural soil
erosion and productivity. Dust emission from arid environments in China represents
as much as half of the global atmospheric loading of dust, while North America has
only one very small zone located in the Great Basin with high values of dust loadings
into the atmosphere [110]. The increasing greenhouse gas emissions have brought
large changes to climate, and many parameters that control dust emission, such as
vegetation, rainfall, soil moisture and surface wind speed are expected to change
37
1.2.3. Drylands in North America
There are a diverse number of small deserts stretching from southeastern California to
western Texas, and from Nevada and Utah to the Mexican states of Sonora,
Chihuahua, and Coahuila and much of the peninsula of Baja California(Figure 12).
Beyond these areas, semi-arid conditions extend north to eastern Washington, south to
the central Mexican plateau, and east to link with the steppes of the High Plains.
About 55% of the North American deserts are considered semiarid, 40% arid, and
only 5% hyperarid [73].
38
Many factors can work to create deserts. The rain shadow effect contributes to the
form of North American deserts, which is caused by mountain ranges blocking
moisture of Pacific origin in the winter and the Gulf of Mexico in summer. Rain
shadow effects are major in the Great Basin and Mojave Deserts, while the effects of
high pressure are important in the Chihuahuan and Sonoran Deserts. Increasing
precipitation of some regions between July and mid-September over large areas of the
southwestern USA and northwestern Mexico is called the North American monsoon
[112], which is defined as sites that receive at least 50% of their annual precipitation
during the summer period. North American monsoon systems develop in response to
atmospheric moisture supplied by nearby warm oceans. The boundary between cold
and warm deserts lies across southern Nevada and Utah [73].
The Great Basin, characterized by its high altitude at its northern position, is
considered a “cold” desert. Approximately 60% of its precipitation in winter comes in
the form of snow, and mean monthly temperatures is below 0°C from December to
February. The mean annual temperature is 9°C [113]. Most regions have an
elevation > 1200 m, with mountains up to 3000m in height. Mean precipitation varies
from 2 to 300 mm among different sites and is evenly distributed throughout the
year. Much of Nevada and Utah are in the Great Basin Desert [114].
The Colorado Plateau is a roughly circular area > 300,000 km2 passing at higher elevation, that consists of plateaus and isolated mountains of Utah, Colorado, New
Mexico, and Arizona [115]. Although the plateau lies mostly above 1500 m, it shows
high internal variation [116]. Differential erosion characterizes a landscape dominated
by canyons, cuesta scarps, and plains. Dune fields on the Colorado Plateau are not
extensive, but have a variety of forms. Wind erosion features of the Colorado Plateau
comprise deflation hollows, yardangs, wind-fluted cliffs, and blowouts [73].
39
approximately 140,000 km2 in southeastern California and southern Nevada, with
elevations mostly above 1000 m [117]. The late Quaternary climate had a large impact
on the surficial stratigraphy of the area [118]. It is roughly rectangular in shape,
bounded by the Great Basin Desert to the north, and the Sonoran Desert to the south. It
has an annual rainfall from ranging 76 to 102 mm across the desert floor, and reaching
about 279 mm with increasing elevation. The Mojave Desert is characterized by
numerous mountain ranges, valleys, endorheic basins, salt pans, and seasonal saline
lakes. Most of the valleys are internally drained, such that all precipitation that falls
within the valley does not eventually flow to the ocean [119].
The Sonoran Desert covers approximately 275,000 km2 in large parts of the Southwestern United States in Arizona and California, and of Northwestern Mexico
in Sonora, with elevations ranging from below sea level in California to about 1500 m
in mountain foothills [120]. The Sonoran Desert is more subtropical than other North
American deserts, with summer high temperatures reaching 49°C or more [121].
The Chihuahuan Desert occupies approximately 518,000 km2 in southwestern North America, with major parts in northern Mexico, and one forth ranging in western
Texas and southern New Mexico. Most sites are located at elevations from 600 to
1,500 m. This desert has more rainfall than other warm desert ecoregions, with
precipitation ranging from 150 to 400 mm [122]. The Chihuahuan Desert
40
1.2.4. Analogue Sites for Mars
Some arid landscapes contain a range of Mars analogue features, relevant for geology
and astrobiology studies. These features include wind erosion, moisture deficits,
absence of vegetation, high UV radiation, etc., although surface temperature,
atmospheric pressures, gravity and physiochemical composition are very different
from that of Mars. The EuroGeoMars 2009 campaign was organized at the Mars
Desert Research Station (MDRS) to perform multidisciplinary astrobiology research.
MDRS in southeast Utah is situated in a cold arid region with mineralogy and erosion
processes comparable to those on Mars [124].
Particular deserts reveal extreme Mars-like surface characteristics, such as the cold
Antarctic desert McMurdo Dry Valley which is considered to have the coldest, driest
and most oligotrophic soils [125]. Mars is the third largest planet in the solar system.
It is often referred to as the "Red Planet" because of the iron oxide prevalent on its
surface, which is similar to deserts in Utah, characterized by red-colored hills, soils
and sandstones. MDRS is located in a cold arid desert with an temperature of 35°C at
midday on the equator and -43 °C during the polar winters [124]. It consists of
minerals containing silicon and oxygen, metals, and other elements that typically
make up rock. Our ability to study the surface of other planets in the solar system is
very limited, and studies on the terrestrial analogues located on Earth will help to
41
1.2.5. Desertification
Desertification - the spread or intensification of land degradation towards greater
aridity due to climatic changes or human activities - is occurring at an alarming rate
around the world [126]. Dryland degradation results in huge economic losses and
directly affects more than 1 billion people who depend on such areas for their
livelihood, particularly small farmers (United Nations Environment Programme,
UNEP 2012). UNEP estimates that 69% of agricultural drylands in the world are
degraded or undergoing desertification.
Arid zones are the most vulnerable areas, and characterized by extreme drought. But
drought alone cannot be responsible for desertification. Emanuel et al. (1985)
predicted a dramatic increase in global desert lands due to climate changes with a
doubling of the atmospheric CO2 concentrations [127]. Soil salinization, agricultural
development in marginal desert lands and housing developments can negatively affect
arid environments. Soil salinization reduces soil quality, limits the growth of crops,
constrains agricultural productivity, and in severe cases, leads to the abandonment of
agricultural soils [128]. High soil salinity occurs naturally in deserts, but poor water
management in irrigated areas raises the natural salinity of the soil to the soil surface
[129].
Aquifer pumping in desert golf courses reduces the groundwater and increases soil
salinity, as well as mineralization and chemical pollution of watercourses [130]. For
example, the use of the water from the Colorado River for urban purposes in southern
California has resulted in the river no longer reaching the sea. In North America, the
replacement of grasslands by woody species with shrubs are particularly negative
effects of desertification, making landscapes vulnerable to wind and water erosion
[131], and soil erosion results in the loss of biodiversity. Drier conditions linked to
42
the central and western US [132], results in the depletion of aquifers [133,134]. Thus,
human use can create desert-like conditions in lands that were previously far more
productive.
Desertification also contributes to other environmental and social crises, such as the
mass migration of people and animals, species loss, climate change and the need for
emergency assistance to human populations. It affects both developed and
underdeveloped nations, up to 66% of the African continent is threatened by aridity,
and almost 40% of land in the continental United States is vulnerable to
desertification, estimated by the US Bureau of Land Management [135].
As humans make increasing use of dryland resources, hazards associated with aeolian
and fluvial processes will be more intense[136]. It is clear that agricultural activities
43
1.3. Desert Biodiversity
1.3.1. Plants and Animals
Although it has been often suggested that deserts are relatively simple ecosystems
characterized by low biodiversity, some research suggests that deserts are relatively
complex and biologically rich [106]. Deserts supports various fauna and flora,
including terrestrial plants and animals.
Plants have developed various morphological and physiological adaptations to live in
the desert environment, classified as drought-escaping, drought-evading, or
drought-resisting. There are some principal adaptations: 1) geophytes and other plants
have special storage organs, 2) trees and shrubs with deep root systems are able to
exploit deep aquifers in dry environments, 3) germinating immediately after the
infrequent rains and completing their life cycles before summer heat [106], 4) plants
have rapid gas exchange and small leaf surfaces to minimize heat input.
Local geographic factors, such as the mineral composition, nutrient reserve, organic
content, and capacity to hold water, can affect the distribution and abundance of plants
[73]. Plants can be classified as xerophytes, mesophytes, or phreatophytes according
to their water requirements. Xerophytes plants, that can survive and reproduce when
water is limited, dominate desert environments. Grasses are the most abundant
species of plants in deserts [137]. There are several common desert plants found in
desert environments, with different characteristics across the world owing to their
different climatic conditions, including barrel cactus, brittle bush, palm trees, jumping
cholla, saguaro cactus, etc. Vegetation in deserts can have large effects in different
geological processes, including reducing sand transport and changing hydrology and
44
Animals have evolved various strategies in order to cope with the extreme conditions
in deserts, which can be classified into three categories: behavioral, morphological,
and physiological. Morphological adaptations to heat include smaller body sizes and
relatively larger surface areas, and light-colored surfaces to reflect radiation.
Physiological adaptations are less common. They include dormancy during summer,
uric acid as a major nitrogenous waste, the deposition of fat in tails or humps, salt
glands that secrete salt without the loss of fluids, and an absence of sweat glands
[106].
The Chihuahuan desert is one of the most biologically rich and diverse desert
ecoregions in the world, others include the Great Sandy Tanmi Desert of Australia and
the Namib-Karoo desert of southern Africa[114]. The high degree of local endemism
is the result of the isolating effects of complex basin and range physiography, and
dynamic changes in climate over the last 10,000 years[138]. Local species diversity is
related to rainfall, more rich in semi-arid zones, while rockiness enhances species
45
1.3.2. Desert Microbiology
Arid lands account for the largest terrestrial biome[126], and stresses such as drought,
temperature and radiation limit the scale of life extension. Research concerning
microbial colonization and dispersion in deserts has been performed to estimate the
function of microbial communities from desert sand which may play an important
role in soil stability, nutrient cycles and environmental health.
Previous studies have predicted that there may be as many as 107 to 109 unique
bacterial species on Earth [139], but with additional sequencing efforts, the species
richness may increase. Species richness estimate are significantly higher in non-polar
as compared with polar deserts [140]. Hot deserts supported significantly higher
abundances of heterotrophic bacteria relative to photoautotrophic bacteria in cold
deserts, and implied that productivity is higher in hot deserts and therefore capable of
supporting greater biomass and trophic complexity than in cold deserts [141].
In many deserts, small poikilohydric life forms constitute a thin veneer on or within
the top few centimeters of most soil and rock surface, which typically contain
cyanobacteria, chlorophytes, fungi, heterotrophic bacteria, lichens and mosses [126].
Soil and rock surface communities are widespread and share general similarities in all
the hot and cold deserts that have been examined worldwide. Cyanobacteria are
major N2 fixation hot spots in arid lands that support an array of heterotrophic
microorganisms, and normally dominant the soil and rock surface community in arid
environments. A study in the Atacama desert showed that the non-cyanobacteria
phototrophic bacteria Chloroflexi are dominant in the hyper-arid core of the desert
[76].
Biological soil crusts (BSCs) are specialized communities comprised of mosses,
46
environments [142,143]. They play important ecological roles in vegetation and
ecological restoration in desert regions through aggregation of soil particles that
reduce wind and water erosion, and different crust developmental and successional
stages have different ecological functions [144]. BSCs increase infiltration and
nitrogen fixation and contribute to local soil organic matter. They may constitute as
much as 70% of the cover of biological organisms in a particular community [145].
These organisms are capable of withstanding desiccation, and often equilibrate their
activities with soil moisture content[146]. BSCs are very sensitive to destruction by
human activities such as grazing, agriculture, construction and outdoor activities
[147].
Epiliths are observed in different types of arid environments. Lichens and mosses
commonly occur on rock surfaces. Biogenic varnishes are well presented, that are
associated with microorganisms, covering Actinobacteria and Proteobacteria.
Hypoliths are photosynthetic organisms that live underneath rocks in arid
environments. Hypolithic colonization is protected by overlying mineral substrate
from incident UV radiation and excessive photosynthetically active radiation (PAR)
[148-150]. It has been reported that cyanobacterial hypoliths occurred on quartz in
major deserts spanning every continent on Earth [151]. The Actinobacteria,
Alphaproteobacteria and Gammaproteobacteria are ubiquitous in all hypoliths, and
photoautotrophic cyanobacteria are more abundant in hypoliths of cold deserts
[141,150,152]. Deinococci appear to be more abundant in warm and hot deserts but
not common in polar hypoliths [76]. Few studies on multi-domain diversity of
hypolithic microorganisms in deserts have been performed [153]. A study using
quantitative PCR estimated the entire hypolithic communities in Tibetan and
Antarctic Dry Valleys, and revealed that eukaryotic and archaeal taxa comprise less
47
Endoliths are organisms (archaea, bacteria, fungi, lichen, algae) that live inside rocks,
or in the pores between mineral grains of a rock. Rocks such as sandstone, limestone
and weathered granite are normal habitats for endoliths in deserts. Endolithic
colonization is widely observed among deserts of all aridity classes, indicating the
advantage of adaptation to drought conditions.
Bioaerosols are suspensions of airborne particles that contain living organisms. They
can disperse with the transportation of desert dust over intercontinental distances.
Airborne microorganisms, such as spore-forming bacteria and mitosporic fungi in
bioaerosols, pose large risks to human and animal health, with long distance traveling
and potential pathogenic abilities.
Microbial communites and their functional structure in deserts are not well studied,
and there are many unanswered questions regarding their biology, physiology and
ecology. With the development of high-throughput technology, more work can be
done using various omics method such as genomics, proteomics or metabolomics, to
48
1.3.3. Bacterial Diversity
Desert biomes have been shown to be remarkably different from other biomes in
terms of soil microbial community composition and function [154]. Traditional
culture-dependent methods for identification of bacterial diversity can only reveal a
very small fraction of the actual bacteria in a community, and the percentage varies
from 0.0001% to 15% in different environments [59]. Modern environmental
microbiology has been greatly enhanced by the application of molecular genetic
technology, which allows the examination of microbial communities through analyses
of microbial DNA, RNA and proteins. Many studies have been performed on the
bacterial community of soils in arid environments using next generation
high-throughput sequencing methods.
The known bacterial diversity on Earth includes approximately 12000 different
species (http://www.bacterio.net/-number.html). The unknown bacterial diversity is
currently explored using molecular microbiology techniques, and many new bacterial
taxa are being submitted to GenBank each year. Early research in the Atacama Desert
based on cell numbers reported that cultivable heterotrophic bacteria are present in the
less arid region of the Atacama Desert at levels of 107 colony-forming units (CFU) per
gram of soil, while only present between 102 to 104 CFU/g of soil in the desert’s core
regions[155]. Populations of aerobic bacteria in deserts across the world are reported
to vary from < 10/g in the Atacama desert to 1.6×10⁷/g in soils of Nevada. Sand dunes
from the Thar are reported to have a relatively smaller population (1.5×10² – 5×10⁴ /g
soil) [156]. Gram-positive spore formers are dominant and the populations do not
decline significantly even during summer, and Actinomycetes may constitute ~50% of
the total microbial bacterial population in desert soils [157].
Using PCR-based biological molecular techniques, microbial research can focus more
49
Pointing et al. (2008) reported that in the Namib Desert, the majority of 16S rDNA
sequences displayed more than 94% homology to members of the Firmicutes
(particularly to members of the genus Bacillus), and bacteria belonging to the
Bacteroidetes, Planctomycetes, Chloroflexi, and Betaproteobacteria groups were also
observed [158]. Connon et al. (2007) found that in the soil of Antarctica, dominant
phylotypes were affiliated to the phyla Acidobacteria, Actinobacteria, Bacteroidetes,
Proteobacteria, Deinococcus-Thermus, Firmicutes, Cyanobacteria and TM7 [159].
An et al. (2013) studied the bacterial communities in samples from the two largest
deserts in Asia, the Taklamaken and Gobi deserts, and found the most dominant phyla
are Firmicutes, Proteobacteria, Bacteroidetes and Actinobacteria [160].
Photosynthetic cyanobacteria can be the primary inhabitants in arid environments,
and typically live a few millimeters below the surface of translucent rocks, such as
quartz, sandstone pebbles, halite and gypsum [161,162]. The capacity to benefit from
a sufficient supply of CO2, N2 and light to allow photosynthesis and N2 fixation while
being protected from desert-like conditions (high radiation, desiccation, salt stress,
etc.), allow these phototrophic communities to be prevalent in deserts. The
distribution of cyanobacterial communities in desert pavements present more
frequently in the form of patches, and their spatial distribution pattern in different sites
are correlated with mean annual precipitation and temperatures [161]. Heterotrophic
bacteria also occur widely in desert environments, including Alphaproteobacteria,
Actinobacteria, Flexibacteria, Firmicutes, Gemmatimonadetes, Planctomycetes and
Deinocuccus-Thermus [163]. Members of the CFB group
(Cytophaga-Flavobacterium-Bacteroides) were found to be dominant in the hot desert
of Tataouine of south Tunisia [164], and in the hyper-arid Taklamakan Desert in
China.
Many studies show that members of the Actinobacteria can be dominant in arid
50
soil[165]. Members of the genera Rubrobacter, Arthrobacter, Thermopolyspora and
Streptomyces have been found in both hot and cold deserts [166]. Members of the
Actinobacteria have wide metabolic and sporulation capacities, as well as multiple
UV repair abilities[167].
Bacteriodetes are also well represented in desert soils. Prestel et al. (2013) reported
that samples from Death Valley soils showed a number of phylotypes with high
homology to members of the Flavobacteriales and to the genus Adhaeribacter of the
class Sphingobacteria [168]. In the Taklamakan Desert, an abundance of Pontibacter
from the family Cytophagaceae were observed [169].
Proteobacteria are globally distributed and were thought to be prominent members of
desert soil bacterial communities[170]. Alpha-, Beta- and Gammaproteobacteria are
often linked to soils with higher rates of organic carbon inputs (Lopez et al. 2013).
However, several studies have shown that Proteobacteria may be functionally
important in nutrient-limited arid environments, since some members in this phylum
are capable of photosynthesis [171].
Members of the phylum Gemmatimonadetes and Firmicutes are also widely observed
in desert soils, and may be comparatively more abundant than in other biomes [154].
Some genera in the Firmicutes phylum, such as Bacillus and Paenibacillus, are able to
form endospores that can facilitate survival under desiccation conditions. Some
aerobic taxa in this phylum are characterized by rapid spore germination,
non-fastidious growth requirements and short doubling times, which are a nice fit for
51
1.3.4. Bacteria in Desert-like Environments and Bacteria involved in
Weathering
Desert-like soil surface features such as desert pavements, surface accumulation of
salt, calcium carbonate accumulation, and surface exposure of gypsum materials are
manifestations of some kind of land deterioration [172]. This kind of land surface is
commonly seen in semi-arid regions outside desert boundaries.
Mineral soil texture in desert-like condition is commonly sandy loam to loam sand.
Sandy soils are formed by the weathering of the Earth's surface. Sand is the largest of
all soil particle types and more spread apart than the particles of organic or clay soils,
and can rarely retain surface water, resulting in less vegetation cover for surface
protection. Sandy soils are formed from rock such as shale, granite, quartz and
limestone. Sand allows air to freely circulate around it.
Desert-like sandy soils are presented as coastal sand soils, sandy loam in the forests
and grassland, and local soil properties shape the bacterial diversity and communities.
Coastal sandy soils in general lack three macronutrients: nitrogen, phosphorous and
potassium [173], which is reported as the primary limit for growth of vegetation in
this soil environment.
Russo et al. (2012)studied the bacterial communities in forests with sandy loam soil
textures in the Lambir Hills National Park of Malaysia, which is sandstone-derived,
nutrient-depleted and well-drained, and showed that Proteobacteria were dominant in
sandy loam, while Acidobacteria were the most abundant group in clay [174]. They
reported that Actinobacteria, Betaproteobaceria, Clostridia, Bacilli and
Gammaproteobacteria were more abundant in sandy loam than in clay. Halliday et al.
52
(Catalina Island, USA), and reported that the phyla Proteobacteria, Bacteroidetes,
Actinobacteria, Planctomycetes and Acidobacteria are dominant [175]. This study
also claimed that bacterial communities of beach sand are broadly similar to soil
communities at the phylum level and strongly influenced by soil pH and temperature.
McHugh et al. (2014)reported that in the semi-arid grasslands of Arizona and New
Mexico, bacterial communities were dominated by members the phyla Actinobacteria
(53 %), Proteobacteria (16 %), and Acidobacteria (8.7 %) [176].
Microorganisms colonized on the surfaces of mineral soils contribute to precipitation
of new minerals and to carbonate production, which plays an important role in the soil
environment by contributing to the release of key nutrients. Several bacterial strains
from different genera have been found to have mineral-weathering abilities, such as
Anabaena, Bradyrhizobium, Burkholderia and Collimonas [177]. It has been reported
that surface soil mineral particles appear to be inhabited by different communities: in
limestone, the endolithic bacterial communities are comprised of Gram-positive
bacteria and Acidobacteria, while the epilithic population are ~50% Proteobacteria
[126]. Different primary minerals, such as granite, limestone, apatite, plagioclase, and
quartz are colonized by different bacteria [178,179]. Studies of bacterial communities
in soils with different mineral composition showed that concentrations of major
elements, such as aluminium and calcium, seem to have a significant impact on the
structure of the bacterial community [180].