HAL Id: hal-01249015
https://hal.archives-ouvertes.fr/hal-01249015
Submitted on 7 Jan 2016
HAL is a multi-disciplinary open access
archive for the deposit and dissemination of
sci-entific research documents, whether they are
pub-lished or not. The documents may come from
teaching and research institutions in France or
abroad, or from public or private research centers.
L’archive ouverte pluridisciplinaire HAL, est
destinée au dépôt et à la diffusion de documents
scientifiques de niveau recherche, publiés ou non,
émanant des établissements d’enseignement et de
recherche français ou étrangers, des laboratoires
publics ou privés.
Variational Physiologically Informed Solution to
Hemodynamic and Perfusion Response Estimation from
ASL fMRI Data
Aina Frau-Pascual, Florence Forbes, Philippe Ciuciu
To cite this version:
Aina Frau-Pascual, Florence Forbes, Philippe Ciuciu. Variational Physiologically Informed Solution to
Hemodynamic and Perfusion Response Estimation from ASL fMRI Data. 2015 International
Work-shop on Pattern Recognition in NeuroImaging, Jun 2015, Stanford, CA, United States. pp.57-60,
�10.1109/PRNI.2015.12�. �hal-01249015�
Variational physiologically informed solution to
hemodynamic and perfusion response estimation
from ASL fMRI data
Aina Frau-Pascual
1,3, Florence Forbes
1, Philippe Ciuciu
2,31
INRIA, MISTIS, Grenoble University, LJK, Grenoble, France
2CEA/DSV/IBM NeuroSpin center, Bˆat. 145, F-91191 Gif-sur-Yvette, France
3
INRIA, Parietal, F-91893 Orsay, France
Abstract— Functional Arterial Spin Labeling (fASL) MRI can provide a quantitative measurement of cerebral blood flow. A joint detection-estimation (JDE) framework has been considered to extract task-related perfusion and hemodynamic responses not restricted to canonical response function shapes. In this work, we provide a variational expectation-maximization (VEM) algorithm for hemodynamic and perfusion responses estimation. This approach provides a lower computational load compared to previous attempts, and facilitates the incorporation of prior knowledge and constraints in the estimation. Validation on simulated and real data sets has been performed.
I. INTRODUCTION
Functional Arterial Spin Labeling (fASL) is a functional MRI modality that is able to provide a quantitative measure-ment of cerebral blood flow (CBF) and its variations elicited by specific tasks. Although ASL [1] is mainly used as a static probe of cerebral perfusion, it has also been used in functional MRI as an alternative to the standard blood-oxygen-level-dependent (BOLD) [2] modality, as it can give more specific information about brain function. FASL data consists of alternating pairs of control and magnetically tagged (”tag”) images. Local CBF or perfusion changes can be measured by doing the “control-tag” difference, so as to get rid of the hemodynamic component (BOLD effect) of the signal contained in both control and tag images. Many pairs (ą 50) of control-tag images need to be acquired to compensate for the low Signal-to-Noise Ratio (SNR) of this difference.
The standard approach for fASL analysis is general linear model (GLM) [3], [4] using the stimulus-induced canoni-cal hemodynamic response function (HRF) as regressor for both components of the signal: hemodynamic and perfusion components. The latter one encodes “control-tag” differences. Although the canonical HRF is generally used, it has been just calibrated on BOLD experiments and it reflects simultaneous variations of CBF, cerebral blood volume (CBV) and cerebral
oxygen consumption (CMRO2). In contrast, the perfusion
response function (PRF) only reflects the variation in CBF and thus departs from the canonical shape. Moreover, there has been evidence that this response can vary between regions and across subjects so that assuming a constant response shape might be misleading. Some flexibility in the response
shape has already been considered in BOLD GLM analysis by using time/dispersion derivatives [5] or finite impulse response models.
In a joint detection-estimation (JDE) framework both task-related perfusion and hemodynamic responses can be esti-mated as well as perfusion-related and BOLD-related maps of evoked activity. JDE has been originally developed for BOLD data analysis [6], [7] and has been extended in [8] for fASL data analysis, considering Monte Carlo Markov Chains (MCMC) methods. In this work, following the spirit of [7], we provide an alternative solution based on the variational expectation-maximization (VEM) algorithm. This framework is more convenient to deal with constraints (eg, normalization or positivity) in the M-step. JDE-VEM provides comparable results to JDE-MCMC for a much lower compu-tational load. One of the novelties is the introduction of prior knowledge as in [9] through the relationship between perfusion and hemodynamic responses derived from physiological mod-els [10], [11]. This relationship allows us to inform the PRF estimation from the HRF one, as the hemodynamic component has a higher SNR than the perfusion one due to the acquisition procedure. Experiments on simulated and real data show the good performance of the method, with a fast convergence of the parameter estimates.
II. JOINTDETECTIONESTIMATION MODEL FOR FASL
In fASL the magnetically tagged image reflects a perfusion effect besides the hemodynamic effect, that can be subtracted by comparison with the control image. The control image is a noisy BOLD signal because of the effect of the magnetic tag-ging. The different ASL signal components can be explained with the ASL JDE model [8], [12], a region-based approach that considers functionally homogeneous regions. In a region P comprising J voxels, the generative model for j P J:
yj“ M ÿ m“1 amj Xmh looomooon paq ` cmj W X mg looooomooooon pbq ` P `j loomoon pcq ` αjw loomoon pdq ` bj loomoon peq (1)
in the presence of M experimental conditions. The data yj P
and (b) perfusion components; (c) a drift component P `j;
(d) a perfusion baseline term αjw1 which completes the
modelling of the perfusion component and (e) a noise term,
assumed white Gaussian of variance σ2j. The control/tag effect
is implicit in the ASL JDE model given the use of W “ diagpwq. Vectors h and g represent the D-dimensional (D ă N ) unknown HRF and PRF shapes, constant within P. The magnitudes of activation or response levels for hemodynamic
and perfusion components are a “ am
j ( and c “ cm j ( and
denoted as BRLs and PRLs hereafter. X PRN ˆDis a binary
matrix that encodes the lagged onset stimuli. The response levels are assumed to follow different spatial Gaussian mixture models but governed by M common binary hidden Markov
random fields qm with qm“ tqmj, j P Pu encoding voxels’
activation states for each experimental condition m. BRLs and PRLs are assumed independent conditionally to q “
tqm, m “ 1 : M u. For further detail, please refer to [8].
The perfusion component in the ASL signal has a very low SNR owing to its small size captured by the “control-tag” subtraction. To address this issue, a conditional prior has been used to inform the PRF estimation from the less noisy HRF recovery during inference. To link these two responses, a relationship g “ Ωh was derived in [9] from physiological models. In our model, we consider that HRF and PRF shapes
follow prior Gaussian distributions h ∼ N p0, vhΣhq and
g|h ∼ N pΩh, vgΣgq, with covariance matrices Σh and Σg
encoding a constraint on the second order derivative so as to account for temporal smoothness. We also consider constraints
on the response functions to enforce their L2-norm to be 1,
i.e. h, g P S2pRD`1q, S2pRD`1q being the L2 unit ball of
RD`1.
III. VARIATIONALEM
In our fASL model, there are missing parameters that need to be estimated: a P A, h P H, c P C, g P G, q P Q. In this work, an Expectation-Maximization (EM)framework is proposed to perform the estimation. EM can be viewed [13] as an alternating maximization procedure of a function
F such that for any ˜p P D, being D the set of
all probability distributions on A ˆ H ˆ C ˆ G ˆ Q,
F p˜p, θq “ Ep˜“log ppy, a, h, c, g, q ; θq‰ ` Ir˜ps. Here Ir˜ps “
´Ep˜“log ˜ppa, h, c, g, qq
‰
is the entropy of ˜p, and Ep˜
“‰ denotes
the expectation with respect to ˜p. Maximizing function F
is equivalent to minimizing the Kullback-Leibler divergence
KLp˜p, ppa, h, c, g, q|yqq, that gives a measure of the distance
between two distributions, in this case the approximation ˜
p and the true ppa, h, c, g, q|yq distributions. This view of EM has led to a number of variants in which the E-step is solved over a restricted class of probability distributions,
˜
D. The variational approach corresponds to ˜D chosen as
the set of distributions that factorize as ˜ppa, h, c, g, qq “
˜
papaq ˜phphq ˜pcpcq ˜pgpgq ˜pqpqq where ˜pa P DA, ˜ph P
DH, ˜pc P DC, ˜pg P DG and ˜pq P DQ , the sets of
probability distributions on A, H, C, G, Q respectively. Note
1Vector w is N -dimensional such that w
tn“ 1{2 if tnis even (control)
and wtn“ ´1{2 otherwise (tagged).
that the dependence between random variables, as in MCMC, is translated into dependence between statistical moments in VEM. The E-step becomes an approximate E-step that can be further decomposed into five stages updating the different variables in turn. At iteration prq, with current estimates
denoted by p˜pr´1qa , ˜ppr´1qh , ˜p
pr´1q
c , ˜ppr´1qg , ˜ppr´1qq and θprq, the
updating formulae are of the form: E-H-step: ˜ pprqh “ arg max ˜ phPDH F p˜ppr´1qa p˜hp˜pr´1qc p˜pr´1qg p˜pr´1qq ; θprqq (2) E-G-step: ˜ pprq g “ arg max ˜ pgPDG F p˜ppr´1q a p˜ prq h p˜ pr´1q c p˜g p˜pr´1qq ; θprqq (3)
with similar expressions for the other steps obtained by permuting the roles of the variables. Hereafter, for the ease of presentation, the prq and pr ´ 1q superscripts are omitted. We also consider normalization constraints on h and g so that
our solution has unit L2-norm. For that matter, we modify
the seek variational approximation to ˜p “ ˜pa δ˜h p˜c δg˜ p˜q,
where the probabilities on h and g are replaced by Dirac functions. This reduces the search to pointwise estimates ˜
h and ˜g. The E-H and E-G steps in Eqs. (2)-(3) yield
then maximizations problems which are easily constrained to account for normalization:
E-H: ˜h “ arg max
h Ep˜ap˜cp˜q“log pph | y, a, c, ˜g, q; θq‰ (4)
E-G: ˜g “ arg max
g Ep˜ap˜cp˜q“log ppg | y, a, ˜h, c, q; θq‰ (5)
It is straightforward to see that (4) and (5) amount to minimiz-ing a quadratic function under a quadratic constraint, namely
}h}2“ 1 and }g}2“ 1 respectively. The other E-steps can be
derived from standard expressions replacing expectations over
h and g by ˜h and ˜g, e.g.:
E-Q: ˜pqpqq9 exp
´
Ep˜ap˜c“log ppq | y, a, ˜h, c, ˜g; θq‰
¯ , (6) with similar expressions for the E-A and E-C steps obtained by permutations of the variables. BRLs and PRLs have Gaussian distributions as the likelihood and the priors are Gaussian too. Regarding the labels, a further factorization is needed: ˜
pqmpqmq “
ś
jPJ
˜
pqmjpqmjq. The labels depend on the BRLs
and PRLs as well as on the binary activation states qmj.
The corresponding M-step is given by: M: θ “ arg max θPΘ „ Ep˜ap˜c“log ppy | a, ˜h, c, ˜g; α, `, σ 2 q‰ ` log pp˜h; vhq ` log pp˜g; vgq ` Ep˜ap˜q“log ppa | q; µa, σaq ‰ ` Ep˜cp˜q“log ppc | q; µc, σcq ‰ ` Ep˜q“log ppq; βq‰ where θ “ α, `, σ2, µ a,c, σa,c, vh, vg, β (
. Given the sepa-rability of the prior probability density functions, the M-step can be divided into separate M-steps, as in [7]. Note here
that a mean-field approximation is used to compute the MRF parameter β. For further details on these aspects, the reader is invited to refer to [7].
IV. RESULTS
Different data sets have been analysed to test the perfor-mance of this algorithm. First, some artificial data has been generated with the ASL JDE generative model. Then, real data
acquired on different individuals from the AINSI initiative2
have been analysed to validate the proposed approach. A. Artificial data
N “ 288 ASL artificial images (i.e. 144 control/tag pairs) have been simulated using a realistic low SNR according to the observation model in Eq. (1). Different levels of SNR have been used, in order to show the performance of the method depending on the noise level. To emulate the slow sampling rate of ASL images, Eq. (1) was synthesized at ∆t “ 0.5s and then down-sampled at a certain time of repetition (TR), which means that the temporal resolution of rows (TR) and
columns (∆t) of Xm is different. Here, we considered a fast
event-related paradigm comprising two conditions (M “ 2), with mean ISI “ 5s. TR “ 3s. is considered as a realistic ASL experiment, compared to the TR “ 1s. that could be used for a realistic experiment when using BOLD signal.
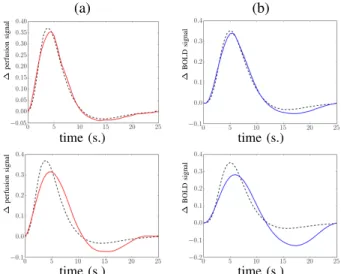
In the experiments, h and g are generated as depicted in Fig.2(a)-(b) by dashed lines. P is a polynomial basis of order O “ 4. Drift coefficients and noise realizations were
drawn according to `j „ N p0, 10.IOq and bj„ N p0, 2.INq,
respectively. BRLs were sampled from pam
j |qmj “ 1q „
N p2.2, 0.3q (for activating voxels) and from pam
j |qmj “ 0q „
N p0, 0.3q (for inactivating voxels). PRLs were generated with
a lower contrast than BRLs: pcmj |q
m
j “ 1q „ N p1.6, 0.3q and
pcmj |qmj “ 0q „ N p0, 0.3q. PRLs and BRLs were chosen so
as to make this synthetic setting realistic: PRLs lower than BRLs, and activating/non-activating voxels distribution means close. Activation states (assignment variables Q) were set by a hand-drawn map.
noise variance
Fig. 1. RMSE of the response functions BRF and PRF estimated in experiments generated with different SNRs. Here the difference of the errors in the case of TR “ 1s and TR “ 3s is shown.
2http://thalie.ujf-grenoble.fr/ainsi (a) (b) ∆ perfusion signal ∆ BOLD signal time (s.) time (s.) ∆ perfusion signal ∆ BOLD signal time (s.) time (s.)
Fig. 2. Artificial data: Ground-truth response curves (black dashed lines) and estimated perfusion (a) and hemodynamic (b) response functions. The first and second rows correspond to the response functions for TR “ 3s and noise variances 1 (i.e. SNR “ 2.4 dB, top) and 6 (SNR “ 0.5 dB, bottom).
simulated
T R “ 1 s.
T R “ 3 s.
(a) (b) (c)
Fig. 3. Results on artificial data for response levels. Top row: ground-truth maps. Center and bottom rows: estimated maps for T R “ 1 s and T R “ 3 s. (a) Hemodynamic response levels. (b) Perfusion response levels. (c) Assignment variables (activation states).
Fig. 1 shows the root mean squared error (RMSE) of the estimated PRFs and HRFs for experiments generated with noise variances from 1 to 6, which corresponds to decreasing the SNR from 2 down to 0.5 dB. Curves are depicted for TR “ 1s and TR “ 3s, so as to show the impact of increasing TR on the performance of the method and thus mimicing part of the increased difficulty when moving from BOLD to ASL fMRI data. For TR “ 1s, we observed as expected good HRF and PRF estimates with an accurate recovery of both peaks (Fig. 2 top), as well as good BRLs and PRLs map estimates (Fig. 3 center). In terms of RMSE (Fig. 1), the values are pretty close to each other although slightly larger for the PRF. However, in the case of TR “ 3s, we recovered a much better PRF estimate owing to a large undershoot in the HRF shapes for very low SNR scenarios (Fig. 2 bottom right). For the worse SNR scenario, we obtained over-smoothed shapes, with peaks displaced compared to the ground truth.
(a) (b)
(c) (d)
∆
signal
time (s.)
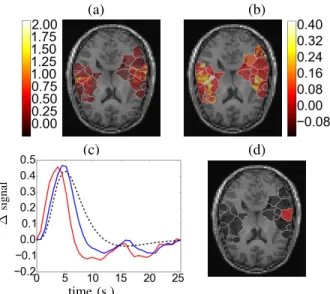
Fig. 4. Results on real fASL data for a subject of the AINSI database, for the auditory condition (radiological convention: Left is right). (a) BRLs, (b) PRLs, (c) response functions (d) region of interest of the response functions. In (c), theredandbluecurves represent thePRFandHRFestimates. As a reference, we depicted the canonical HRF in black dashed line.
This impacts the recovery of the hemodynamic and perfusion activation maps too (see Fig. 3 bottom vs center), much worse in this case. Figs. 1 -2 show that despite the dependence on the SNR level, our shape estimates are pretty reliable. B. Real data
Real ASL data were recorded during an experiment de-signed to map auditory and visual brain functions, which consisted of N “ 291 scans lasting T R “ 3 s, with T E “ 18 ms, FoV 192 mm, each yielding a 3-D volume composed
of 64 ˆ 64 ˆ 22 voxels (resolution of 3 ˆ 3 ˆ 7 mm3). The
tagging scheme used was PICORE Q2T, with T I1“ 700 ms,
T I2“ 1700 ms. The paradigm was a fast event-related design
(mean ISI “ 5.1 s) comprising sixty auditory and visual stimuli. Ward parcellations were computed in auditory and visual cortices for regionally analysing the evoked activity elicited by auditory and visual stimuli, respectively.
The estimation results are depicted in Fig. 4. First, it is worth noting that as expected we recovered BOLD response levels with larger magnitude compared to that of the perfusion response levels (Fig. 4(a)-(b)). Interestingly, in response to auditory stimuli, we retrieved bilateral evoked activity in the auditory cortices for the BOLD and perfusion components, although not exactly in the same parcels. Subsequent thresh-olding of individual posterior probability maps should allow us to derive reliable statistical maps. Besides, we also recovered plausible shapes for BRF and PRF estimates, as illustrated in Fig. 4(c), where we selected a parcel corresponding to high BRL values. As expected, the HRF shape in the primary auditory cortex (left hemisphere) is well captured by the canonical shape. The physiological prior helps the parame-ter estimation, in the perfusion component and enforces the temporal precedence of the PRF estimate over the HRF one.
V. DISCUSSION
We proposed a variational Expectation-Maximization algo-rithm to address the issue of jointly detecting activity and estimating hemodynamic and perfusion responses from func-tional ASL data. The variafunc-tional approach has the advantage to provide estimations in analytic form for each variable of interest. It facilitates the inclusion of additional information from physiological models and the incorporation of constraints on the responses to favor stability in the estimations. In particular, we considered a physiologically informed link between normalized hemodynamic and perfusion responses so as to compensate the low signal-to-noise ratio of the perfusion component. The results obtained on simulated and real data indicate a good performance of the approach and suggest the variational approach as a potential robust, fast and pragmatic method to analyse challenging ASL data. Addressing perfusion quantification is then the main perspective of this work as providing a good estimation of perfusion modulation effects might translate into more accurate quantification of perfusion.
REFERENCES
[1] D. Williams, J. Detre, J. Leigh, and A. Koretsky, “Magnetic resonance imaging of perfusion using spin inversion of arterial water,” Proceedings of the National Academy of Sciences, vol. 89, no. 1, pp. 212–216, 1992. [2] S. Ogawa, D.W. Tank, R. Menon, J.M. Ellermann, S-G. Kim, H. Merkle, and K. Ugurbil, “Intrinsic signal changes accompanying sensory stim-ulation: functional brain mapping with magnetic resonance imaging,” Proceedings of the National Academy of Sciences, vol. 89, pp. 5951– 5955, 1992.
[3] L. Hernandez-Garcia, H. Jahanian, and D. B. Rowe, “Quantitative analysis of arterial spin labeling fMRI data using a general linear model,” Magnetic resonance imaging, vol. 28, no. 7, pp. 919–927, 2010. [4] J. A. Mumford, L. Hernandez-Garcia, G. R. Lee, and T. E. Nichols,
“Estimation efficiency and statistical power in arterial spin labeling fMRI,” Neuroimage, vol. 33, no. 1, pp. 103–114, 2006.
[5] Karl J Friston, P Fletcher, Oliver Josephs, A Holmes, MD Rugg, and Robert Turner, “Event-related fmri: characterizing differential responses,” Neuroimage, vol. 7, no. 1, pp. 30–40, 1998.
[6] T. Vincent, L. Risser, and P. Ciuciu, “Spatially adaptive mixture modeling for analysis of within-subject fMRI time series,” IEEE Trans. on Medical Imaging, vol. 29, no. 4, pp. 1059–1074, Apr. 2010. [7] L. Chaari, T. Vincent, F. Forbes, M. Dojat, and P. Ciuciu, “Fast joint
detection-estimation of evoked brain activity in event-related fMRI using a variational approach,” IEEE Trans. on Medical Imaging, vol. 32, no. 5, pp. 821–837, May 2013.
[8] T. Vincent, J. Warnking, M. Villien, A. Krainik, P. Ciuciu, and F. Forbes, “Bayesian Joint Detection-Estimation of cerebral vasoreactivity from ASL fMRI data,” in 16th Proc. MICCAI, LNCS Springer Verlag, Nagoya, Japan, Sept. 2013, vol. 2, pp. 616–623.
[9] A. Frau-Pascual, T. Vincent, J. Sloboda, P. Ciuciu, and F. Forbes, “Physiologically informed Bayesian analysis of ASL fMRI data,” in Bayesian and grAphical Models for Biomedical Imaging, pp. 37–48. Springer, 2014.
[10] R. B. Buxton, E. C. Wong, and Frank. L. R., “Dynamics of blood flow and oxygenation changes during brain activation: the balloon model,” Magnetic Resonance in Medicine, vol. 39, pp. 855–864, June 1998. [11] K. J. Friston, A. Mechelli, R. Turner, and C. J. Price, “Nonlinear
responses in fMRI: the balloon model, Volterra kernels, and other hemodynamics,” Neuroimage, vol. 12, pp. 466–477, June 2000. [12] T. Vincent, F. Forbes, and P. Ciuciu, “Bayesian BOLD and perfusion
source separation and deconvolution from functional ASL imaging,” in 38th Proc. IEEE ICASSP, Vancouver, Canada, May 2013, pp. 1003– 1007.
[13] R.M. Neal and G. E. Hinton, “A view of the EM algorithm that justifies incremental, sparse, and other variants,” in Learning in graphical models, pp. 355–368. Springer, 1998.