Publisher’s version / Version de l'éditeur:
Journal of Testing and Evaluation, 36, May 3, pp. 230-241, 2008-05-01
READ THESE TERMS AND CONDITIONS CAREFULLY BEFORE USING THIS WEBSITE.
https://nrc-publications.canada.ca/eng/copyright
Vous avez des questions? Nous pouvons vous aider. Pour communiquer directement avec un auteur, consultez la
première page de la revue dans laquelle son article a été publié afin de trouver ses coordonnées. Si vous n’arrivez pas à les repérer, communiquez avec nous à [email protected].
Questions? Contact the NRC Publications Archive team at
[email protected]. If you wish to email the authors directly, please see the first page of the publication for their contact information.
NRC Publications Archive
Archives des publications du CNRC
This publication could be one of several versions: author’s original, accepted manuscript or the publisher’s version. / La version de cette publication peut être l’une des suivantes : la version prépublication de l’auteur, la version acceptée du manuscrit ou la version de l’éditeur.
Access and use of this website and the material on it are subject to the Terms and Conditions set forth at Development of a new test method for air intrusion quantification of roofing assemblies
Molleti, S.; Baskaran, B. A.; Ko, S. K. P.
https://publications-cnrc.canada.ca/fra/droits
L’accès à ce site Web et l’utilisation de son contenu sont assujettis aux conditions présentées dans le site LISEZ CES CONDITIONS ATTENTIVEMENT AVANT D’UTILISER CE SITE WEB.
NRC Publications Record / Notice d'Archives des publications de CNRC:
https://nrc-publications.canada.ca/eng/view/object/?id=4987ad0a-7d93-47d4-ba89-90f1cb1bd328 https://publications-cnrc.canada.ca/fra/voir/objet/?id=4987ad0a-7d93-47d4-ba89-90f1cb1bd328
http://irc.nrc-cnrc.gc.ca
D e v e l o p m e n t o f a n e w t e s t m e t h o d f o r a i r
i n t r u s i o n q u a n t i f i c a t i o n o f r o o f i n g a s s e m b l i e s
N R C C - 4 8 7 1 2
M o l l e t i , S . ; B a s k a r a n , B . A . ; K o , S . K . P .
A version of this document is published in / Une version de ce document se trouve dans: Journal of Testing and Evaluation, v. 36, no. 3, May 2008, pp. 230-241
The material in this document is covered by the provisions of the Copyright Act, by Canadian laws, policies, regulations and international agreements. Such provisions serve to identify the information source and, in specific instances, to prohibit reproduction of materials without written permission. For more information visit http://laws.justice.gc.ca/en/showtdm/cs/C-42
Les renseignements dans ce document sont protégés par la Loi sur le droit d'auteur, par les lois, les politiques et les règlements du Canada et des accords internationaux. Ces dispositions permettent d'identifier la source de l'information et, dans certains cas, d'interdire la copie de documents sans permission écrite. Pour obtenir de plus amples renseignements : http://lois.justice.gc.ca/fr/showtdm/cs/C-42
Development of a New Test Method for Air Intrusion Quantification of
Roofing Assemblies
Suda Molleti, Ph.D.,1C Bas A. Baskaran Ph.D., P.Eng.,2 Steven Kee Ping Ko, M.Eng.3 1
Research Officer, 2Senior Research Officer and 3 Technical Officer National Research Council, 1200 Montreal Road, Ottawa,
ON, Canada, K1A OR6
ABSTRACT
In North America, approximately one fourth of low-slope buildings are roofed with a mechanically attached assembly (MAA) with a single-ply membrane. During wind suctions, the membrane can lift and billow. This creates localized suction under the membrane. If design provisions are not made to control the air intruison at the deck level, this suction pressure can draw the indoor conditioned air into the assembly. Two main factors influence the air intrusion: the air permeability of the components and shape or volume changes during the wind uplift. Available standard test procedures can quantify the former for roof materials. However, there is no widely accepted standard specification or test to address the air intrusion characteristics of roofing assemblies. Air leakage measurement techniques used for walls are also not applicable for roof
assemblies due to the membrane shape and volume changes in the roof assembly. Research efforts are under way at the National Research Council of Canada to quantify the air intrusion rate of roof assemblies. This paper presents the details of the
experimental set-up, test procedure and validation effort of this newly developed test method.
Keywords: roofs, roof components, assemblies, air leakage, air intrusion, test method, wind.
C
Corresponding Author. Tel:613-993 9673; Fax: 613-998-6802; E-mail: [email protected]
INTRODUCTION
In North America, low-slope roofing assemblies fall into two categories according to the location of the waterproofing membrane (Baskaran et al., 1997): the protected roofing assembly in which the membrane is below the insulation and the conventional roofing assembly in which the membrane is on the top of the insulation. In the conventional assembly, the membrane is exposed to external conditions, such as wind, snow, rain, ultraviolet radiation and temperature changes. This study focuses on the behaviour of conventional roofing assemblies.
In general, airflow control in a building envelope is achieved by the installation of an air barrier system in the building envelope assembly. In cold climates, the air barrier system can also reduce the risk to the formation condensation by impeding the transfer of airborne moisture into the assembly. The terms “air barrier system” and “vapour barrier (retarder)” are sometimes misunderstood. A vapour barrier controls the
movement of moisture as a result of a vapour pressure difference. This airflow control is achieved by using air barrier materials and sealing joints and junctions. Sometimes, attempts have been made to achieve the requirements of both (air and vapour control) with one component (Quirouette, 1985). However, component properties and system performance should be considered before deciding that one component can do double duty controlling both air and vapour.
In conventional roof assemblies, the membrane can be mechanically attached, fully adhered or partially attached to the substrate. A roofing assembly in which the membrane is attached, through insulation and other components, to the structural deck at discrete points using fasteners is known as a mechanically attached assembly
(MAA). The membrane can be single ply, such as PVC (polyvinyl chloride), EPDM (ethylene propylene diene monomer) or TPO (thermoplastic olefin), or two ply, as in the case of modified bituminous membranes. About one fourth of North American low-sloped buildings are roofed with MAAs with single-ply membranes (NRCA, 2004).
The material property of the single ply membranes indicate that they have non-measurable air flow i.e. they are impermeable ( Bomberg and Kumaran 1985, CMHC 1988). Therefore MAAs with single-ply membranes are vulnerable to “air intrusion” rather than “air leakage”. These terms can be defined as follows:
Air Leakage: When air enters or leaves from one environmental condition to the other environmental condition through the building envelope assembly such as walls and windows, it is termed as “Air Leakage” (the air movement is in bidirectional).
Air Intrusion: When the conditioned indoor air intrudes into a building envelope assembly such as roofs, it is termed as “Air Intrusion” (air movement is unidirectional). Explanation of air intrusion in roof assemblies will be more detailed in the following section.
PROBLEM IDENTIFICATION
Considering the history of the conventional roofing systems, the built up roofing systems (BUR) have been applied in the field for over a century. The BUR systems were both labour-intensive to install and cost effective as it involves lot of petroleum products. With the advancement in the roofing technology, the BUR systems are being replaced by the singly ply mechanically attached roofing systems (Baskaran et al,1997). Mechanically attached assemblies represent the new generation of single-ply membrane roofs. The MAAs differ significantly from conventional BUR roofs. In the BUR assembly, different
plies of felts are fully adhered to the substrate; this offers significant resistance to airflow. Air intrusion control in a MAA is more complex due to the discontinuous attachment of the flexible membrane. With proper design, the MAA can offer good wind uplift resistance. However, its air intrusion performance is not well understood. For airflow to occur, there must be both a pressure difference between two locations and a continuous flow path or opening connecting the two locations.
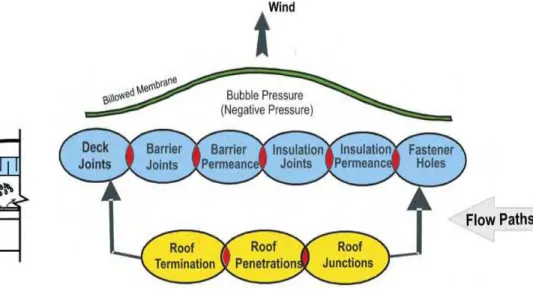
A MAA meets these two prerequisites during wind uplift conditions. Figure 1 illustrates the airflow mechanism through a MAA. The waterproof membrane, which is intended to act as an air barrier, is placed on top of the insulation and attached to the structural steel deck using mechanical fasteners. The attachment locations are then overlapped and seamed. Wind-induced suction lifts the membrane and causes membrane elongation and billowing between the attachments. The magnitude of the wind-induced suction, the membrane’s elastic properties and its fastening pattern determine the degree of deflection of the billowing membrane. The momentary
displacement or billowing of the membrane creates a relative negative pressure below the lifted membrane and this draws indoor air into the roof, thereby satisfying the first prerequisite.
The second prerequisite is met by the lack of airflow control at the deck level. A roofing assembly has many components with variations in air permeability properties. It also has junctions, penetrations and terminations, making it difficult to estimate the effective cross-sectional leakage area and the flow path lengths of these openings. Thus, the theoretical quantification of the air intrusion rate is not a viable solution.
Openings or leakage paths in a roofing assembly may be classified as channel, orifice or diffuse flow.
Channel Flow
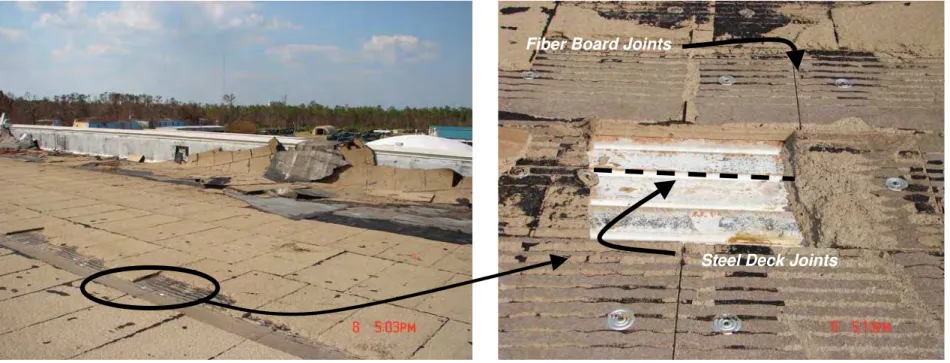
This is the most common type of opening or leakage path in the roofing assembly characterized by a tortuous path from an opening on one side of a roofing assembly to an opening on the other. Typical examples of channel flow paths include air intrusion along steel deck flutes, at insulation joints and the edges of gypsum board finish. Figure 2(a) shows a failed roofing assembly during a recent hurricane (RICOWI, 2006). The failed assembly was devoid of any barrier and, consequently, the channel flow paths at the steel deck and insulation joints provided the necessary air intrusion into the
assembly. This air intrusion contributed to the peeling of the membrane, and eventually the failure of the assembly. Some openings or leakage paths may also develop after construction, because of the thermal expansion and contraction of the roof components.
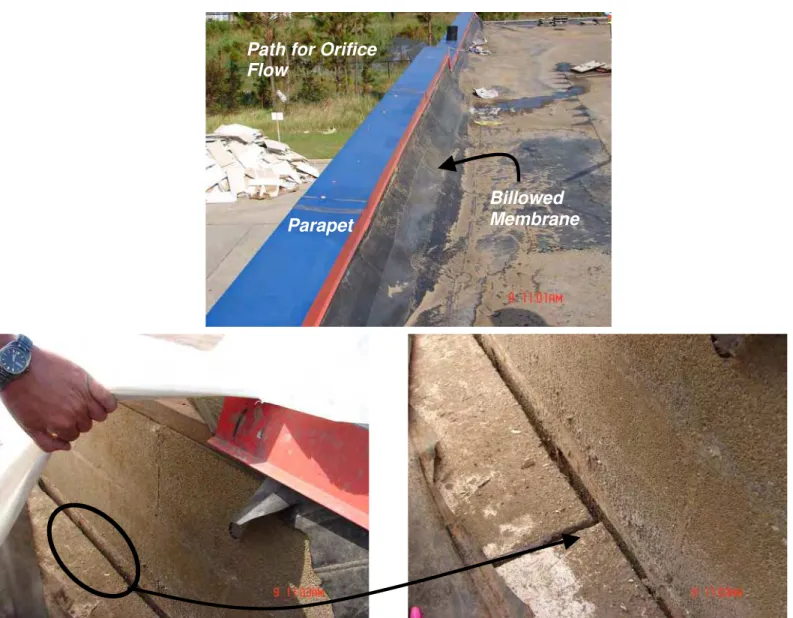
Orifice Flow
Orifice flow is characterized by a direct opening, such as a hole, crack or joint, through which the air enters and exits. In this case, the flow path is linear, short and direct. Figure 2(b) illustrates two scenarios of orifice flow in the roofing assembly, which led to the failure of the assembly. In the first scenario, the direct opening between the parapet wall and the insulation paved the way for air to enter the assembly thus peeling the membrane away from the roof termination and the parapet wall. In the second, the gap between the parapet wall and the concrete substrate provided the necessary path for the orifice flow, which led to failure. Interestingly, in the second scenario, the small gap
of approximately 25 mm (1/2”) led to a major failure of the roofing assembly. These failure modes clearly signify the importance of air intrusion, which is neglected in current roofing industry practices. Another typical example of orifice flow in a mechanically attached roofing system is the fastener hole. In a re-roofing process, an increase in the number of fastener holes may provide the necessary flow path for air seepage, which may contribute significantly to the overall system leakage rate.
Diffuse Flow
Diffuse flow occurs when materials used in the roofing system are ineffective in controlling air leakage due to many cracks or their high permeance to air, such as fibrous insulation (Lux and Brown,1986). Diffuse flow is characterized by the screen effect or the permeance of the roofing material. Figure 2(c) illustrates the occurrence of diffuse flow in a typical roofing assembly.
If the above two prerequisites for air intrusion exist, then the MAA is highly susceptible to air intrusion. This air intrusion can influence the wind uplift resistance of the roofing assembly (Baskaran et al., 2006). As well, it can lead to reduced thermal comfort, moisture damage of building envelope components and increased energy consumption. Despite the significance of air intrusion on roofing system performance, no study in the literature addresses the air intrusion characteristics of a roofing
assembly. This includes the permeability of a roofing assembly, and test procedures and acceptance criteria to characterize the air permeance of a roofing assembly. PRESENT CONTRIBUTION
With advances in roofing technology, different types of commercial air barrier materials, vapour barriers and membranes are being introduced into the market. However, no
standard specifications or test methods exist to quantify or determine the air intrusion resistance of a MAA. To address this, a new experimental procedure has been
developed at the National Research Council of Canada (NRC) to quantify air intrusion in MAAs. This paper presents the design, methodology and calibration of the new test method by:
• providing a summary of previous studies related to air movement in a roofing assembly;
• giving a brief overview of existing air leakage standards that highlight the necessity of an air intrusion standard for roofing assemblies;
• describing the experimental set-up and test procedure of the new test method; • calibrating the test method; and
• identifying the limitations of the test method.
AIR INTRUSION THROUGH ROOFING ASSEMBLIES: A BRIEF OVERVIEW
Previous studies related to air movement in the roofing assembly highlight the lack of research data and any attempts to quantify air intrusion of roofing assemblies. Although only three key studies are discussed, an additional detailed literature review can be found in Molleti (2006).
Dregger (1991), discussed the role of air retarders in helping to resist wind uplift forces on a roofing assembly. The emphasis was on loosely laid and mechanically attached single-ply roofing systems. An air retarder can be any sheeting material installed next to the steel deck. However, some roof decks, such as a cast-in-place concrete deck or steel deck with concrete toppings, can also act as air retarders. When using a
polyethylene sheet or other sheet membrane as an air retarder, it must be held down by an adhesive or mechanically fastened insulation boards. Air retarders, like chains, are
only as strong as the weakest link. Improper sealing around roof penetrations and terminations is a common weak link in roof assembly construction. The role of a vapour retarder in providing air intrusion resistance and its effect on wind uplift forces were also discussed, but no experimental proof was mentioned or any results presented in this paper. The paper further indicates that the influence of air intrusion is also important in adhered roofing systems where it may bring about insulation facer peeling or membrane peeling that leads to problems of delamination of the assembly.
Zarghamee (1990) studied the effect of wind pressure on an inflated single-ply roofing membrane and its attachment mechanism. He contended that the behaviour of a
mechanically attached single-ply roofing membrane is affected by the air infiltration rate below the membrane in addition to the external pressure changes occurring above the membrane. He also described the relationship between air infiltration and the response of roofing membranes to the fluctuating or dynamic component of wind pressure. Zarghamee proposed that the roofing system design take into account a percentage of the dynamic wind pressure component. The percentage used would depend on whether the roofing section is considered to allow low, average or high rates of air infiltration. He concluded by mentioning that further research is needed to quantify the relationship between air infiltration and the distribution of wind uplift forces.
Quirouette (1985) defined the functions of the vapour and air barriers. The vapour barrier prevents water vapour diffusion through an insulated building envelope. Vapour diffusion control is simple to achieve and is primarily a function of the water diffusion resistance of the chosen materials and their position within the envelope assembly. The air barrier eliminates the flow of air from inside to outside through the envelope and vice
versa. Air leakage control is a more complex objective, which must be considered as a separate and distinct function for any wall, roof or window, especially the joint details. The vapour and air barriers may or may not be the same material; if they are the same material, then it must meet all the requirements of air tightness control and of vapour diffusion control.
The above review of the existing studies on air intrusion through roofing assemblies together with the documentation in Molleti (2006) reveals the following.
No data exist related to the air intrusion permeability of a roofing assembly. Air retarders used in MAAs play a major role in providing resistance to wind uplift forces and improving the wind uplift performance.
A vapour retarder, if properly installed and adequately supported, can perform the dual functions of vapour and air control.
The studies asserted that the behaviour of a mechanically attached single-ply roofing membrane is affected by the air infiltration rate below the membrane in addition to the external pressure change that may occur.
REVIEW OF EXISTING STANDARDS FOR AIR LEAKAGE QUANTIFICATION Air intrusion through the roofing assembly, which is a crucial and intrinsic part of the overall building performance, has not drawn much attention compared to research concerning air intrusion quantification through walls and windows. As mentioned earlier, the roofing industry currently has no test procedure and acceptance criteria to estimate the porosity of a roofing assembly. This raises the question about the air tightness of a roofing assembly.
All the existing air intrusion test standards namely the ASTM E2178, ASTM E283, ASTM E1424 and ASTM E2357 focus on materials, walls and windows. Available air intrusion data from these component-specific standards are limited, with numerous discrepancies due to inadequate design provisions. The key limitations of these test standards are the lack of specifications for the test specimen size, installation
techniques and inadequate test pressure application. Also, the difference in roofing system response compared to a wall assembly makes these test methods inappropriate for roofing. For example, for an external wind suction of 1400 -Pa (30-psf), a wall
assembly might not undergo a major change in shape that could change its air intrusion performance. However, on a roof assembly this pressure can cause the membrane to balloon and pump air into the assembly (Figure 1).
The only existing ASTM standard related to roofing is the ASTM E1680. This test method, as shown in Figure 3, is a specialized adaptation of ASTM E283, and this is exclusively for quantifying air intrusion through metal panels. Therefore, this test method does not include any component of the roofing assembly, namely the substrate, barrier and insulation, as part of the test specimen. This is a key limitation. Similar to the other ASTM test protocols, this standard also specifies that the air intrusion rate shall be determined at a negative pressure of 75-Pa (1.5-psf). However, considering the roofing system performance, this negative pressure is not adequate for the panels to deflect. Unless the panels deflect, the overlapped portions of the panels (seams), which are the main source of air intrusion, would not respond to air intrusion. This raises the question about the justification of selecting 75-Pa (1.5-psf) as the pressure for air intrusion quantification.
A separate and distinct protocol is needed for quantifying air intrusion of roof assemblies as there currently are for wall and window assemblies. From the building envelope perspective, a wall is vertical and a flat roof is horizontal. Though both
separate the uncontrolled outdoor environment from the controlled indoor environment, construction methods are different and the environmental loads to which they are subjected are likewise different. Though the theory is the same for these testing
protocols, what is important is the test methodology or approach. For example, the use of the existing test method ASTM E283 to quantify air intrusion through a roofing
assembly may not be appropriate. As discussed, the ASTM E283 procedure is limited to mounting the test specimen vertically in the testing chamber. A low-slope roof has different junction, penetration and termination points, and it is very tedious and
cumbersome to mount a flat roof vertically incorporating all the attachment mechanisms. From a design point of view, a roof is divided into three zones: field, edge and corner. Air intrusion through a roofing assembly is not homogenous and depends on several factors. For example, air intrusion in the field zone of a roof might not be the same as at a corner due to the fact that the corner zone has numerous junctions and terminations and may be subjected to higher wind pressures compared to the field zone of the roof. AIR INTRUSION QUANTIFICATION OF ROOFING ASSEMBLIES: DEVELOPMENT OF A NEW TEST METHOD
To address the crucial task of assessing the degree of air intrusion through the roofing assemblies, an experimental study was carried out at the Dynamic Roofing Facility, located at the National Research Council of Canada. The study was intended to measure the air intrusion associated with the field of the roof and does not include leakage at the openings or perimeter of the roof. The experimental set-up assumed that
in a roofing assembly the continuous waterproof membrane is airtight and can be excluded from the investigation. Therefore, all the experimental mock-ups would be constructed up to the insulation level. This section presents the salient features of the newly developed test method. As shown in Figure 4, the test method includes the following components:
1. a test frame 2. U-channel 3. separator
4. impermeable cover
5. pressure measuring device 6. air flow measuring device 7. air system
8. data acquisition system 1. Test Frame
The test frame, as shown in Figure 4, has a dimension of 2 m x 6 m x 0.8 m (79 -in x 236--in x 32--in). The roof assembly (test specimen) is -installed -in the frame, which is supported on a lifting mechanism with adjustable jacks as shown in Figure 5, the cross-sectional view of the experimental set-up. This feature allows for investigating roof assemblies that incorporate different roofing components of varying size, thus providing for assemblies having different overall depths. 2. U-Channel
This test method is intended to measure the air intrusion associated with the field of the roof. To achieve this, the edge treatment of the test assembly was handled by installing steel U-channels along the perimeter of the test frame. The steel channels
are 1200-mm (48-in) in length, 100-mm (4-in) in width (equal to the thickness of the test frame) and have a depth of 100-mm (4-in).
3. Separator
For the simulation of the bubble pressure or test pressure difference across the assembly, a gap or space has to be created between the top impermeable cover and the test specimen. To simulate this gap, wooden bars 50-mm (2-in) thick were fastened in the form of a square mesh, as shown in Figure 4, and were laid on top of the test specimen, thus separating the impermeable cover and the test specimen. 4. Impermeable Cover
In a MAA, as shown in Figure 2, the bubble pressure below the lifted membrane sucks air into the assembly. To simulate this bubble pressure, an impermeable cover, such as a roofing membrane, is used as the top cover for the test specimen. 5. Pressure Measuring Device
The differential pressure across the test specimen is detected by using Setra
differential pressure transducers, which have a measuring range up to 10-kPa (200- psf). The Setra model has an accuracy of 0.14% of the full-scale reading.
6. Air Flow Measuring Device
Identification of the appropriate device is very essential for quantification of air intrusion and is dependent on the expected airflow rate of the test assembly. In the current study, with number of components of which the assembly is comprised, and the related number and type of joints and junctions in the assembly, various flow-measuring devices (i.e. venturimeter, pitot tube and laminar flow elements), were used to help determine the most useful devices for quantifying air intrusion. Finally,
based on the initial estimation, accuracy and application flexibility, the Merriam laminar flow elements having three flow ranges were selected:
• for assemblies with low air permeance barriers: 212 L/M (7.5 CFM); • for assemblies with high air permeance barriers: 1130 L/M (40 CFM); and • for assemblies with no barriers: 11300 L/M (400 CFM).
These were configured as the appropriate devices to measure the airflow. Merriam laminar flow elements are gas volume rate of flow differential producers operating on capillary flow principles. The accuracy of the laminar flow elements is 0.50% of the actual reading.
7. Air System
A controllable blower is used for the depressurization technique of creating differential pressure under the impermeable cover. As the air tightness of the different assembly configurations varies, rather than changing the frequency of the air system from one test assembly to the other, the air system was kept at a
constant frequency for all the test assemblies, while the different test pressure differences were simulated by using a control valve as shown in Figure 5.
8. Data Acquisition System The output of the airflow and pressure measuring devices is connected to the data acquisition system (DAS), which records and plots the respective data on a graphical user interface (GUI).
The relevant experimental quantities to be determined in the test method are the applied test pressure differences and the corresponding volumetric rate of airflow
across the assembly. To obtain these parameters, the test procedure applies the depressurization technique as follows.
• Differential pressure in the range of 480-Pa (10-psf) to 2880-Pa (60-psf) in increments of 480-Pa (10-psf) are applied across the assembly (i.e 480,960,1440,1920,2400,2880-Pa)
• At each applied target pressure, the applied pressure is allowed to stabilize for a minimum duration of 60 seconds.
• After the pressure stabilization, the airflow measurements are recorded for a minimum duration of 60 seconds.
These selected differential pressures are significantly higher when compared to existing wall test procedures. For example, no specific pressure level was identified for
representing the air intrusion rate similar to the case of wall assemblies at 75-Pa (1.5- psf). A recently developed wind design guide (Baskaran and Smith, 2005) provides a procedure for calculating the wind-induced design pressures on roof coverings. Such calculation procedures and practical input from the members of the ongoing consortium will be used to reach consensus about the pressure level at which air intrusion rates will be reported for the roof assemblies.
TEST ASSEMBLY INSTALLATION
The roof specimen configuration depends on the manufacturer or representing agency. However, to develop consistency a five-step installation procedure is generalized as follows.
1. Deck Installation
To simulate the field zone of the roof, assuring that the airflow occurs along the steel deck seams and not the deck edges, the edge treatment of the test assembly was
handled by installing steel U-channels along the perimeter of the test frame as shown in Figure 6. Figure 6 also shows the typical installation of the deck, with one full sheet of 914-mm (36-in) wide and two cut sheets of 610-mm (24-in) and 483-mm (19-in) wide steel decks installed along the length of the test frame. The steel deck layout should have a minimum of two seams as indicated by the black dotted lines. To eliminate the air intrusion along the edges of the deck, the steel deck edges were butted to the U-channel, and the gap between them was sealed using caulking and an adhesive membrane as shown in Figure 6.
2. Barrier Installation
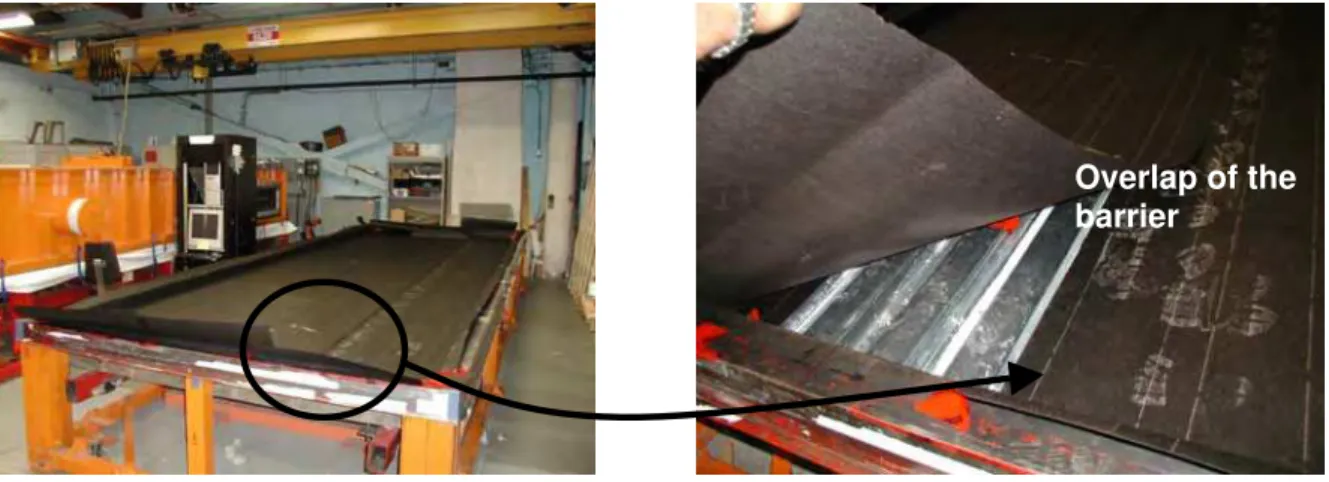
The barrier, if any is used in the test specimen, should be installed according to the manufacturer’s specifications. It could be installed either parallel or perpendicular to the steel deck. However, it should have a minimum of one seam overlap as shown in Figure 7, and the edge treatment of the barrier has to be done as per the
manufacturer’s specifications. 3. Insulation Installation
The installation of the insulation boards depends on the insulation dimensions, insulation layout arrangement and the fastener density of the insulation board. At present, in the roofing industry, insulation boards are available in the dimensions of 1000-mm x 1000-mm (48-in x 48-in) and 1000-mm x 2000-mm (48-in x 96-in), with thicknesses of 38-mm (1.5-in), 50-mm (2-in), 76-mm (3-in) and 100 mm (4-in). As shown in Figure 5, adjustable lever jacks support the test frame. This allows roof systems of various components and insulation thicknesses to be investigated. Following the norm of current roofing industry practice, the insulation boards should
be attached with a fastener density of a minimum of four fasteners per square metre of the board (Baskaran and Smith, 2005). However, it is the responsibility of the specifying agency to determine the insulation configuration. Figure 8, gives a typical example of 1000-mm x 2000-mm x 50-mm (48-in x 96-in x 2-in) insulation
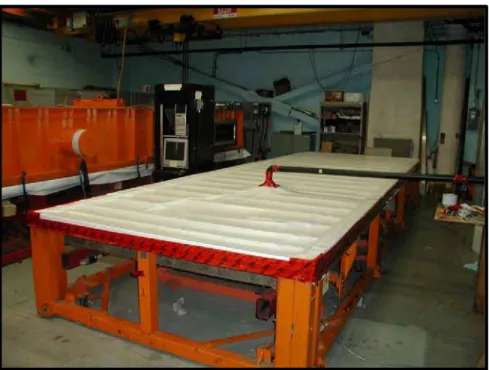
installation with a fastener density of eight fasteners per board. 4. Installation of the Separator
With the insulation in position and fastened to the deck, the square meshed wooden separator is installed on top of the insulation as shown in Figure 9. This provides the required gap or space between the test specimen and the impermeable cover. A minimum gap of 50-mm (2-in) should be maintained for the airflow to occur without any obstruction. To ensure that the impermeable cover does not stick to the test specimen during the applied suction pressures, necessary precautions should be taken in the design of the separator. After the completion of the separator
installation, two pressure taps are installed on either end of the test specimen (e.g. see Figure 4 ). These pressure taps measure the differential pressure across the test specimen.
5. Installation of the Impermeable Cover
A continuous sheet of impermeable flexible sheet membrane cover (as shown in Figure 10) is laid on top of the separator. The impermeable sheet should cover the entire test specimen and must have overhang of at least 150-mm (6-in) on all the four sides. The overhang edges of the impermeable cover are adhered to the frame edges, thus eliminating any extraneous airflow into the test specimen. Provisions are made to install the flow measurement set-up by making a 50-mm (2-in) diameter
opening on top of the impermeable cover. It is preferable to make this opening in the middle of the cover (i.e center of the test assembly), so that the applied differential pressure is uniform across the test assembly below the impermeable cover. One end of the flow measurement set-up has an air filter, which is inserted into the test specimen, and the other end is connected to the air system. In between, the flow-measuring device and the adjustable control valve are installed. The former measures the airflow rate and the latter controls the applied pressure.
CALIBRATION OF THE TEST METHOD
The present study aims to develop an experimental procedure for the air intrusion quantification of an assembly rather than a material. Therefore, the ongoing
experimental process has been calibrated by measuring the airflow rate through an assembly in which a predefined sharp edge orifice is made. Based on the theory of leakage through an opening under constant pressure, two assemblies were evaluated to validate the new experimental method.
Following the above described installation procedure, a continuous 6-mil
polyethylene sheet, which has non-measurable air flow (Bomberg and Kumaran,1985) , was installed between the steel deck and 50-mm (2-in) thick insulation boards. The insulation boards were laid loosely. All the necessary measures were followed for the edge treatment of the deck. The edges of the polyethylene sheet were sealed to the steel U-channels with adhesive tape, thus eliminating any airflow into the assembly through the edges. A sharp edge orifice of 6.5-mm (¼ -in) diameter was made across the assembly, namely, through the insulation, polyethylene sheet and steel deck. To
complete the procedure, the separator and impermeable cover were installed and the assembly was subjected to the test procedure as described above.
Two experiments were carried out. For the first experiment, the sharp edge orifice on the assembly was completely sealed. In the second experiment, the sharp edge orifice was kept open and the sealing was removed so there would be a constant flow when the assembly is subjected to a pressure difference. Both the tests were carried out in indoor laboratory conditions (air pressure 101 kPa, ambient temperature 21oC and assuming an air density of 1.202 kg/m3).
VERIFICATION OF APPLIED PRESSURE
Figure 11(a) shows the measured pressure time history data from Experiment 1. The average measurement time at each pressure level was around eight minutes. Apart from the measurement time, equally important is maintaining the target pressure at the required differential pressure. To verify whether the applied pressure equals the target pressure, one typical segment from the measured time history [Figure11(a)] at 1440-Pa (30-psf) was taken and error analysis were performed as shown in Figure 11(b). As also shown in Figure 11(b), the measured data at each pressure level can be divided into three parts.
Pressure Build-up
In this stage, the control valve is adjusted to alter the pressure from one level to the other. As shown in Figure 11(b), the peaks in the pressure measurement can be attributed to the manual operation of the control valve.
Pressure Stabilization
In this stage, the built-up pressure is allowed to stabilize until the fluctuations are dampened. The stabilization time depends on the air tightness of the assembly.
Pressure Measured
After the stabilization period, the applied pressure tends to equal the target pressure with minimum fluctuations, during which the pressure readings are measured for a minimum duration of 60 seconds.
Performing the error analysis between the target pressure 1440-Pa (30-psf),
represented by the dotted line in Figure 11(b), and the measured pressure, the data indicate that the measured pressure showed an estimated error of 0.2%.
A similar pressure verification procedure was followed for Experiment 2 as shown in figures 12(a) and 12(b), at a target pressure of 2870-Pa (60-psf). The data indicated that the measured pressure varied by 0.2% in comparison to the target pressure. Comparison of the testing time between the two experiments in figures 11(a) and 12(a) indicates that Experiment 2 took longer than Experiment 1. The average measurement time at each target pressure level of Experiment 2 was around 13 minutes. This
increase in the measurement time is due to the presence of the orifice, which meant more time was needed to reach the required target pressure.
CALIBRATION OF MEASURED FLOW
Figure 13 shows the measured flow time histories. The calibration of the flow measurement is accomplished by comparing the measured airflow rates with the theoretical airflow rates for an orifice of 6.5-mm (¼ - in) diameter. The relationship
between the airflow through an opening and the pressure difference across it is called the leakage function of the opening. One of the most commonly used expressions for the airflow rate through an opening is (ASHRAE, 1993):
ρ Δ =C A p/ Q D 2 (1) where Q = flow rate, m3/s
CD 0.611, the discharge coefficient for sharp edged orifice ≅ A = cross-sectional area of opening, m2
Δp = pressure difference across opening, Pa ρ = air density, kg/m3
Based on this equation, the airflow rate was computed for the 6.5-mm (¼ -in) orifice at pressure levels of 480 Pa (10-psf) to 2880-Pa (60-psf) in increments of 480-Pa (10-psf). The calculated flow rates were then compared with the experimental derived airflow rate, as shown in Figure 14. The measured airflow rate of the orifice represents the difference in airflow between experiments 1 and 2. For example, at a differential
pressure of 1440-Pa (30-psf), the airflow rate through the orifice is 1.23 L/s (0.043 ft3/s). This is obtained by subtracting the airflow from Experiment 1 (test specimen orifice sealed), which is 3.63 L/s (0.13 ft3/s), from the airflow of Experiment 2 (test specimen orifice opened), which is 4.86 L/s (0.17 ft3/s). The comparison in Figure 14 clearly indicates that the experimental values were higher than the theoretical values. Though the trend was observed between the theoretical and measured data at the lower
pressure levels, a deviation was evident at higher-pressure levels beyond 1410-Pa (30- psf). Considering the literature review of the leakage area approach, there is no
specified value for the discharge coefficient. The type of opening characterizes the
value of the discharge coefficient. Some users of the leakage area approach set the discharge coefficient equal to 1, while others set to 0.6 i.e the discharge coefficient for a sharp edged orifice (ASHRAE,1993).
To further verify the experimental data, computations were made assuming discharge coefficient values of Cd 0.8 and plotted as shown in Figure 14. The comparison clearly indicates that, with the assumption of Cd
≅
≅0.8, at lower pressures up to 1436- Pa (30- psf) the computed data correlates very well (in comparison with Cd 0.611) with the measured data, however, with increasing pressure a larger deviation was observed in the flow measurement data. This variation in the data sets can be attributed to the effect of two contributing factors, one being the volume change induced by the impermeable cover. Note that for the present experimental set-up no change in the volume and temperature is assumed at different pressure levels (P1V1 / T1 = P2V2 / T2). However, referring to Figure 10, during high pressures the impermeable cover
undergoes downward deformation thereby causing a reduction in the volume. The other contributing factor might be the dimensional tolerance for the orifice across the
assembly. Overall, Figure 14 provides a benchmark for the present test method with inherent limitations as discussed below.
≅
LIMITATION OF THE TEST METHOD
Though this newly developed test method provides a sound procedure for the air intrusion quantification of roofing assemblies, it has certain limitations. One key limitation is the fact that it does not consider the response of the assembly below the impermeable cover. In other words, when the test specimen is subjected to the negative differential pressure, the impermeable cover deflects downward and pushes the wooden
separator. The wooden separator, which is on top of the test specimen, compresses the test specimen thus preventing the specimen from deflecting. Therefore, the current experimental set-up does not account for the component deflections of the assembly, even though this may happen in the actual wind uplift of the roofing assembly. The other limitations are the warping of the impermeable cover at higher differential pressures as shown in Figure 10 and opening up the adhesive seal between the impermeable cover and the steel U-channel at higher differential pressures.
CONCLUSIONS
Mechanically attached assemblies represent the new generation of singly-ply roofing assemblies. In the design of a MAA, the rate of air intrusion into a space under a billowed membrane is a major factor that influences its performance in such areas as wind uplift resistance, energy consumption and moisture migration. In the literature, no
measurement of air infiltration to the space underneath a billowed membrane in the MAA is reported. There are no formal performance criteria, standard specifications or test methods to quantify air intrusion of a MAA. This paper presents a newly designed test method for the quantification of air intrusion through mechanically attached
assemblies. The test method is developed based on the depressurization technique and a new methodology, which allows for air intrusion quantification of the whole roof
assembly incorporating the different roofing components, joints and junctions. This test method is intended to measure the air intrusion associated within the field of the roof. Though the preliminary calibration of the test method provided a benchmark for the concept verification, when conducting the test at higher differential pressures, certain problems emerged. Currently, efforts are being made to address limitations of the test
method so a separate test procedure can be achieved for roofing assemblies installed at the roof field zone. Development of this test method is a starting point for
investigating the impact of air barrier systems in the roofing assembly performance under certain external effects, such as wind.
ACKNOWLEDGMENTS
The presented research is being carried out for a consortium, the Special Interest Group for Dynamic Evaluation of Roofing Systems (SIGDERS) formed from a group of
partners interested in roofing design. These partners included:
Manufacturers Atlas Roofing Corporation, Canadian General Tower Ltd., Carlisle Syn Tec., GAF Materials Corporation, GenFlex Roofing Systems, Firestone Building Products Co., IKO Industries Ltd., ITW Buildex, Johns Manville, Sika-Sarnafil Roofing, Soprema Canada, Stevens Roofing, Tremco and Trufast.
Building Owners Canada Post Corporation, Department of National Defence, Public Works and Government Services Canada.
Industry Associations Canadian Roofing Contractors' Association, Canadian Sheet Steel Building Institute, National Roofing Contractors’
Association and Roof Consultants Institute (RCI,Inc.). REFERENCES
ASHRAE (American Society of Heating, Refrigerating and Air-Conditioning Engineers). 1993. ASHRAE HANDBOOK: Fundamentals.
ASTM, Standard E-1424-91a,”Standard Test Method for Determining Rate of Air
Leakage through Exterior Windows, Curtain Walls, and Doors Under Specified Pressure and Temperature Differences Across the Specimen”, ASTM International, West
Conshohocken, PA.
ASTM, Standard E-283-91, “Standard Test Method for Determining Rate of Air Leakage through Exterior Windows, Curtain Walls, and Doors Under Specified Pressure
Differences Across the Specimen” ASTM International, West Conshohocken, PA. ASTM, Standard E1680–95, “Standard Test Method for Rate of Air Leakage through Exterior Metal Roof Panel Systems”, ASTM International, West Conshohocken, PA. ASTM, Standard E2178-2003,”Standard Test Method for Air Permeance of Building Materials”, ASTM International, West Conshohocken, PA.
ASTM, Standard E2357-2005, “Standard Test Method for Determining Air Leakage of Air Barrier Assemblies” ASTM International, West Conshohocken, PA.
Baskaran, A. and T.L. Smith. 2005. A Guide for the Wind Design of Mechanically Attached Flexible Membrane Roofs. National Research Council of Canada, Ottawa, Ontario, Canada, K1A 0R6.
Baskaran, A., S. Molleti and R.J. Booth. 2006. “Understanding Air Barriers in
Mechanically Attached Low Slope Roofing Assemblies for Wind Uplift.” Proceedings of the 3rd International Building Physics/Science Conference, Montreal, August.
Baskaran, B.A., R.M. Paroli and R.J. Booth. 1997. “Wind Performance Evaluation Procedures for Roofing Systems Current Status and Future Trends.” Pp. 37-52 in Fifth International Conference on Building Envelope Systems and Technology, BATH, U.K.
Bomberg, M. and Kumaran,M.K.,1985. “A Test Method to Determine Air Flow
Resistance of Exterior Membranes and Sheathing”. Building Research Note No. 227, National Research Council, Ottawa, April.
Dregger, P.D. 1991. “Role of Air Retarders Deserves Closer Scrutiny.” Professional Roofing, National Roofing Contractors Association, pp. 46-49.
Lux, M.E., Brown,W.C.,1986. “Air Leakage Control” Proceedings of Building Science Insight “An Air Barrier for the Building Envelope", National Research Council of Canada.
Molleti, S. 2006. “Performance Evaluation of Mechanically Attached Roofing Systems.” Ph.D. thesis, University of Ottawa, Ottawa, Canada.
National Roofing Contractors Association (2004), “Hurricane Charley: A Preliminary Report”, Professional Roofing Magazine, NRCA, October.
NRC (National Research Council). 2005. National Building Code of Canada, Part 5. Ottawa: National Research Council of Canada, Ottawa, Ontario, Canada, K1A 0R6. Quirouette, R.L. 1985. “The Difference between a Vapour Barrier and an Air Barrier.” Building Practice Note, Division of Building Research, National Research Council of Canada.
RICOWI, Inc. (Roofing Committee on Weather Issues Inc.). 2006. Hurricanes Charley and Ivan Wind Investigation Report. McDonough, Georgia: Roofing Committee on Weather Issues Inc.
Zarghamee, M.S. 1990. “Wind Effects on Single-Ply Roofing Systems.” Journal of Structural Engineering. 116(1) (January): 177-187.
Figure 1. Air intrusion into MAA
Fiber Board Joints
Steel Deck Joints
Figure 2 (a). Channel flow
Billowed Membrane Parapet
Path for Orifice Flow
Figure 2 (b). Orifice flow
Figure 2 (c). Diffuse flow
Figure 2. Air intrusion sources
Figure 3. General arrangement of air leakage apparatus (ASTM E1680–95)
Figure 4. Experimental set-up for determination of air flow resistance of MAA
Figure 5.Cross-sectional view of the test setup
U-channel installation along the test frame edges
Edge treatment of the steel deck along the test frame length
Steel deck installation in the test frame
Edge treatment of the steel deck along the test frame width
Figure 6. Deck installation and edge treatment
Overlap of the barrier
Figure 7. Barrier installation and overlap treatment
Figure 8. Insulation installation.
Figure 9. Installation of the separator
Figure 10. Installation of the impermeable cover on the test specimen
0 500 1000 1500 2000 2500 3000 3500 4000 4500 5000 Time,sec 0 10 20 30 40 50 60 70 Pr e s s u re ,p s f 1 psf = 47.88 Pa 10 psf 20 psf 30 psf 40 psf 50 psf 60 psf Experiment 1
Figure 11 (a). Measured pressure time history
0 50 100 150 200 250 300 350 400 29 29.1 29.2 29.3 29.4 29.5 29.6 29.7 29.8 29.9 30 30.1 30.2 30.3 30.4 30.5 30.6 30.7 30.8 30.9 31 Pressure Build-Up Pressure Stabilization Pressure Measured Pressure Build-Up Target Pressure = 30 psf
Figure 11 (b). Error analysis at a typical target pressure of 1440 Pa (30 psf) Figure 11. Pressure verification for Experiment 1
0 500 1000 1500 2000 2500 3000 3500 4000 4500 500 Time,sec 0 10 20 30 40 50 60 70 P res su re ,p s f 10 psf 20 psf 30 psf 40 psf 50 psf 60 psf Experiment 2 1 psf = 47.88 Pa
Figure 12 (a). Measured pressure time history
58 58.2 58.4 58.6 58.8 59 59.2 59.4 59.6 59.8 60 60.2 60.4 60.6 60.8 61
Figure 12 (b. Error analysis at a typical target pressure of 2870 Pa (60 psf) Figure 12. Pressure verification for Experiment 2
Pressure Build-Up Pressure Stabilization Pressure Measured Target Pressure = 60 psf 0 50 100 150 200 250 300 350 400 450 500 550 Page 38 of 40
0 0.5 1 1.5 2 2.5 3 3.5 4.5 5 5.5 6 6.5 7
Figure 13. Measured flow time histories
0 500 1000 1500 2000 2500 3000 3500 4000 4500 5000 Time,min Experiment 1 4 Fl o w , l /s 0 0.5 1 1.5 2 2.5 3 3.5 4 4.5 5 5.5 6 6.5 7 Experiment 2 F lo w , l/s 0 500 1000 1500 2000 2500 3000 3500 4000 4500 5000 Time,min Page 39 of 40
Figure 14.Comparison of the measure airflow rate data with the ASHRAE theoretical data of Cd =0.6 0 479 958 1437 1916 2395 2874 3353 Pressure, Pa 0 0.2 0.4 0.6 0.8 1 1.2 1.4 1.6 1.8 2 0 0.42 0.84 1.26 1.68 2.1 2.52 2.94 3.36 3.78 4.2 Fl o w , cf m 0 10 20 30 40 50 60 70 Pressure, psf F low , L/ s Cd= 0.8 Experiment Cd= 0.6 Page 40 of 40