HAL Id: hal-01279589
https://hal-centralesupelec.archives-ouvertes.fr/hal-01279589
Submitted on 13 Apr 2017HAL is a multi-disciplinary open access archive for the deposit and dissemination of sci-entific research documents, whether they are pub-lished or not. The documents may come from teaching and research institutions in France or abroad, or from public or private research centers.
L’archive ouverte pluridisciplinaire HAL, est destinée au dépôt et à la diffusion de documents scientifiques de niveau recherche, publiés ou non, émanant des établissements d’enseignement et de recherche français ou étrangers, des laboratoires publics ou privés.
Influence of particle size and shape properties on cake
resistance and compressibility during pressure filtration
D. Bourcier, J.P. Féraud, D. Colson, K. Mandrick, D. Ode, E. Brackx, F. Puel
To cite this version:
D. Bourcier, J.P. Féraud, D. Colson, K. Mandrick, D. Ode, et al.. Influence of particle size and shape properties on cake resistance and compressibility during pressure filtration. Chemical Engineering Science, Elsevier, 2016, 144, pp.176-187. �10.1016/j.ces.2016.01.023�. �hal-01279589�
1
o cite this article: D. BOURCIER , J.P. FERAUD, D. COLSON, K. MANDRICK, D. ODE, E. BRACKX, F.
PUEL, 2016 Influence of particle size and shape properties on cake resistance and compressibility during pressure filtration. Chemical Engineering Science 144, 176–187
http://dx.doi.org/10.1016/j.ces.2016.01.023
Influence of particle size and shape properties on cake resistance and
compressibility during pressure filtration.
D. Bourcier
(1)*, J.P. Féraud
(1), D.Colson
(2)K. Mandrick
(1), D. Ode
(1), E.Brackx
(3)F. Puel
(2)(4)(1) CEA, DEN, DTEC, SGCS, LGCI, BP 17171, 30207 Bagnols-sur-Cèze, France
(2) Université de Lyon F-69622, Lyon, France ; Université Lyon 1; Villeurbanne ; CNRS, UMR5007, Laboratoire
d'Automatique et de Génie des Procédés (LAGEP), CPE-Lyon, 43 bd du 11 Novembre 1918, 69100
Villeurbanne, France
(3) CEA , DEN, DTEC, SGCS, LMAC, BP 17171, 30207 Bagnols-sur-Cèze, France
(4) Laboratoire de Génie des Procédés et Matériaux, CentraleSupélec, Université Paris-Saclay, Grande Voie des
Vignes, 92295 Châtenay-Malabry, France
Corresponding author: damien.bourcier@cpe.fr
Keywords: Pressure filtration, cake resistance, Compressibility, Particle properties,
Experimental, Modelling
Abstract
The aim of this paper was to study cake filterability and compressibility as a function of the particle shape and particle size distribution (PSD). Different shapes and PSD of calcium carbonate and uranium oxalate particles covering the classical types encountered in industry (sphere, cube, needle and platelet) were obtained by precipitation. The size and shape factor distributions were measured using an image analysis system on SEM pictures. The cake filtration properties were measured in ideal monitored operating conditions, because of a miniaturized filtration cell set-up. The impact of the PSD
2
and the shape were quantitatively assessed. These two solid features have an impact on cake resistance and compressibility, but not in the same way. The PSD has the strongest effect on cake resistance and compressibility. The particle shape is a decisive parameter for cake compressibility when the shape is far from the sphere. Both parameters need to be considered when working on the development of a filtration operation. Here, a practical model built following the Darcy law coupled with a new correlation for compressibility factor assessment is proposed. It gave satisfactory estimates of cake filterability and compressibility for the four shapes studied.
1. Introduction
Solid-liquid separation technologies are needed in many industries: biotechnology, chemistry, oil and pharmaceutics, for instance. Their performance is strongly dependent on particle properties such as size distribution and shape. Solid-liquid separation involves the separation of a solid and a liquid phase from a slurry. Cake filtration performed at constant pressure is one of the most popular techniques, and is considered in this study.
At plant scale, the filtration operation is often very time consuming, since cake filterability is low, especially with small particles (< 100 µm) exhibiting quite a wide size distribution and/or asymmetrical shapes. Increasing the pressure in order to accelerate the process may be counterbalanced by an increase in cake compressibility. Determining filterability and compressibility is essential when the appropriate solid-liquid separation technologies need to be defined.
At laboratory scale, when a toxic, harmful solid material involved, as is especially the case for some active pharmaceutical ingredients or for nuclear fuel, filterability measurements are quite difficult and must be limited in number and volume. Being able to estimate solid cake behaviour when only a few solid physical properties are known may help to overcome such difficulties.
3
The influence of the conditions of the particle production on filterability has been described in several studies reported in the literature (e.g. Hakkinen 2009). Usually the crystallization conditions (temperature profile, supersaturation, and seeding procedure) were varied in order to generate different particle size distributions (PSD). A recent study by Beck and Andreassen (Beck and Andreassen 2012) went further, since the impact of different particle shapes on filterability was investigated. Nevertheless, only the cake resistance was examined, without considering other cake properties such as its compressibility. These interesting results are not sufficient to provide guidelines when designing a filtration set-up for industrial materials.
The objective of this work was twofold. First, an experimental study was performed in order to assess changes in filterability and compressibility compared to the shape factor and particle size distributions. The second objective was to develop a model of the filtration in question using the experimental data collected. Such a model was expected to be able to estimate cake filtration properties (i.e. cake resistance and compressibility) using particle physical features and cake properties, such as porosity. A correlation based on physical parameters is proposed for the compressibility coefficient. It will be presented in Part 6 of this paper.
A model system which is easy to synthesize and does not involve hazards, and which exhibits different shape and size distributions, was chosen. The Beck and Andreassen studies (Beck and Andreassen 2012) have shown that calcium carbonate could be used to meet this requirement, since its polymorphic solid forms are well known, easy to handle and have a wide range of shapes. The particles were generated in very soft conditions (from 10 to 90°C). Controlling the supersaturation and temperature levels coupled with the suitable choice of the chemical reagents involved in the precipitation enabled us to produce several sphere, cube, plate and needle shapes. Once the different shapes had been obtained, they were sent to a metallographic laboratory for SEM expertise. An imaging software analysed the pictures and provided the particle size and volume and a volume shape factor for each particle. Filterability tests were carried out at pressures ranging from 1 to 5 bar using
4
the mini-test set-up already developed and validated in a previous study (Feraud, Bourcier et al. 2013). These tests gave the cake specific resistance and compressibility for each shape. The relationships between the particle features and the cake filterability behaviours could then be obtained. Relying on these experimental observations, a model based on Darcy’s law was developed. Experimental and simulation results were compared, in order to assess the reliability of the modelling.
2. Materials, experimental setup and operating conditions
2.1. Model substance, raw materials
The model substance used here was calcium carbonate with an intrinsic relative density close to 2.7g.cm-3. The different polymorphic forms were obtained by precipitation in water (see next section)
by combining pure reagents (> 99%) supplied by Sigma Aldrich. The ethanol used was >95% pure and also supplied by Sigma-Aldrich. All runs were performed at a solid concentration of 30g.L-1.
2.2. Precipitation set-up and operating conditions
The operating conditions for the precipitation of four differently-shaped forms of calcium carbonate particles corresponding to three polymorphic forms in water solution are presented in Table 1.
5
Table 1: Precipitation conditions (from Beck and Andreassen (Beck and Andreassen 2012))
Run number First reagent Second reagent Third reagent Stirring rate T° Type of Addition Precipitation duration Shape / polymorphic form 1 Na2CO3, 0.2M CaCl2, 0.2M 300 rpm 10°C Instanta neously 22 h Cubic / calcite 2 Li2CO3, 0.2mol, 1.8L CaCl2, 1M, 0.1L LiCl, 6M, 0.1L 2000 rpm 45°C Instanta neously 64 h Platelet / calcite 3 K2CO3, 0.2M Ca(CH3COO)2 0.2L 2000 rpm 30°C Instanta neously 0.25 h Spherical / vaterite 4 Na2CO3, 0.2M CaCl2, 0.2M 500 rpm 90°C Progressi vely 120 mL/h 8.5 h Needle / aragonite
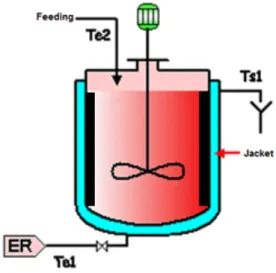
Precipitation was carried out in a 2 litre double-jacketed reactor (cylindrical vessel with an internal diameter of T= 0.15 m), as shown in Figure 1. The temperature of the medium measured using a Pt-100 probe was microcomputer-controlled by varying the heating bath temperature set point. Four equally-spaced stainless steel baffles were used in conjunction with a speed-controlled mechanical stirrer in order to avoid vortex formation. The stirrer was a four-blade Rushton turbine (diameter D = T/2) which ensured sufficient mixing of the reactants.
6
ER: Cooling water
Figure 1: Experimental batch precipitation vessel
Once the precipitation was complete, the suspension was quickly filtered on a Büchner. The cake was washed with ethanol and dried. The dry solid was stored in closed bottles before filtration.
An additional solid (Uranium Oxalate) was used to validate the methodology. They were precipitated from uranium nitrate and oxalic acid in a vortex reactor, as presented in (Bertrand, GRANDJEAN et al. 2013).
2.3. Filtration set-up and operating conditions
Cake resistance experiments were carried out with the mini-test cell which was fully described in Feraud and al (Feraud, Bourcier et al. 2013). This minitest allowed using small amount of slurry (about 100 mL). In this previous study, the authors have validated that the reduction of the cell diameter down to 1.8cm has no impact on the cake specific resistance measurement. The test cell diameter used was 1cm. The absence of wall effect on the filterability was again estimated for this smaller cell and is presented in section 5.1. The filterability test was based on experiments described by Roorda and van der Graaf (Roorda and van der Graaf 2005) and by Couturier, Valat et al. (Couturier, Valat et al. 2007). The slurry containing precipitated particles at 30 g/L was filtered at three different pressures in ethanol, a solvent which prevents particle redissolution.
7
2.4. Particle size distribution measurement
An in-house method for characterising precipitated particles coupled a scanning electronic microscope (SEM) for image recording and an image analysis software INCA future provided by Oxford Instruments for the determination of specific particle dimension and base area of a prism. This procedure is described in (Brackx et al. 2014). The dry particles were deposited on conductive pads before placing them in the SEM.
Several tens of grayscale SEM images were recorded by the software. The image processing started by a particle detection step in the image by thresholding the intensity of its gray level. Multiple levels of thresholds may be used to improve the efficiency of detection. Once the particles were detected, some image analysis procedure including erosion, dilatation were conducted to separate the particles one another. Only the separate particles were considered, since contiguous particles were rejected. Since a few thousands of particles were kept, the rejection of particles did not bring any segregation. For each separated particle, the software measured the maximum length of Féret and the minimum width of Féret. The operator indicated to the software a geometric model representative of the particle analyzed which appeared on the SEM image. This indication was made once, since all the particles belonging to the sample exhibited the same shape. Considering the geometric model and the minimum width of Féret, the base area of a prism of the particle Ap was calculated by the appropriate expression.
Here, several thousand particles were taken into consideration for shape and size analysis, which is far beyond the minimal requirement of about a few hundred (Mullin 2001). This gave the study consistent quantitative data.
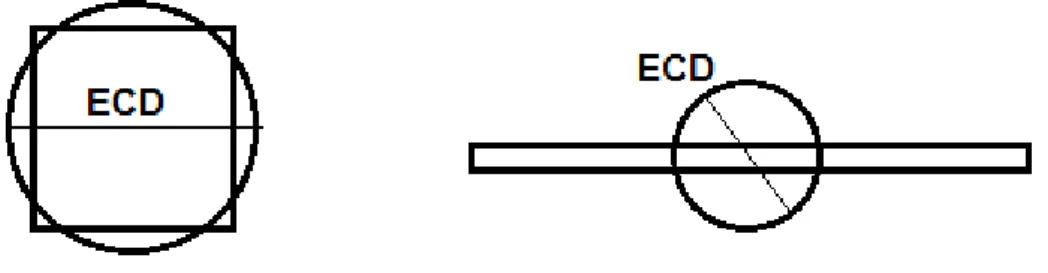
An equivalent circular diameter corresponding to the diameter of the circle having the same base area of a prism of the particle is calculated by the expression (1):
8
𝐸𝐸𝐸𝐸𝐸𝐸 = �
4𝐴𝐴
𝜋𝜋
𝑝𝑝(1)
where Ap is the base area of a prism of the particle.
Figure 2: Definition of Equivalent Circular Diameter (ECD) for different particles. The Figure 2 shows the equivalent circle for a needle and a platelet.
The volume of the particle was obtained as the product of the maximum length of Féret and the base area of a prism. This calculation which has already been applied for spheres and cubes was extended for needles and plates, even though the orientation of the particles in the imaging plane would lead to a deviation. In the case of platelets, we don’t apply this procedure and we prefer to estimate on few images with the naked eye the mean particles thickness. This replaces the Féret diameter
in the calculation of the volume.
Since the volume and the ECD are known for a population of several thousands of particles, it is possible to calculate the volume particle size distribution of the particles and its main characteristics, as its mean size and its standard deviation. The variation coefficient was defined as the standard deviation to the mean size ratio.
Recently, the literature presents an estimation that serves to reconstruct the three-Dimensional
crystal shape from the two-Dimensional crystal projection (Borchert et al. (2014). Also, an alternative to
9
2.5. Volume shape factor determination
Many shape factors can be calculated: volume, surface area, circularity factor… The volume shape factor is particularly interesting for this study because of its simplicity and of its easy access by the software. A volume shape factor is defined as the ratio of the surface area of the sphere having the same volume as the particle to the apparent estimated surface area of the particle (Garside, Mersmann et al. 2002) as follows:
𝜑𝜑
𝑣𝑣=
𝜋𝜋𝑑𝑑
𝑣𝑣 2𝐴𝐴
(2)
with dv the diameter of a sphere having the same volume of the particle.
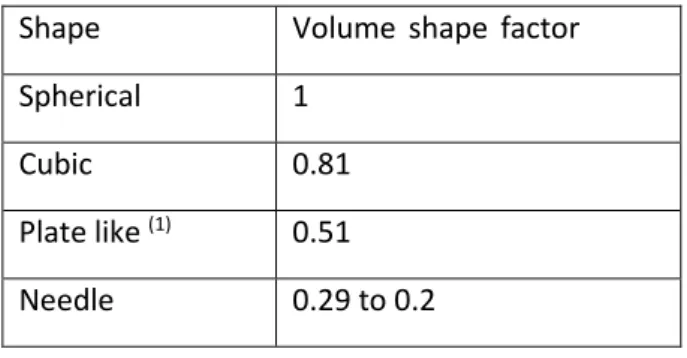
This factor allows a comparison between the real particle shape and an equivalent sphere. The table 2 exhibits few theoretical values of volume shape factor for known shapes (Allen 2003) (Table 2):
Table 2: Theoretical values of volume shape factors for known shapes Shape Volume shape factor
Spherical 1
Cubic 0.81
Plate like (1) 0.51
Needle 0.29 to 0.2
(1)
: Length = 10µm, Width = 1µm, Thickness = 0,77µm
(2):
𝐿𝐿𝐿𝐿𝐿𝐿𝐿𝐿𝐿𝐿ℎ10
Once the volume of the particle was obtained, the volume shape factor ϕv can be calculated as the
ratio of the area of the sphere having the same volume divided by the particle area.
A number distribution of volume shape factor was then calculated.
2.6. Porosity determination
For each shape, cake porosity was determined by a mass balance. The wet cake was weighed after draining, carried out using regulated compressed air. The cake was dried 24h at 80°C and weighed again. The difference between the two weights gave the amount of moisture. The volume of ethanol in the cake before and after deliquoring added to the volume recovered during draining gave the total volume of ethanol in the cake, thus giving the porous volume.
3. Theoretical considerations
3.1. Standard Filterability Laws
Considering the cake as a solid porous block (Wakeman and Vince 1984) traversed by circular capillaries of the same diameter, d, the pressure drop through a filtering media is given by Poiseuille’s equation: 2 32 U l P d µ ⋅ ⋅ ∆ = (3)
This law comes from the Navier-Stokes equation, with several assumptions: laminar and stationary flow, and a non-compressible Newtonian fluid.
The Kozeny-Carman model can determine the value of this resistance based on experimental data (Léger 2008). It considers the cake as incompressible, and consisting of spherical particles. The resistance value comes from an identification of Darcy’s law for filtration (Darcy 1856; Carman 1947):
11
𝑈𝑈
0=
−1𝜇𝜇𝜇𝜇𝑊𝑊𝑝𝑝𝑊𝑊𝑑𝑑 (4)Equation 3 is also known as the modified Darcy’s Law.
Combining Equations (3) and (4), and using the assumption of the Kozeny-Carman model (Carman 1937), the specific cake resistance "α" can be given by:
(5)
The parameter α is dependent only on particle and cake properties, which can be measured. The factor “180” was proposed by Leva considering the tortuosity and the external surface of the pores (see details in (Tiller, Yeh et al. 1987)).
This relation is typical of the solid properties. In a constant-pressure filtration process, Equation (5) leads to (Ergun and Orning 1949):
2 2 s T T t w R V V P P α µ µ = ⋅ + ⋅ ∆ Ω ∆ Ω (6)
Equation (6) is the basis of the entire filterability test. All the parameter values can be determined experimentally, and the specific cake resistance "α" can then be extracted. The pressure effect on filter cake can decrease porosity and thus drastically increase the cake resistance. This behaviour is given by many empirical equations describing the variation of α with pressure, such as the power law (see Equation 7)(Tarleton 2007):
𝛼𝛼 = 𝛼𝛼
0(
∆𝑃𝑃∆𝑃𝑃0)
𝐿𝐿 (7)The pressure ∆p0 is a reference pressure used to give a dimensionless pressure drop in
Equation (7). The relation (7) can be linearized by a logarithmic approach. In this way, the slope easily gives the compressibility coefficient, n, which is decisive information for the optimization of
12
3.2. Filtration modelling strategy
In pressure filtration, particle characteristics must be taken into account in order to model cake resistance and compressibility. The first models for compressible cake (Smiles 1970) (Philip 1968) built during filtration were based on the differential equations of continuity and momentum, through a Lagrangian approach. One of the major difficulties was to take into account the boundary condition at the cake-slurry interface. Atsumi and Akiyama (Atsumi and Akiyama 1975) and Tosun (Tosun 1986) worked on a moving boundary condition at the growing cake surface. Generally, interparticle interactions are ignored in these models.
More recently, Auzerais et al (Auzerais, Jackson et al. 1988), Buscall and White (Buscall and White 1987) and Landman et al (Landman, Sirakoff et al. 1991) used the particle network concept, closer to a sedimentation approach. This leads to the development of an empirical power law, with many empirical constants to determine.
Both approaches rely on measurements of the local solid compressive pressures to determine cake resistance and porosity, using a power law which can be written as:
𝛼𝛼 = 𝛼𝛼
0(𝑎𝑎
1+ 𝑏𝑏
1𝑝𝑝
𝑠𝑠)
𝐿𝐿1 (8)where α0, a1, b1, and n1 are empirical constants determined through experiments. The same power
law can be written for porosity.
The model presented in this study is based on the Kozeny-Carman model, since it is the simplest and its application is consistent with our assumptions. This model requires a porosity lower than 0.8 (Tiller 1953).
13
The modelling approach proposed here consists of two parts. The first enables calculation of the cake specific resistance of a polydisperse population of particles. This population could be considered as a sum of monodisperse populations, each having a specific resistance which could be calculated with the well-known Kozeny-Carman (Carman 1947) equation and the associated Léva (Ergun and Orning 1949) equation. In this study, the cake resistance was then obtained considering the different specific resistances and the relative importance of each particle population present in the whole cake (see section 3.4). The second part focuses on the estimation of cake compressibility. Knowing local particle interactions with pressure was not in our scope, since the goal was to obtain a practical modeling easily transferable to industry. Thus an empirical power law was developed taking into account the porosity and the extent of the particle size distribution compared to the average size. This data is relatively easy to obtain experimentally. The shape incidence on the compressibility was taken into account through the exponents of this law (see section 3.6).
The innovations in this modeling lie in the fact that the polydisperse feature of a particle population is taken into account, and that it gives a relation for compressibility based on a physical approach.
3.3. Filtration resistance modelling and cake formation calculation
The extent of the distribution was taken into account by a discretization of the probability density function. For each class of particle diameter dP, an associated specific resistance α0 was
calculated using the Léva equation (5).
(9)
The particle shape was taken into account via the volume shape factor ϕv (see definition insection 3.2.).
A resistance additivity hypothesis was proposed in order to take into account the specific resistance generated by each particle fraction of size dp in the total cake specific resistance α0. This
14
was made possible by considering the probability of the particle size fraction in the population volume density function. This value α0m represents a mean value on the cake. It was then used in the governing
equations of liquid flow in porous media. The value of the cake resistance was finally calculated with the classical equation (5) describing the effect of pressure drop on cake resistance.
𝛼𝛼
0𝑚𝑚= ∑ 𝑝𝑝�𝑑𝑑
𝑝𝑝�. 𝛼𝛼
0(𝑑𝑑
𝑝𝑝)
(10)
The calculation of the compressibility coefficient was possible through a power law based on physical considerations. The establishment of this power law is described in section 3.5.
The model also calculated the profiles with time of the filtrate volume, the liquid flow rate and the cake height by mass balance carried out on the solid with the following expressions:
𝑉𝑉(𝑡𝑡) = Ω([�
𝑅𝑅𝑠𝑠 𝜇𝜇.𝑤𝑤�
2+
2∆𝑃𝑃.𝐿𝐿𝜇𝜇𝜇𝜇𝑤𝑤]
0.5−
𝑅𝑅𝑠𝑠 𝜇𝜇𝑤𝑤)
(11)
𝑄𝑄
𝑙𝑙(𝑡𝑡) =
𝑑𝑑𝑑𝑑(𝑡𝑡)𝑑𝑑𝑡𝑡(12)
ℎ(𝑡𝑡) =
(1−𝜀𝜀)𝑉𝑉(𝐿𝐿).𝑤𝑤Ω𝜌𝜌 𝑆𝑆𝑑𝑑(13)
Finally, the model considers that the local porosity and the specific resistance are uniformly distributed in the cake volume.
3.4. Filter media resistance
The dimension of cake resistance is expressed in m.kg-1 whereas that of the filtering media
resistance is m-1. To compare them and to integrate the filtering media resistance in the model, the
two resistances must have the same dimension. The filtering media resistance can be compared to the cake resistance via the surface mass of the media (Tarleton 2007). This resistance is considered as the cake resistance at t=0.
15
𝛼𝛼(𝑡𝑡 = 0) = 𝛼𝛼
𝑚𝑚𝐿𝐿𝑊𝑊𝑊𝑊𝑚𝑚=
𝑚𝑚𝑅𝑅𝑠𝑠𝑠𝑠𝑠𝑠𝑠𝑠𝑠𝑠(14)
Possible filtering media clogging was ignored. For 10 µm REPS metallic media from Gantois, Rs
was set at 1010 m-1.
The parameter msurf represents the surface mass of the filtering media calculated as the ratio of the
filtering media mass and the filtering media surface.
3.5. Compressibility law
As part of the experimental plan, a preliminary study showed that three main parameters had an influence on the compressibility factor: cake porosity, mean particle size and the extent of the size distribution. These observations were in agreement with Tarleton (Tarleton 2007).
In order to define a practical compressibility model, a phenomenological law was built considering the effect of both the porosity and the particle size distribution. When taking into account the cake porosity, attention needs to be paid to two extreme conditions. When the porosity tends to 0, compressibility becomes negligible. On the contrary, when porosity is close to 1, the cake is fully compressible. This is why the first part of the law includes a ratio with the porosity ε and the dryness (1-ε). In order to consider the extent of the size distribution compared to the mean size, it was decided to consider the variation coefficient (VC), which is the ratio of the standard deviation to the mean size of the size distribution. The compressibility law is then defined as follows:
𝑛𝑛 = (
1−𝜀𝜀𝜀𝜀)
𝛽𝛽(𝑉𝑉𝐸𝐸)
𝛾𝛾(15)
It was not necessary to use a proportional coefficient in expression (15), since the compressibility law is built with two dimensionless ratios. This expression will be used later to characterize cake resistance evolution due to pressure drop. The exponents β and γ were determined for each particle shape (see section 5.2).
16
3.6. Simulation procedure
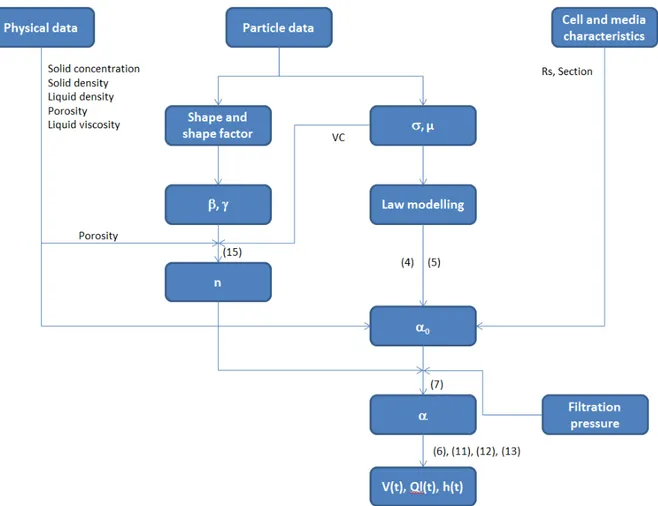
Figure 3 summarizes the working flowchart of the simulation:
Figure 3: Simulation flowchart
Three types of input data were needed to start the simulation: (i) from the particle size distribution measurement, it was possible to calculate the main properties of the distribution (mean diameter and standard deviation) and then obtain the equation for the volume population density function. A distribution law, not necessarily a normal-law, was fitted to the distribution and modelled. The Variation coefficient was needed in equation (15); (ii) the porosity of the cake was measured and the
17
viscosity of the filtrate was taken from literature. Porosity was used in equation (15) to determine the compressibility value; (iii) the cell diameter and the media specific resistance.
With all these parameters, equations (4) and (5) gave the specific cake resistance at 1 bar. The compressibility calculated with equation (15) combined with equation (7) led to the calculation of the cake resistance at every pressure drop. The use of equations (6), (11), (12),and (13) enabled the calculations and then profile plotting with time for the volume of filtrate collected, the liquid flow rate, and the cake height as a function of filtration time. These three profiles were also measured.
4. Characterization of synthetized particles
4.1. Spheres
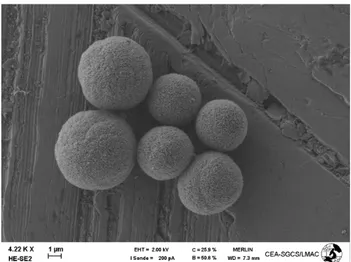
The particles precipitated from potassium carbonate and calcium acetate presented a spherical shape with considerable surface roughness, as shown in Fig. 4. The particles were not agglomerated and were well dispersed in the slurry.
Figure 4: SEM image of dried spherical particles
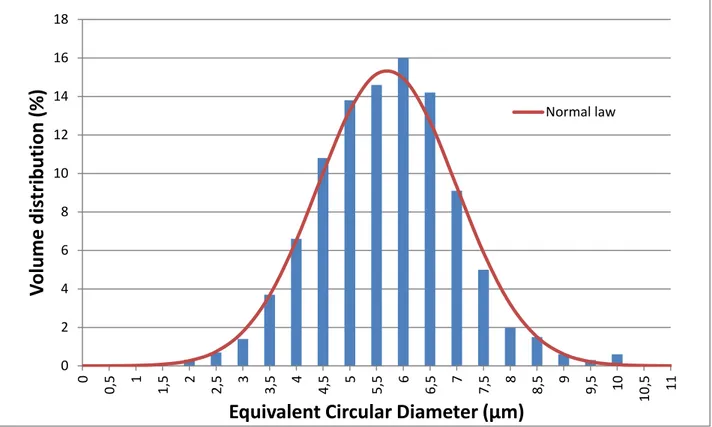
The ECD of the particles were in a narrow range from a few µm up to 10µm (see Fig. 5). The PSD fitting a normal distribution was centred on 5.7 µm, with a standard deviation of 1.3 µm.
18
Figure 5: Size volume distribution of precipitated spheres
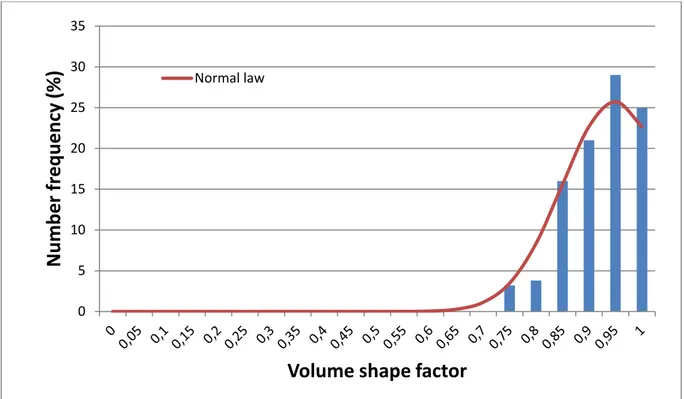
Figure 6 shows the volume shape factor number distribution of these particles. The distribution was centred on 0.92, with a standard deviation of 0.2 The experimental values are in good agreement with the theoretical value (1.0), meaning that the particles exhibited a fairly regular spherical shape. 0 2 4 6 8 10 12 14 16 18 0 0, 5 1 1, 5 2 2, 5 3 3, 5 4 4, 5 5 5, 5 6 6, 5 7 7, 5 8 8, 5 9 9, 5 10 10 ,5 11
Vo
lu
m
e d
ist
rib
ut
io
n
(%
)
Equivalent Circular Diameter (µm)
19
Figure 6: Volume shape factor number distribution of precipitated spheres
4.2. Cubes
The particles precipitated from sodium carbonate and calcium chloride had a cubic shape with irregular surfaces, as shown in Fig. 7. The ridge length was about 10µm. The particles were not agglomerated and were well dispersed in the slurry.
The ECD of the particles laid in the range from a few µm up to 15µm (see Fig. 8). The PSD fitting a Normal distribution was centred on 9.5µm, with a standard deviation of 1.6µm.
0 5 10 15 20 25 30 35
Nu
m
be
r f
re
qu
en
cy
(%
)
Volume shape factor
Normal law
20
Figure 8: Size volume distribution of precipitated cubes
Figure 9 shows the volume shape factor number distribution of these particles. The distribution is centred on 0.80, with a standard deviation of 0.14. The experimental values are in good agreement with the theoretical value (0.81) meaning that the particles had a fairly regular cubic shape.
0 1 2 3 4 5 6 5 6 7 8 9 10 11 12 13
Vo
lu
m
e d
ist
rib
ut
io
n
(%
)
Equivalent Circular Diameter (µm)
21
Figure 9: Volume shape factor number distribution of precipitated cubes
4.3. Platelets
The platelets of calcium carbonate obtained were very thin, small and strongly agglomerated. Their characteristic length was about 3 µm. The particles were so thin that they could be broken by an ultrasonic bath if it were used to separate them.
Figure 10: SEM image of dried platelets
These particles were used to determine the β and γ coefficients, as the volume shape factor was not needed to calculate them. Nevertheless, the volume shape factor was needed to model the cake
0 5 10 15 20 25 30 35 40 0,2 0,25 0,3 0,35 0,4 0,45 0,5 0,55 0,6 0,65 0,7 0,75 0,8 0,85 0,9 0,95 1
Nu
m
be
r f
re
qu
en
cy
(%
)
22
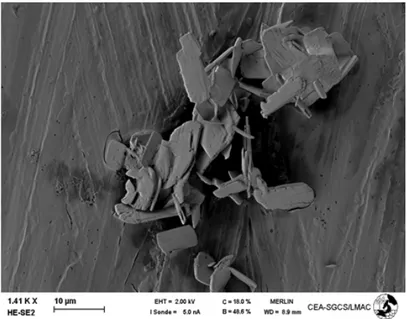
specific resistance and compressibility. The calcium carbonate particles were therefore replaced by uranium oxalate particles. They were precipitated from uranium nitrate and oxalic acid in a vortex reactor, as presented in (Bertrand, GRANDJEAN et al. 2013). These particles are shown in Figure 11:
Figure 11: SEM image of dried platelets of uranium oxalate
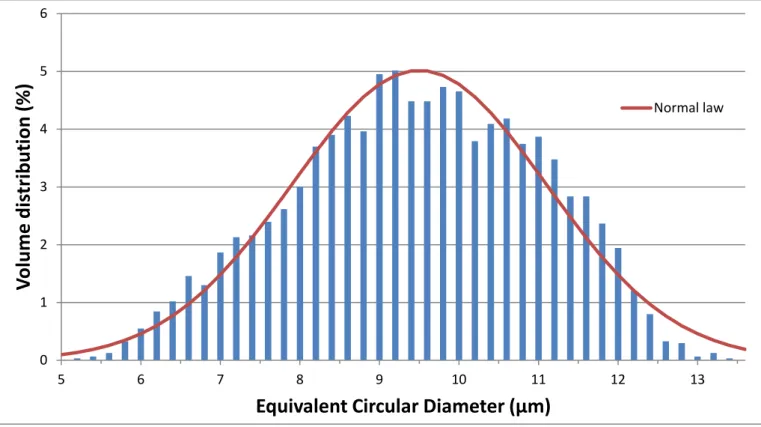
The ECD of the particles laid in the range from a few µm up to 15µm (see Fig. 12). The PSD fitting a log-normal distribution is centred on 14.5µm, with a standard deviation of 6.6µm. The distribution correctly fits a log-Normal law.
23
Figure 12: Size volume distribution of uranium oxalate
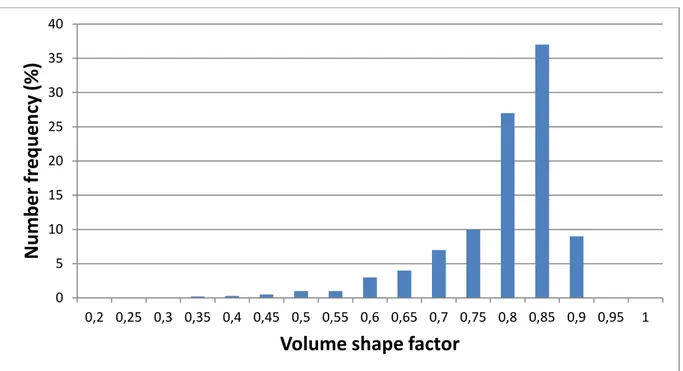
Figure 13 shows the volume shape factor number distribution of these particles. The distribution is centred on 0.43. The experimental values are in agreement with the theoretical value (0.51), meaning that the particles had a fairly regular platelet shape.
24
4.4. Needles
The needles precipitated from sodium carbonate and calcium chloride are presented in Figure 14.
Figure 14: SEM image of needles
The ECD of the particles was in a wider range from a few µm up to 40µm (see Fig. 15). The PSD fitting a log-normal distribution was centred on 17µm, with a standard deviation of 10µm.
Figure 15: Size Volume distribution of precipitated needles
0 5 10 15 20 25 5 14 23 32
Vo
lu
m
e d
ist
rib
ut
io
n
(%
)
Equivalent Circular Diameter (µm)
25
Figure 16 shows the volume shape factor number distribution of these particles. The average value is 0.17. Observation of the particles with the naked eye showed a ratio length/width =10 to 30, which corresponds to a theoretical value of 0.29. The experimental values were in the range of 0.04 to 0.24. The deviation comes from the utilization of the Equivalent Circular Diameter instead of a length to width ratio. Nevertheless, the experimental value of the volume shape factor measured exhibits a highly dissymmetric shape.
It should be noted that 0.17 is an expected value for needles.
Figure 16: Volume shape factor number distribution of precipitated needles To enable comparison, the particle characteristics are summarized in Table 3:
Table 3: Volume shape factor and PSD measurements of the precipitated particles (CC: Calcium Carbonate, UO: Uranium Oxalate)
Particle size distribution
0 5 10 15 20 25 30 35 40 45 50 0,04 0,09 0,14 0,19 0,24 0,29 0,34 0,39 0,44 0,49
Nu
m
be
r f
re
qu
en
cy
(%
)
26 Run number Shape Volume shape factor Average diameter (µm) Standard deviation (µm) Variation coefficient* Cake porosity 1 Cubic (CC) 0.8 9.5 1.6 0.17 0.72 2 Spherical (CC) 1 5.7 1.3 0.23 0.68
3 Platelets (CC) Not measured 3.2 0.5 0.15 0.71
4 Needles (CC) 0.17 17.6 10.0 0.57 0.78
5 Platelets (OU) 0.43 14.5 6.6 0.46 0.52
* defined as the standard deviation to the average diameter ratio
These compounds were used as standards or reference materials in the filterability test.
5. Implementation and assessment of the simulation
5.1. Validation of the absence of wall effects
A cell diameter of 1cm was used in the experiments. A comparison was made between cake specific resistance measured at 3bar from a 1cm-diameter cell and a 3-cm cell, and is presented in Table 4.
Table 4: Comparison of cake specific resistance measurements for two cell diameters, 1 and 3cm α (109 m.kg-1) Run d = 1 cm d = 3 cm 1 23.3 22.2 2 22.8 20.6 3 22.7 21.8 4 23.0 23.2
27
5 22.0 23.6
A statistical Student test showed that the mean values of specific cake resistance at 1 and 3 cm are not significantly different. The wall effect can be ignored for this 1cm-diameter cell.
5.2. Particle properties used for the model validation
The cubic, spherical and needle-like precipitated calcium carbonate particles were used to validate the model. As the plate-like particles of calcium carbonate were too agglomerated, they were replaced by Uranium oxalate particles which also exhibited a plate-like shape. Their main features were determined as described in Part 4, and are summarized in Table 3.
Particle physical properties, such as bulk density, were also measured to be integrated in the model:
Table 5: Physical properties of particles under atmospheric pressure used for validation (CC: Calcium Carbonate, UO: Uranium Oxalate)
Particles Dry cake bulk density (kg/m3)
Spheres (CC) 0.696
Cubes (CC) 0.488
Platelets (UO) 0.624
Needles (CC) 0.454
5.3. Calibration and determination of
β
and
γ
The exponents β and γ needed to be obtained for each shape. Two particle populations with similar shapes were obtained by performing two successive trials. Their particle size distribution features were measured. Filtrations with each population were carried out in order to measure the cake porosity and
28
compressibility. With this data, it was then possible to calculate the value of the exponents by solving the following system of two equations:
�
(
𝜀𝜀
11 − 𝜀𝜀
1)
𝛽𝛽. 𝑉𝑉𝐸𝐸
1𝛾𝛾= 𝑛𝑛
1(
1 − 𝜀𝜀
𝜀𝜀
2 2)
𝛽𝛽. 𝑉𝑉𝐸𝐸
2𝛾𝛾= 𝑛𝑛
2(16)
The resolution of the system led to:
⎩
⎪
⎨
⎪
⎧𝛾𝛾 = [(ln(𝜀𝜀
1) − ln(1 − 𝜀𝜀
1)). ln(𝑛𝑛
2)] − [(ln(𝜀𝜀
2) − ln(1 − 𝜀𝜀
2)). ln(𝑛𝑛
1)]
[(ln(𝜀𝜀
1) − ln(1 − 𝜀𝜀
1)). ln(𝑉𝑉𝐸𝐸
2)] − [(ln(𝜀𝜀
2) − ln(1 − 𝜀𝜀
2)). ln(𝑉𝑉𝐸𝐸
1)]
𝛽𝛽 =
ln(𝜀𝜀
ln(𝑛𝑛
1) − 𝛾𝛾ln (𝑉𝑉𝐸𝐸
1)
1) − ln(1 − 𝜀𝜀
1)
(17 ) The logarithmic derivation of Equation 17 gives the uncertainty. The calculation shows that the uncertainty on the β and γ coefficients is respectively 0.15 and 0.25. The table 6 summarizes the constants calculated for the four shapes studied.Table 6: Calculated values of the exponents β and γ of the compressibility law for each shape (the subscripts 1 and 2 are the two experiments used for the determination).
Particles n1 ε1 σ1 dp1 VC1 n2 ε2 σ2 dp2 VC2 β γ
Spheres (CC) 0.4 0.67 1.36 5.97 0.23 0.38 0.7 1.17 5.8 0.2 0.29 0.76 Cubes (CC) 0.47 0.72 1.57 9.57 0.16 0.48 0.67 2.05 10.72 0.19 0.41 0.62 Platelet (CC) 0.41 0.71 0.47 3.15 0.15 0.36 0.66 0.40 3.05 0.13 0.21 0.57 Needle (CC) 0.92 0.78 5.76 17.6 0.33 0.90 0.77 5.91 18.1 0.33 0.48 0.62
29
5.4. Assessment of the resistance additivity hypothesis
To validate the additivity hypothesis, experiments were carried out using calibrated spheres of PMMA dispersed in ethanol. Two monodisperse distributions centered on 20µm and 50µm were used. Three other distributions were obtained by mixing the two previous ones, in different ratios 25%/75%, 50%/50% and 75/25% wt of the content respectively. The standard deviation for the mixture was calculated as follows:
𝜎𝜎𝑚𝑚 = �𝜎𝜎12+ 𝜎𝜎22 (18)
with σ1 and σ2 being the standard deviations of the 20µm and 50µm monodispersed distributions The
porosity and the filter cake bulk density were measured for each experiment. Table 7 presents the main features of the five particle populations considered, and of their cake and filtrate.
Table 7: Experimental filtration conditions for calibrated spheres
Distribution 1 Distribution 2 Distribution 3 Distribution 4 Distribution 5 Mean diameter 20 µm 50 µm A 50/50 w/w mixture of the distributions 1 and 2 A 25/75 w/w mixture of the distributions 1 and 2 A 75/25 w/w mixture of the distributions 1 and 2 Standard deviation of the distribution 0.2774 µm 0.786 µm 0.833 µm 0.833 µm 0.833 µm Cake Porosity 0.43 0.43 0.35 0.38 0.31 Filtrate Viscosity 1.2 mPa.s Filtrate density 0.789 g.cm-3
30 Cake density ρSapp 0.658 g.cm-3 0.658 g.cm-3 0.748 g.cm-3 0.715 g.cm-3 0.794 g.cm-3 Filtering media area Ω 0.785 cm² Filtering media resistance 10 10 m-1
Pressure drop 1, 3 and 5 bar
Table 8 summarizes the experimental and calculated cake specific resistance and compressibility for the three particle distributions. A relative deviation between the experimental and calculated values is also reported.
Table 8: Experimental and calculated cake specific resistance for the five particle distributions Experiment Modelling Relative deviation
Distribution 1 ∆P = 1 bar 5.7 109m.kg-1 5.6 109m.kg-1 3.1 % ∆P = 3 bar 8.1 109m.kg-1 8.0 109m.kg-1 0.4 % ∆P = 5 bar 10.0 109m.kg-1 9.5 109m.kg-1 4.0 % Compressibility 0.34 0.33 2.9 % Distribution 2 ∆P = 1 bar 0.8 109m.kg-1 0.8 109m.kg-1 0.0 % ∆P = 3 bar 1.3 109m.kg-1 1.2 109m.kg-1 3.9 % ∆P = 5 bar 1.4 109m.kg-1 1.5 109m.kg-1 2.1 % Compressibility 0.38 0.37 2.6 % Distribution 3 ∆P = 1 bar 3.2 109m.kg-1 3.1 109m.kg-1 0.6 % ∆P = 3 bar 5.6 109m.kg-1 5.6 109m.kg-1 0.0 % ∆P = 5 bar 7.1 109m.kg-1 6.8 109m.kg-1 4.2 % Compressibility 0.50 0.48 4.0 % ∆P = 1 bar 1.5 109m.kg-1 1.6 109m.kg-1 6.2 % ∆P = 3 bar 2.9 109m.kg-1 3.1 109m.kg-1 6.4 %
31 Distribution 4 ∆P = 5 bar 4.1 109m.kg-1 4.2 109m.kg-1 2.4 % Compressibility 0.62 0.61 1.6 % Distribution 5 ∆P = 1 bar 3.9 109m.kg-1 3.9 109m.kg-1 0.0 % ∆P = 3 bar 6.3 109m.kg-1 6.0 109m.kg-1 5.0 % ∆P = 5 bar 7.7 109m.kg-1 7.5 109m.kg-1 2.6 % Compressibility 0.42 0.43 2.3 %
The experimental and calculated values were close, with a relative deviation of up to 4.2 6.4 %, whatever the cake feature considered (specific resistance or compressibility). The relative precision was also maintained with the distributions 3, 4 and 5, even though these were bimodal. However, we did not have the opportunity to test this additivity hypothesis with particles exhibiting shapes other than spheres.
6. Results and discussion
6.1. Compressibility and cake resistance measurements
Figure 17 (see values in Table 9) presents the evolution of the cake specific resistance with the filtration pressure for the four samples. It appears quite clearly that the smaller the particles were in size, the higher the cake specific resistance. It could be emphasized that the shape also influences the specific resistance, since spheres showed a lower resistance than platelets, for quite similar sizes. It was seen that the higher the volume shape factor, the lower the resistance. From these observations, the first order parameter impacting cake resistance is nevertheless the size, while the shape factor acts as a parameter of secondary importance. The effect of the shape factor on the cake resistance value has already been noted by Beck and Andreassen (Beck and Andreassen 2012), but without considering the particle size more specifically.
32
Figure 17: Cake specific resistance and compressibility factor values depending on the pressure and the particle shape
Figure 17 shows that the compressibility factor, i.e. the slope of each curve, was almost the same for the spheres, cubes and platelets. On the contrary, the needle particle cake exhibited a much higher compressibility factor, even though the average particle diameter was quite close to those of the other populations of spheres, cubes and platelets. It is also interesting to note that the cake porosity was not really affected by the pressure rise. Two physical considerations can be discussed. First, it is assumed that the needles may reorganise in each cake layer, thus leading to a decrease in the mean pore size without affecting the total porosity. Second, a population of particles with an extended size distribution probably leads to a cake made up of uneven layers containing different-sized particles. The smallest particles may move from one layer to another, especially as the filtration pressure increases. Consequently the liquors may have to flow through more twisted paths. A relationship between the compressibility factor and the coefficient of variation could be supposed. To our knowledge, this is the first time that such a relationship between the compressibility factor and the size variation coefficient is reported in a quantitative way. Nevertheless, the impact of the volume shape factor on the
33
compressibility factor remains lower than that induced by the particle size distribution variation coefficient.
The quantity of filtrate collected is highly dependent on the cake specific resistance and on the pressure applied. Figure 18 shows the profile with time of the filtrate volume collected as a function of the particle shape at a pressure of 3 bar.
Figure 18: Evolution of the filtrate volume collected as a function of time and shape at a pressure of 3 bar
It shows that the higher the cake specific resistance, the longer the filtration at the same pressure is. Filtration velocities of platelets and needles are significantly different. To explain this difference, two parameters can be highlighted in accordance with Léva’s equation: mean particle diameter and porosity. The cubes had a higher diameter than the spheres leading to a faster filtration. Needles
0 10 20 30 40 50 60 70 ,0 10,0 20,0 30,0 40,0 50,0 60,0 70,0
Vo
lum
e
co
llect
ed (
m
L)
Time (s)
Spheres 3bar Needles 3 bar Cubes 3bar Platelets 3bar34
exhibited a very porous cake and a larger mean diameter compared to other shapes. This explains that the quickest filtration was obtained with this shape. The figure 19 shows the evolution of the filtrate volume collected as a function of time and pressure for the spheres.
Figure 19: Evolution of the filtrate volume profile with pressure drop for the spherical particles The filtration time t is the total time necessary to obtain the whole filtrate volume (in this study, about 60g). A filtration time factor was defined as the ratio of t1 on t2, t1 and t2 being the times measured
when the filtrations were carried out at filtration pressures P1 and P2 respectively. The filtration time
decreased with the filtration pressure applied. The filtration time factor was reduced by 2.5 between 1 and 3 bars, and by 1.2 between 3 and 5 bars. The time reduction is lower at higher pressure, meaning that the effect of the pressure drop was attenuated by the increase in the cake specific resistance. Nevertheless between 1 and 5 bars, a quicker filtration was obtained for the spheres at the highest pressure drop. 0 10 20 30 40 50 60 70 80 90 ,0 20,0 40,0 60,0 80,0 100,0
Vo
lum
e
co
llect
ed (
m
L)
Time (s)
Spheres 1 bar Spheres 3 bar Spheres 5 bar35
Figure 20: Time profile of the filtration volume collected as a function of shape and pressure drop The previous statement can be repeated: the filtration time is linked to the cake specific resistance. The value of the cake specific resistance is governed by the particle size, the shape factor and the compressibility. If the compressibility is very high, an increase in the pressure can lead to a higher filtration time, due to a considerable increase in the resistance.
6.2. Comparison between experiments and the model
The suspensions tested are presented in Part 4. Table 9 reports the experimental and calculated cake specific resistance and compressibility, and their relative deviation.
0 10 20 30 40 50 60 70 ,0 5,0 10,0 15,0 20,0 25,0 30,0 35,0 40,0
Vo
lum
e
co
llect
ed (
m
L)
Time (s)
Cubes 1 bar Cubes 3 bar Cubes 5 bar Needles 1 bar Needles 3 bar Needles 5 bar Platelets 1 bar Platelets 3 bar Platelets 5 bar36
Table 9: Cake resistance comparison between experiments and model (particles of calcium carbonate (CC) and uranium oxalate (UO))
Particles Experiment Modelling Relative
deviation Spheres (CC) ∆P = 1 bar 11.5 109m.kg-1 11.2 109m.kg-1 2.6 % ∆P = 3 bar 17.4 109m.kg-1 18.4 109m.kg-1 5.4 % ∆P = 5 bar 22.1 109m.kg-1 21.7 109m.kg-1 1.8 % Compressibility 0.40 0.42 5.0 % Cubes (CC) ∆P = 1 bar 2.7 109m.kg-1 2.8 109m.kg-1 5.6 % ∆P = 3 bar 4.6 109m.kg-1 4.7 109m.kg-1 2.5 % ∆P = 5 bar 5.8 109m.kg-1 5.9 109m.kg-1 1.4 % Compressibility 0.47 0.45 4.3 % Needles (CC) ∆P = 1 bar 1.4 109m.kg-1 1.4 109m.kg-1 0.0 % ∆P = 3 bar 3.8 109m.kg-1 3.9 109m.kg-1 3.3 % ∆P = 5 bar 6.4 109m.kg-1 6.3 109m.kg-1 2.2 % Compressibility 0.93 0.92 1.1 % Platelets (UO) ∆P = 1 bar 19.1 109m.kg-1 19.3 109m.kg-1 1.0 % ∆P = 3 bar 39.2 109m.kg-1 40.8 109m.kg-1 3.9 % ∆P = 5 bar 59.4 109m.kg-1 57.8 109m.kg-1 2.7 % Compressibility 0.70 0.68 2.9 %
37
In Figure 21, the curves show a comparison between physical parameters. They compare the evolution of the experimental and modeled filtrate volume collected as a function of time for a cube suspension at 5 bar (ε measured = 0.7, w=30g.L-1).
Figure 21: Comparison between modelling and experiments for cubes at 5 bar
The modelled curve is within the uncertainty range for the experimental values with standard deviation, as determined by 3 repetitions. The model can therefore be considered as representative of the experimental phenomena. From an industrial point of view, filtration time is important because it may determine the entire process. This is one of the main interests of the model: it enables a filtration time estimate when only particle properties and the porosity of the cake are known.
0 5 10 15 20 25 30 0 5 10 15 20 25 30 V in mL t in s Vsimu Vexp Vmes+
Vmes-38
7. Conclusion
The controlled synthesis of different shapes for a same chemical product was used in order to establish relationships between particle characteristics (size and shape) and cake filtration behaviours (specific resistance and compressibility). Indeed, it allows to overcome the chemical composition of particles and to focus only on physical particle considerations. Calcium carbonate is a perfect model system, since the experiments can be carried out in a non-hazardous and repeatable way. The mini-test of filterability needing very small amounts of particles gave repeatable measurements whatever the particle shapes and size distributions.
Both PSD and shape have an impact on the cake resistance and compressibility. Their respective effects were clearly highlighted in a quantitative way. This study also showed that the parameter of primary importance impacting specific resistance and the compressibility factor is the particle size distribution (mean diameter and variation coefficient). The effect of the shape on the compressibility factor is significan when the shape factor is far from 1 (needles). This demonstrates that considering the mean particle diameter when a filtration operation has to be performed at plant scale is not enough. Both the entire PSD and the shape have to be considered in order to choose the best pressure drop conditions if seeking to reduce the filtration time. Mastering the PSD by controlling the operation of solid generations is often possible, but shape control is much trickier. This is why considering also the shape is a key point when a process with a filtration step needs to be developed.
Here the modelling is based on the classical filterability law, but also incorporates a new correlation for compressibility factor estimation. The cake construction and its behaviour under pressure were correctly calculated. The new correlation is based on porosity and PSD for a given shape, which are two relatively easily-measured features of the particle population and of the filtrated cake. Usually, the particle shape for a given separation is already experimentally known. Moreover, only two trials are necessary for the identification of the two parameters β and γ. This is particularly interesting when there is only a small amount of slurry, or when the materials to be handled are hazardous and highly
39
toxic. Such a model is also useful when needing to estimate the impact of modified solid features which may occur after process changes in the upstream operations prior to the filtration step.
References
Allen, T. R. (1997). Particle Size Measurement.
Allen, T. R. (2003). Powder Sampling and Particle Size determination
Atsumi, A. and H. Akiyama (1975). "A study of filtration : formulation as a Stefan problem." Journal of Chemical Engineering of Japan 8(6): 487-492
Auzerais, F. M., R. Jackson, et al. (1988). "The Resolution of Shocks and the Effects of Compressible Sediments in Transient Settling." Journal of Fluid Mechanics 195: 437-462.
Beck, R. and J. P. Andreassen (2012). "The influence of crystallization conditions on the onset of dendritic growth of calcium carbonate." Crystal Research and Technology 47(4): 404-408.
Bertrand, M., S. Grandjean, et al. (2013). Methods for preparing an actinide oxalate and for preparing an actinide compound, Google Patents, US 20110263837 A1.
Borchert et al. (2014), Image-Based in Situ Identification of Face Specific Crystal Growth Rates from Crystal Populations", Crystal Growth & Design, 2014, 14, 952-971
BRACKX, E., O. Dugne, et al. (2014). Method for characterising particles by image analysis, Google Patents WO 2014079849 A1
Buscall, R. and L. R. White (1987). "The Consolidation of Concentrated Suspensions .1. The Theory of Sedimentation." Journal of the Chemical Society-Faraday Transactions I 83: 873-891.
Carman, P. C. (1937). "Fluid flow through granular beds." Chemical Engineering Research & Design 75: S32-S48.
40
Couturier, S., M. Valat, et al. (2007). "Enhanced expression of filter cakes using a local thermal supply." Separation and Purification Technology 57(2): 321-328.
Darcy, H. (1856). "Les fontaines publiques de la ville de Dijon." Dalmont.
Ergun, S. and A. A. Orning (1949). "Fluid Flow through Randomly Packed Columns and Fluidized Beds." Industrial and Engineering Chemistry 41(6): 1179-1184.
Feraud, J. P., D. Bourcier, et al. (2013). "New filterability and compressibility test cell design for nuclear products." Nuclear Engineering and Design 265: 288-293.
Garside, J., A. Mersmann, et al. (2002). Measurement of crystal growth and nucleation rates : second edition.
Hakkinen, A. (2009). The influence of cryztallisation conditions one the filtrationcharacteristics of sulphathiazolesuspensions Lappeenranta University of Technologie.
Kempkes, M., Eggers, J., Mazzotti, M. (2010) Measurement of 3D particle size by spectroscopic imaging, Chemical Engineering Science 65, 1362-1373
Landman, K. A., C. Sirakoff, et al. (1991). "Dewatering of Flocculated Suspensions by Pressure Filtration." Physics of Fluids a-Fluid Dynamics 3(6): 1495-1509.
41
Léger, B. (2008). Etude de l'essorage en vue d'assister thermiquement le procédé, Université Bordeaux 1.
Mullin, J. W. (2001). Crystallization. 4th edition : Chapter 2 Physical and thermal properties.
Philip, J. R. (1968). "Diffusion by Continuous Movements." Physics of Fluids 11(1): 38-&.
Roorda, J. H. and J. H. M. van der Graaf (2005). "SUR test used for optimisation of membrane filtration plants treating wastewater effluents." Desalination 179(1-3): 131-150.
Smiles, D. E. (1970). "A Theory of Constant Pressure Filtration." Chemical Engineering Science 25(6): 985-&.
Tarleton, E. S. W., R.J. (2007). Solid-liquid separation : equipment selection and process design.
Tiller, F. M. (1953). "The Role of Porosity in Filtration - Numerical Methods for Constant Rate and Constant Pressure Filtration Based on Kozeny Law." Chemical Engineering Progress 49(9): 467-479.
Tiller, F. M., C. S. Yeh, et al. (1987). "Compressibility of Particulate Structures in Relation to
Thickening, Filtration, and Expression - a Review." Separation Science and Technology 22(2-3): 1037-1063.
Tosun, I. (1986). "Formulation of Cake Filtration." Chemical Engineering Science 41(10): 2563-2568.
Wakeman, R. J. and A. Vince (1984). Solid-Liquid Separation. London.
Symbols used
A: particle area (m²)
Ap : base area of a prism (m²)
42 dp: diameter of the equivalent sphere (m)
dv: diameter of the sphere of the same volume (m)
h: cake height (m)
k: local surface mass (kg.m-²)
l: capillary length (m)
msurf: surface mass of the filtering media (kg.m-2)
n: compressibility factor (-)
p: local pressure (Pa)
p(dp): Volume probability of the diameter in the distribution (-)
Ql: liquid flow (mL.s-1)
Rs: Filtering media resistance (m-1)
t: time (s)
U: fluid velocity (m.s-1)
U0: fluid velocity in non-porous media (m.s-1)
V: filtrate volume (m3)
Vmes+ : upper limit of the uncertainty domain for the filtrate volume (m3)
Vmes- : lower limit of the uncertainty domain for the filtrate volume (m3)
VC: Variation Coefficient (-)
43 α: cake specific resistance (m.kg-1)
α0: cake specific resistance reference at 1 bar
α0m: mean cake specific resistance
β: empirical coefficient (-)
γ: empirical coefficient (-)
ε: porosity (-)
ϕv: volume shape factor (-)
µ: viscosity (Pa.s)
∆P: pressure drop (Pa)
∆PT: total pressure drop (Pa)
ρSV: solid volume mass (kg.m-3)
σi: standard deviation of the distribution (m)
σm: merged standard deviation (m)