HAL Id: hal-00329304
https://hal.archives-ouvertes.fr/hal-00329304
Submitted on 2 Apr 2004
HAL is a multi-disciplinary open access
archive for the deposit and dissemination of
sci-entific research documents, whether they are
pub-lished or not. The documents may come from
teaching and research institutions in France or
abroad, or from public or private research centers.
L’archive ouverte pluridisciplinaire HAL, est
destinée au dépôt et à la diffusion de documents
scientifiques de niveau recherche, publiés ou non,
émanant des établissements d’enseignement et de
recherche français ou étrangers, des laboratoires
publics ou privés.
counterpart of a bursty bulk flow in the near-Earth
plasma sheet
A. Grocott, T. K. Yeoman, R. Nakamura, S. W. H. Cowley, H. U. Frey, H.
Rème, B. Klecker
To cite this version:
A. Grocott, T. K. Yeoman, R. Nakamura, S. W. H. Cowley, H. U. Frey, et al.. Multi-instrument
observations of the ionospheric counterpart of a bursty bulk flow in the near-Earth plasma sheet.
Annales Geophysicae, European Geosciences Union, 2004, 22 (4), pp.1061-1075. �hal-00329304�
Multi-instrument observations of the ionospheric counterpart of a
bursty bulk flow in the near-Earth plasma sheet
A. Grocott1, T. K. Yeoman1, R. Nakamura2, S. W. H. Cowley1, H. U. Frey3, H. R`eme4, and B. Klecker5
1Department of Physics and Astronomy, University of Leicester, Leicester LE1 7RH, UK
2Space Research Institute, Austrian Academy of Sciences, Schmiedlstr. 6, 8042 Graz, Austria
3Space Sciences Laboratory, University of California Berkeley, Berkeley, CA 94720, USA
4CESR/CNRS, 9 Avenue du Colonel Roche, B. P. 4346, F-31028 Toulouse Cedex 4, France
5MPI f¨ur Extraterrestrische Physik, Giessenbachstrasse, D-85748 Garching, Germany
Received: 21 March 2003 – Revised: 11 July 2003 – Accepted: 22 August 2003 – Published: 2 April 2004
Abstract. On 07 September 2001 the Cluster spacecraft ob-served a “bursty bulk flow” event in the near-Earth central plasma sheet. This paper presents a detailed study of the coincident ground-based observations and attempts to place them within a simple physical framework. The event in ques-tion occurs at ∼22:30 UT, some 10 min after a southward turning of the IMF. IMAGE and SAMNET magnetometer measurements of the ground magnetic field reveal perturba-tions of a few tens of nT and small amplitude Pi2 pulsaperturba-tions. CUTLASS radar observations of ionospheric plasma convec-tion show enhanced flows out of the polar cap near mid-night, accompanied by an elevated transpolar voltage. Op-tical data from the IMAGE satellite also show that there is a transient, localised ∼1 kR brightening in the UV aurora. These observations are consistent with the earthward trans-port of plasma in the tail, but also indicate the absence of a typical “large-scale” substorm current wedge. An analysis of the field-aligned current system implied by the radar mea-surements does suggest the existence of a small-scale current “wedgelet”, but one which lacks the global scale and high conductivities observed during substorm expansions. Key words. Ionosphere (auroral ionosphere; ionosphere-magnetosphere interactions; plasma convection)
1 Introduction
A major goal of solar-terrestrial physics is to improve the understanding of the nature of the coupled magnetosphere-ionosphere system. This is increasingly being achieved using simultaneous ground- and space-based observations which are becoming ever more available. On the dayside, space-craft observations of impulsive magnetopause reconnection, or flux transfer events (FTEs), have been linked to conse-quent flow and auroral features in the ionosphere (e.g. Lock-wood et al., 1989, 1993; Elphic et al., 1990; Pinnock et al., Correspondence to: A. Grocott
(ag27@ion.le.ac.uk)
1993, 1995; Moen et al., 1995; Provan et al., 1998; Neudegg et al., 1999, 2000; Milan et al., 2000). Correspondingly on the nightside, magnetospheric substorms have been studied to great depths in terms of their large-scale ramifications on the magnetic tail and nightside ionosphere (e.g. Russell and McPherron, 1973; Hones, 1979; Baker et al., 1996; Lui, 1996; Opgenoorth and Pellinen, 1998; Grocott et al., 2000, 2002). However, substorms are not the only mechanism by which the tail contributes to magnetosphere-ionosphere cou-pling. For example, Huang et al. (2001) reported observa-tions of quasi-sinusoidal nightside flow oscillaobserva-tions in Su-perDARN radar data during an extended interval of modest northward IMF, which were associated with the formation of large-scale clockwise flow vortices in the post-midnight sector. The authors associate these flows with global os-cillations of an essentially closed tail. Walker et al. (1998, 2002), on the other hand, have reported the occurrence
of latitudinally-restricted (∼1◦ north-south) bursts of
high-speed (∼2 km s−1) westward flow in the pre-midnight
sec-tor under similar interplanetary conditions (weak IMF with small clock angle). Walker et al. interpreted the bursts as be-ing due to sporadic energy release and field dipolarisation in the geomagnetic tail associated with a viscously-driven twin-vortex flow system. Recently, Grocott et al. (2003) have found intervals of northward IMF during which fast
(∼1000 m s−1) flow bursts lasting a few tens of minutes are
observed in the nightside ionosphere. These bursts were not accompanied by any classic substorm phenomena, such as auroral enhancements, particle injections or magnetic bays, yet were shown to be associated with field reconfiguration after reconnection in the tail.
One further class of phenomena, which have been ob-served during all phases of the substorm cycle, are narrow channels of fast flow in the central plasma sheet known as bursty bulk flows (BBFs) (Baumjohann et al., 1990; An-gelopoulos at al., 1992). These azimuthally-localised flows in the near-Earth plasma sheet have been associated with numerous counterpart signatures in the ionosphere. De la Beaujardi`ere et al. (1994) report the occurrence of bursts
of equatorward-directed flow in nightside Sondrestrom radar data, which take place during a “quiet-time” interval in which the transverse components of the IMF were small and di-rected mainly northward. These flow bursts were initiated near the nightside open-closed field line boundary, had
am-plitudes up to several 100 m s−1, and recurred at ∼1 h
in-tervals, lasting on each occasion for a few tens of minutes. Simultaneous auroral data show that each flow pulse was ac-companied by an activation of the poleward-most arc system, in which a new east-west aligned arc formed poleward of the existing boundary, and subsequently moved equatorward, to-gether with existing precipitation structures. This behaviour strongly suggests an origin in bursts of reconnection in the “quiet-time” tail. Poleward boundary auroral intensifications (PBIs) and arc “bifurcations” have subsequently been shown to occur commonly under a wide variety of conditions, both during “quiet” times, and in the growth, expansion and recov-ery phases of substorms (Lyons et al., 1999), often leading to the ejection of one or more north-south aligned auroral forms (called “auroral streamers”) towards lower latitudes (Hender-son et al., 1998).
Other examples of ionospheric flow excitation in connec-tion with BBFs have been reported, as well as associated rel-atively weak structured magnetic disturbances and Pi2 sig-nals. Sergeev et al. (1990) discussed STARE radar
obser-vations of fast (∼1000 m s−1) equatorward flows which
co-incided with ISEE-1 and -2 spacecraft measurements of en-hanced central plasma sheet earthward convection. These ob-servations occurred during periods of prolonged, steady con-vection without any apparent classic substorm activity. The observed features are, therefore, interpreted as the result of impulsive reconnection enhancements in the distant tail. In another study, Yeoman and L¨uhr (1997) interpreted pulses of ionospheric flow seen in the CUTLASS radars as signa-tures of ionospheric current vortices associated with pairs of field aligned currents. Yeoman et al. (1998) went on to relate these effects to transient features in Geotail field and plasma data which are suggested to be produced by BBFs. More re-cently, Kauristie et al. (2000) have conducted a superposed epoch analysis of Wind satellite plasma data and ionospheric conjugate magnetic field observations. This study provides evidence for an association between transient plasma sheet flows and vortex-like ground magnetic field variations.
A review of current understanding of these various related phenomena is given by Amm and Kauristie (2002). One ma-jor question they pose concerns the difference between sub-storm and non-subsub-storm events, and this will be discussed further below. They also point out, however, that many of the observed ionospheric effects can be shielded or greatly obscured during substorm expansions, by the inherent large-scale electrodynamics. In the present study, we investigate the ionospheric counterpart of a BBF which occurred dur-ing a substorm growth phase, thus largely circumventdur-ing any such effects. Excellent ground-based data are available for the event, which occurred on 7 September 2001, allowing flow, geomagnetic field, and auroral phenomena to be exam-ined. The Cluster spacecraft provide plasma and field data
in the near-Earth plasma sheet, with conjugate ionospheric observations being provided by the CUTLASS radars, the IMAGE and SAMNET magnetometers and the FUV auro-ral imager on the IMAGE spacecraft (see Sect. 2 for details of this instrumentation). During the event, ground magnetic activity was low (consistent with no substorm activity) with perturbations of magnitude ∼30 nT being typically observed. Nevertheless, significant ionospheric flow and auroral signa-tures were observed and these are considered below, along with a discussion of potential driving mechanisms and their implications for our understanding of substorm physics.
2 Instrumentation
As discussed above, this study combines simultaneous mea-surements from a number of sources to investigate the flow, magnetic, and auroral signatures associated with a BBF
event on 7 September 2001. Ionospheric convection
ve-locities are provided primarily by the Pykkvibær radar of the Cooperative UK Twin-Located Auroral Sounding Sys-tem (CUTLASS). CUTLASS forms part of the Super Dual Auroral Radar Network (SuperDARN), an international ar-ray of HF coherent radars spanning the auroral regions of both the Northern and Southern Hemispheres (Greenwald et al., 1995). Data from the entire northern hemisphere Super-DARN network, which consisted of eight radars during the interval being studied, is also used to provide a global so-lution to the ionospheric electric potential, and hence, the global convection pattern. This is achieved using the Map Potential Model (Ruohoniemi and Baker, 1998) which fits the line-of-sight SuperDARN data to an 8th order expan-sion (in this case) of the electrostatic potential in spherical harmonics. Information from the statistical model of Ruo-honiemi and Greenwald (1996), parameterised by IMF con-ditions, is used to stabilise the solution in regions where no measurements are available. During the study interval, all eight radars were operating in a standard mode, in which each radar scans through 16 beams of azimuthal separation
3.24◦, with a total scan time of 2 min. Each beam is divided
into 75 range gates of length 45 km, and so in each full scan
the radar covers 52◦in azimuth and over 3000 km in range,
an area of over 4×10⁶km2.
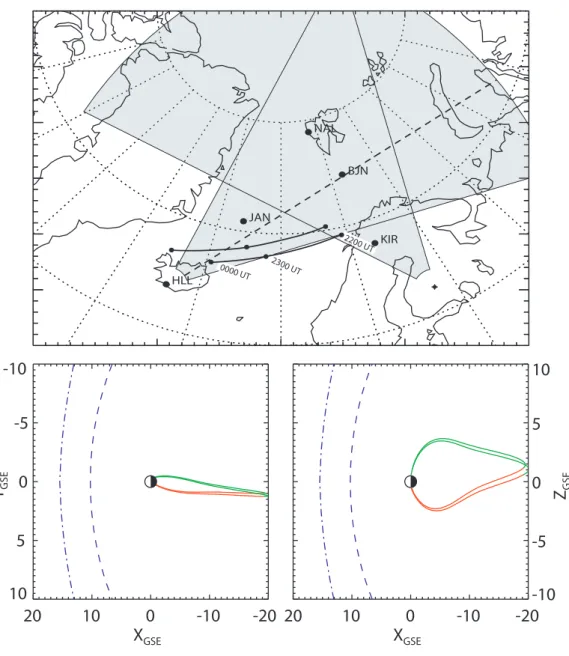
The fields-of-view of the CUTLASS radar pair are illus-trated in the top panel of Fig. 1, which shows a geographic
projection from the pole to ∼60◦ latitude and from −90◦
through to 90◦longitude. Beam 10 of the CUTLASS
Ice-land radar is indicated by the dashed line. Also shown on the figure are the locations of four magnetometers from the Inter-national Monitor for Auroral Geomagnetic Effects (IMAGE) array (L¨uhr et al., 1998) (JAN, BJN, NAL, and KIR), and one from the Sub-Auroral Magnetometer Network (SAMNET) (Yeoman et al., 1990) (HLL). The solid black curves on the figure represent the footprint of the Cluster (1) spacecraft be-tween 22:00 and 00:00 UT, mapped into the ionosphere us-ing the T-96 magnetic field model (Tsyganenko, 1995), with
BJN NAL KIR HLL JAN
20
10
0
-10
-20
X
GSE10
5
0
-5
-10
Y
GSE20
10
0
-10
-20
X
GSE-10
-5
0
5
10
Z
GSEFigure 1
0000 UT 2300 UT 2200 UTFig. 1. The fields-of-view of the CUTLASS radar pair shown on a geographic projection from the pole to ∼60◦latitude and from −90◦
through to 90◦longitude. Also indicated are the locations of four magnetometers from the IMAGE array (JAN, BJN, NAL, and KIR) and one
from the SAMNET array (HLL). The solid black curves represent the footprint of the Cluster (1) spacecraft between 22:00 and 00:00 UT,
mapped into the ionosphere using the T-96 magnetic field model with BZ=+2 (upper curve) and BZ=−5 (lower curve). The bottom two
panels show the Cluster field lines at 22:00 UT (upper field line in both panels) and 23:00 UT in the X−Y and X−Z GSE planes. Indicated by the dashed and dot-dashed curves are a nominal magnetopause and bow shock, respectively.
curves give an indication of the uncertainty in the mapped lo-cation of the Cluster footprint given the variation in IMF ori-entation over the interval (see below). The bottom two panels of Fig. 1 show the Cluster field lines at 22:00 UT (upper field line in both panels) and at 23:00 UT (lower field line) in the
X−Y and X−Z GSE planes. Indicated on these panels by
the dashed and dot-dashed curves is a nominal magnetopause and bow shock, respectively. At the time of the BBF event studied here, the Cluster spacecraft were located at
approxi-mately (X, Y, Z)GSE=(−20, 0, 0) RE(the spacecraft
separa-tion was of the order of ∼2000 km, discussed in more detail
below). The Composition and Distribution Function Ana-lyzer (CODIF) sensor of the Cluster Ion Spectrometry (CIS) instrument (R`eme et al., 2001) provides ion velocity data for the event, and magnetic data is provided by the fluxgate mag-netometer (FGM) (Balogh et al., 2001), presented here in GSM coordinates.
Data from two further spacecraft have been used in this
study. First, the Advanced Composition Explorer (ACE)
spacecraft (Stone et al., 1998), located upstream of the
Earth at GSM coordinates (X, Y, Z)=(230, −37, 11) RE,
Figure 2
22
0022
1022
2022
3022
4022
5023
00UT
-6
-4
-2
0
2
B
z(
n
T
)
-4
-2
0
2
4
B
x(
n
T
)
-4
-2
0
2
4
B
y(
n
T
)
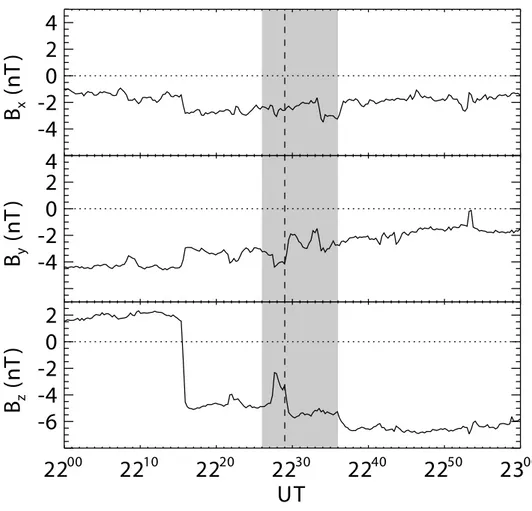
Fig. 2. Bx, By, and BzIMF data from the ACE spacecraft magnetometer instrument in GSM coordinates for the interval 22:00–23:00 UT,
lagged by 73 min to account for the propagation delay of field changes from ACE to the dayside ionosphere. The grey shaded portion represents the interval 22:26–22:36 UT corresponding to the interval of Cluster data show in Fig. 3. The vertical dashed line at 22:29 UT indicates the time of a BBF event identified in the Cluster data.
magnetometer (MAG) instrument (Smith et al., 1999) and solar wind data from the Solar Wind Electron Proton Al-pha Monitor (SWEPAM) instrument (McComas et al., 1998). Second, the Spectrographic Imager (SI) on board the Im-ager for Magnetopause-to-Aurora Global Exploration (IM-AGE) spacecraft (Mende et al., 2000a, b) provided images of the aurora during the interval. This instrument viewed the whole of the northern polar ionosphere during the course of the interval, and provided images approximately every 2 min. These consist of 5-s integrations of UV photons at a wave-length of 135.6 nm.
3 Observations
3.1 Upstream interplanetary magnetic field observations
Figure 2 presents data from the ACE spacecraft magne-tometer instrument in GSM coordinates for the interval 22:00–23:00 UT on 7 September 2001. It should be noted that the propagation delay of field changes from ACE to the dayside ionosphere, estimated following the method of
Khan and Cowley (1999) to be 73±2 min (using a value of
VSW∼367±10 km s−1), has been used to lag the data
dis-played here. The grey shaded portion of this figure repre-sents the interval 22:26–22:36 UT, corresponding to the in-terval of Cluster data shown in Fig. 3, discussed in the next section. The vertical dashed line at 22:29 UT indicates the time of a BBF event identified in the Cluster data. The top
panel shows the BXcomponent of the magnetic field, which
remained relatively steady between about −1 and −3 nT
dur-ing the entire interval. The middle panel shows the BY
com-ponent, which shows a fairly sudden increase from ∼ − 4 nT before the BBF to ∼−2 nT after. The bottom panel shows
the BZcomponent. This dropped suddenly from ∼+2 nT to
∼−5 nT at ∼22:16 UT, and then briefly increased to ∼−2 nT
at ∼22:27 UT, before dropping back down to ∼−6 nT at the time of the BBF where it remained for the rest of the interval. It is the change from a northward to a southward IMF orienta-tion that would eventually give rise to the equatorward shift in the mapped location of the Cluster footprint (mentioned above). However, the actual change in footprint location be-tween 22:16 UT and the time of the BBF just 10–15 min later
B
(n
T)
XFigure 3
-200
0
200
400
600
-20
0
20
-10
10
30
Z-200
0
200
400
600
22
2622
2822
3022
3222
3422
36UT
B
(n
T)
V
(k
m
s
-1)
XV
(k
m
s
-1)
X _Fig. 3. A summary of Cluster flow and magnetic observations for the interval 22:26–22:36 UT, presented in GSM coordinates. The top
panel shows the Vxcomponent of the flow and the second panel shows the magnetic field-perpendicular component of this flow. The bottom
two panels show the Bxand Bzcomponents of the magnetic field. These data have been used to estimate an “onset” time for the BBF of
22:29 UT, which is indicated on this and other plots by the vertical dashed line.
is likely to be smaller than the extremes indicated on Fig. 1, and certainly not significant enough to affect the conclusions of this study.
3.2 Cluster CIS / FGM observations
As the present paper is primarily concerned with ionospheric observations we therefore provide only a summary of the
flow and magnetic data from Cluster. This is presented
in Fig. 3 for the interval 22:26–22:36 UT. Data are shown for the Cluster 1 spacecraft (black), Cluster 3 (green) and Cluster 4 (magenta) (the CIS instrument on Cluster 2 failed and so data from this spacecraft are not discussed). During the interval the four spacecraft formed an inverted tetrahe-dron with Cluster 1, 2, and 4 in approximately the same
X−Y plane, and Cluster 3 about 2000 km lower in Z. In
the top panel of Fig. 3 GSM X-component velocity data
(VX) reveal a large (∼600 km s−1) earthward flow
signa-ture during the interval 22:28–22:35 UT. The second panel shows the component of this flow which is perpendicular
to the magnetic field (VX⊥). These data reveal
perpendic-ular flows of ∼200 − 400 km s−1, which are enhanced above
the Baumjohann et al. (1989) average convection velocity
(Vc(AE)<100 km s−1 for AE<200 nT) by a few times. It
is this signature, and the accompanying small (∼10 nT)
en-hancement in BZ(bottom panel), which are evidence of field
dipolarisation and the earthward transport of flux and hence, the occurrence of a BBF (Angelopoulos et al., 1992). Naka-mura et al. (2001) report a peak flux transport rate of the
order of 2 mV m−1for BBFs, which is also consistent with
field-perpendicular flows of this magnitude. For our pur-poses, these data have been used to identify the BBF and estimate an “onset” time of 22:29 UT, which is indicated on this and other plots by the vertical dashed line. It should
be noted that the earthward flow seen in VX⊥is still present
when Cluster 1 and 4 re-enter the central plasma sheet at
∼22:33 UT (evidenced by the decrease in (negative) BXback
to near zero (third panel)). The flows persist, albeit some-what less intensely, until ∼22:35 UT, after which time they die away.
3.3 Ground-based and auroral observations
This section looks closely at the ground magnetic, iono-spheric flow, and auroral data during the hour surrounding the identification of the BBF at Cluster. Presented in Fig. 4
NAL Mag Lat: 76.01 N Mag Lon: 112.26 E B J N Mag Lat: 71.28 N Mag Lon: 108.80 E J AN Mag Lat: 70.24 N Mag Lon: 84.30 E 2200221022202230224022502300 UT 22 00221022202230224022502300 UT 22 1022202230224022502300 UT HLL Mag Lat: 64.47 N Mag Lon: 68.69 E K IR Mag Lat: 64.49 N Mag Lon: 103.15 E X -C O M P O N E N T ( n T ) Y -C O M P O N E N T ( n T ) Z -C O M P O N E N T ( n T )
(i) (ii) (iii)
3 0 n T 5 n T
Figure 4
2200 J AN (20 - 200 s)Fig. 4. X- Y - and Z-component magnetometer data from the five stations indicated in Fig. 1, for the interval 22:00–23:00 UT. The vertical
dashed line and grey shaded area are as in Fig. 2, and the scale of the curves is shown on the left-hand side of the figure. The bottom curves show Pi2 filtered data (20–200 s) from the JAN magnetometer, and have a separate scale as indicated. Station identifier codes and their locations are indicated on the right-hand side.
are X- Y - and Z-component magnetometer data from the five stations indicated in Fig. 1, for the interval 22:00–23:00 UT. The vertical dashed line and grey shaded area are as in Fig. 2, and the scale of the curves is shown on the left-hand side
of the figure. The bottom curves show Pi2 filtered data
(20–200 s) from the JAN magnetometer, and have a sepa-rate scale as indicated. Looking first at these filtered data, there is a small amplitude Pi2 pulsation nearly coincident with the flow enhancement seen at Cluster. The Pi2 is most prominent in the X-component (amplitude ∼8 nT), weaker in the Y -component and non-evident in the Z-component. Its “onset” is a few minutes before Cluster observed the BBF proper, although there are small amplitude flows and mag-netic perturbations in the Cluster data (see Fig. 3) which be-gin at ∼22:27 UT, coincident with the Pi2.
Looking at the unfiltered data, the most obvious charac-teristic to note is the small scale of the perturbations ob-served during the BBF interval. The largest disturbance over the hour of interest, seen in the Z-component by NAL, is
∼60 nT, with typical values <30 nT. The JAN
magnetome-ter sees the most prominent signature during the BBF itself, and is also the station closest to the mapped location of the Cluster footprint (Fig. 1). This feature at ∼22:30 UT, which consists of a double peak in the X-component and a single peak in the Y -component, both of amplitude ∼10 nT, is also evident on a much smaller scale in the data from the other four magnetometers. In the Z-component at JAN we also see a ∼30 nT increase over the ∼10 min of the event. HLL (to the west of JAN) also sees a small increase, whereas the
more eastern stations see a decrease. It is worth noting that at
∼23:20 UT a substorm onset is apparent in the magnetometer
and auroral data (not shown). This corroborates our classi-fication of this event as being in a substorm growth phase, and is consistent with the southward turn of the IMF approx-imately 1 h previously.
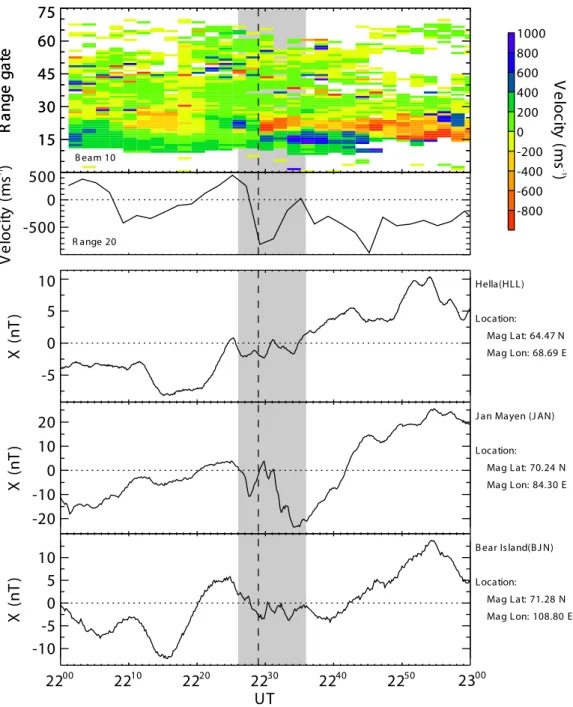
The CUTLASS data is introduced in Fig. 5, which shows velocity measurements from beam 10 of the Iceland East radar (marked as a dashed line in Fig. 1), along with
X-component data from the HLL, JAN, and BJN
magne-tometers. The top panel shows range-time-velocity flow data from beam 10 of the radar for the interval 22:00–23:00 UT. The colour scale is defined on the right-hand side of the fig-ure, with green-blue indicating flows towards the radar (pos-itive velocities) and yellow-red indicating flows away (neg-ative velocities). Before 22:29 UT, the radar sees rel(neg-atively
low velocities of a few ∼100 m s−1(green and yellow).
Af-ter this time, apparently coincident with the “onset” time of the BBF, the flows developed rapidly, reaching velocities
of 500–1000 m s−1. In fact, as suggested above, the BBF
is likely to have commenced some minutes earlier, perhaps not being detected until ∼22:29 UT, owing to the location of the Cluster spacecraft. Such timing issues, however, can-not be resolved with the data available during this interval and would be better addressed during events occurring when the Cluster spacecraft separation was much larger. After the main flow burst, CUTLASS observed further enhancements, or changes in the flow, at ∼22:43 and ∼22:49 UT. These
15
30
45
60
R
a
n
g
e
g
a
te
15
30
45
60
R
a
n
g
e
g
a
te
-800 -600 -400 -200 0 200 400 600 800 1000V
e
lo
cit
y (
m
s
-1)
-500
0
500
V
e
lo
ci
ty
(
m
s
-1)
-20
-10
0
10
20
X
(
n
T
)
J an Mayen (J AN) Location: Mag Lat: 70.24 N Mag Lon: 84.30 E-10
-5
0
5
10
X
(
n
T
)
B ear Island(B J N) Location: Mag Lat: 71.28 N Mag Lon: 108.80 E22
0022
1022
2022
3022
4022
50UT
23
00 Hella(HLL) Location: Mag Lat: 64.47 N Mag Lon: 68.69 E-5
0
5
10
X
(
n
T
)
B eam 10 R ange 20F igure 5
Fig. 5. Range-time-velocity measurements from beam 10 of the Iceland East radar (top panel), a velocity-time profile from range 20 of beam
10 (second panel) and X-component data from the HLL, JAN, and BJN magnetometers (bottom three panels) for the interval 22:00–23:00 UT. The vertical dashed line and grey shaded area are as in Fig. 2.
Cluster flow data (not shown), although as isolated signatures they would not constitute additional BBF activity according to the criteria of Angelopoulos et al. (1992). Finally, note that the flows observed by CUTLASS after 22:29 UT are directed both away from the radar (red) and towards the radar (blue). The boundary between the two indicates a flow reversal and is therefore potentially a proxy for the open-closed field line boundary. This boundary appears to move away from the radar (i.e. with a poleward component) up until ∼22:36 UT, and then begins to return to nearer ranges. This is considered further in Sect. 4.2, below.
The ionospheric velocity variations discussed above are depicted more quantitatively in the second panel of Fig. 5, which shows a velocity-time profile from range 20 of beam
10. This range gate highlights the large (>1000 m s−1)
vari-ations and is located close to the location of the JAN mag-netometer. Comparing the flow data (which has a consider-able east-west component) to the X-component of the HLL, JAN, and BJN magnetometer data (shown in the bottom three panels) suggests some possible correlation between the two throughout the interval.
-8 00 -6 00 -4 00 -2 00 0 20 0 40 0 60 0 80 0 10 00 Velocity (m s ) G ro u n d Sc at te r
-9
3
B JN N A L K IR H LL J A N(a
) 2
2:
24
:0
0
- 2
2:
26
:0
0
U
T
0 10 0 20 0 30 0 40 0 50 0 60 0 70 0 80 0 90 0 10 00 Intensity (Rayleighs)-9
3
B JN N A L K IR H LL J A N 41 k V A PL M o d el 4< B T< 6 B z-/B y-10 00 m s -1 + Z (5 n T) + Y (-73 m in ) -8 00 -6 00 -4 00 -2 00 0 20 0 40 0 60 0 80 0 10 00 Velocity (m G ro u n d Sc at te r-9
3
3
B JN N A L K IR H LL J A N(b
) 2
2:
28
:0
0
- 2
2:
30
:0
0
U
T
0 10 0 20 0 30 0 40 0 50 0 60 0 70 0 80 0 90 0 10 00 Intensity (Rayleighs)-9
3
3
B JN N A L K IR H LL J A N 39 k V A PL M o d el 4< B T< 6 B z-/B y-10 00 m s -1 + Z (5 n T) + Y (-73 m in ) -8 00 -6 00 -4 00 -2 00 0 20 0 40 0 60 0 80 0 10 00 Velocity (m -1 G ro u n d Sc at te r-9
3
3
B JN N A L K IR H LL J A N(c
) 2
2:
32
:0
0
- 2
2:
34
:0
0
U
T
0 10 0 20 0 30 0 40 0 50 0 60 0 70 0 80 0 90 0 10 00 Intensity (Rayleighs)-9
3
3
B JN N A L K IR H LL J A N 49 k V A PL M o d el 4< B T< 6 B z-/B y-10 00 m s -1 + Z (5 n T) + Y (-73 m in )Fi
g
u
re
6
22 :2 4: 12 U T 22 :2 8: 18 U T 22 :3 2: 23 U T Fig . 6a –c. T w o-dim ensio nal map s of th e C UTLA SS Icela nd flo w data (to p p anels ) an d the IMA G E UV auror al data (bott om pane ls), o v er the inte rv al 22:24 –22:46 UT . Al so sho wn on the maps are flo w v ectors and equi poten tial contou rs d eri v ed usi ng the M ap Poten tial model as disc ussed in Se ct. 2, the loc ations of th e fi v e magn etome ters used , and the Cl uster foo tprint loc ation, indica ted by the holl o w black ci rcle. At the bott om of each colum n the transp olar v oltag e, AP L statistic al m odel , v ecto r sc ale and IMF v ec tor for each interv al are sho wn . V el ocity and intens ity co lour sc ales are sho wn on the ri ght-ha nd sid e of th e figu re.-8 00 -6 00 -4 00 -2 00 0 20 0 40 0 60 0 80 0 10 00 G ro u n d Sc at te r
-9
3
15
B JN N A L K IR H LL J A N(d
) 2
2:
36
:0
0
- 2
2:
38
:0
0
U
T
0 10 0 20 0 30 0 40 0 50 0 60 0 70 0 80 0 90 0 10 00-9
3
15
B JN N A L K IR H LL J A N 59 k V A PL M o d el 6< B T< 12 B z-10 00 m s -1 + Z (5 n T) + Y (-73 m in ) -8 00 -6 00 -4 00 -2 00 0 20 0 40 0 60 0 80 0 10 00 G ro u n d Sc at te r-9
3
15
15
B JN N A L K IR H LL J A N(e
) 2
2:
40
:0
0
- 2
2:
42
:0
0
U
T
0 10 0 20 0 30 0 40 0 50 0 60 0 70 0 80 0 90 0 10 00-9
3
15
15
B JN N A L K IR H LL J A N 56 k V A PL M o d el 6< B T< 12 B z-10 00 m s -1 + Z (5 n T) + Y (-73 m in ) -8 00 -6 00 -4 00 -2 00 0 20 0 40 0 60 0 80 0 10 00 G ro u n d Sc at te r-21
-9
3
15
B JN N A L K IR H LL J A N(f
) 2
2:
44
:0
0
- 2
2:
46
:0
0
U
T
0 10 0 20 0 30 0 40 0 50 0 60 0 70 0 80 0 90 0 10 00-21
-9
3
15
B JN N A L K IR H LL J A N 59 k V A PL M o d el 6< B T< 12 B z-10 00 m s -1 + Z (5 n T) + Y (-73 m in )Fi
g
u
re
6
(c
o
n
t.)
22 :3 6: 29 U T 22 :4 4: 40 U T 22 :4 0: 34 U T Fig . 6d–f . C ontinu ed.If the magnetic perturbations are due to overhead Hall cur-rents, then they should correlate with the flow variations
ac-cording to 1X∝6HVW, where 1X is the northward
com-ponent of the magnetic perturbation, VW is the westward
component of the flow, and 6H is the height-integrated
iono-spheric Hall conductivity. If we take values of ∼1000 m s−1
for the flow speed, and magnetic perturbations of ∼10 nT,
then the implied value of 6H is small, of the order of 0.1 S.
This is likely to have contributed to the relatively unperturbed nature of the ionospheric flow pattern, whereas regions of high conductivity (e.g. during the substorm expansion phase onset) can often result in flow diversion and suppression (e.g. Yeoman et al., 2000). It may also explain their being no dropout of ionospheric backscatter observed by CUTLASS, since regions of high conductivity are often associated with precipitation-induced D-region radio absorption (Milan et al., 1996).
To better visualise the flow data, 2-D maps of the CUTLASS Iceland flow data (top panels) and the IMAGE UV auroral data (bottom panels), over the interval 22:24– 22:46 UT are presented in Fig. 6. Each map pair represents a 2-min interval (shown at the top of each column) and ev-ery other 2-min interval is shown (the exact time of each UV image is shown above each panel). Also shown on the maps are flow vectors and equipotential contours derived using the Map Potential model as discussed in Sect. 2, the locations of the five magnetometers used, and the Cluster footprint lo-cation (indicated by the unfilled black circle). At the bot-tom of each column the transpolar voltage, APL statistical model (Ruohoniemi and Greenwald, 1996), vector scale and IMF vector for each interval are shown. The coordinates employed in the maps are Altitude Adjusted Corrected Geo-magnetic (AACGM) latitude and Geo-magnetic local time (MLT), based on the PACE coordinate system discussed by Baker and Wing (1989), with midnight at the bottom of each panel. In Fig. 6a (22:24–22:26 UT), immediately before the on-set of the BBF, we see a moderate convection pattern with a transpolar voltage of 41 kV (compared to 57 kV in the sta-tistical model of Ruohoniemi and Greenwald, 1996). This is fairly typical of the interval up until this point after the IMF turned southward at ∼22:16 UT (lagged time). Some localised enhancement to the flow towards the radar is evi-dent in the vicinity of the JAN magnetometer just poleward of a slight enhancement in auroral emissions. Figure 6b (22:28–22:30 UT) shows the situation at the time of BBF “onset”. In the flow data a noticeable change has occurred
with fast (∼1000 m s−1) flows away from the radar now
ap-parent just pre-midnight. This appears to have had the effect of “drawing” the nightside tip of the dusk convection cell to-wards dawn. There is a negligible change to the transpolar voltage, implying that the flow enhancements observed are a localised reconfiguration and not an increase in the flux throughput of the system. In the optical data, just equator-ward of these fast flows is an enhanced “blob” of auroral emission peaking at an intensity of ∼1 kR. In Fig. 6c (22:32– 22:34 UT) the pre-midnight flows have developed further into an “S” shape with the aurora located in the velocity
shear from east to west flows (and hence, corresponding to upward field-aligned current). The transpolar voltage has also become noticeably enhanced to 49 kV, and the “blob” of aurora has also grown in size, expanding towards dusk. In Fig. 6d (22:36–22:38 UT) the flows remain much the same. The transpolar voltage has increased further still to 59 kV, while the auroral enhancements have decreased somewhat, peaking now at a modest ∼700 R. Figures 6e–f show these enhanced flows and moderate aurora to persist and remain at a relatively constant level over the following 10 min. The en-hanced flows then continue for the ∼30-min remainder of the substorm growth phase, before onset at ∼23:20 UT as men-tioned above.
It is worth commenting on the sensitivity of the “Map Potential” transpolar voltage estimates (discussed above) to the statistical flow model employed (mentioned previously in Sect. 2). For this interval, the ratio of the number of actual data points to the number of statistical data points used in the model is approximately constant, with ∼400±40 actual data points, and ∼540 statistical data points. This consistency im-plies that variations in the voltage estimates over the interval will not be caused by variations in the influence of the sta-tistical model. It is possible, however, that changes in the voltage may occur due to changes in which statistical model is being used at any one time. In this case, a quantitative anal-ysis of the Map Potential results (discussed in more detail in Sect. 4.2, below) shows that whilst the statistical model does have some influence over the outcome, it does not dominate the result over the data.
4 Discussion
The importance of bursty bulk flows as a mechanism for the earthward transport of flux from the tail is now relatively well accepted. Early studies, such as that of Eastman et al. (1985), suggested that the plasma sheet boundary layer (PSBL) is the primary mass transport region. In that case, the flows have a large field-aligned component and are therefore not generally associated with convective transport. Baumjohann et al. (1990) showed that the occurrence rate of high-speed flows in the PSBL is only about twice that of the central plasma sheet (CPS). Taking into account that the ion density in the CPS is about three times greater than in the PSBL, they suggested that the CPS may in fact be the primary region for high-speed mass transport. Here, or more specifically, in the inner central plasma sheet (ICPS) the flows have a large field-perpendicular component and therefore represent cross-field transport. Angelopoulos et al. (1992) studied these ICPS flows in detail and found that the high-speed bursts are em-bedded in longer, 10-min time scale enhanced velocity struc-tures. It is these structures which they termed “bursty bulk flows” to indicate that, in contrast to boundary layer flows, they represent a bulk and usually convective flow of a single population.
The present study has provided simultaneous magneto-spheric and ionomagneto-spheric observations of a BBF-type event
tigation of associated flow and magnetic signatures in the ionosphere. The transient enhancement to the flow seen in the midnight sector by the CUTLASS Iceland radar is con-sistent with the notion of a BBF being a burst of convective transport in the tail. As mentioned above, Yeoman and L¨uhr (1997), Yeoman et al. (1998), and Wild and Yeoman (2000) have previously reported similar observations of transient flow features seen by CUTLASS, which they also suggested may be associated with BBF activity in the tail. These
fea-tures had radar line-of-sight velocities of ∼500–1000 m s−1
and spatial extents of a few ∼100 km, comparative to the event studied here. However, in these cases a significant azimuthal propagation was also observed, in some cases as
large as 6 km s−1, which was not detected in the present
study. A possible explanation for this discrepancy is that these earlier observations were made during substorm expan-sions and at local times displaced from midnight. Some onset theories (such as that of Shiokawa et al. (1997)) require the breaking and azimuthal redirection of the earthward plasma sheet flow, a phenomenon which has been reported by Yeo-man et al. (1998) and Nakamura et al. (1999). Although there is no direct evidence of this in the present study, uncertainties in mapping ionospheric observations into the tail complicate the identification of conjugate signatures. A small area in the ionosphere maps to a large region of tail, such that the main region of flow excitation in the CUTLASS field-of-view may well map to a location considerably earthward of the Cluster spacecraft. Future work will endeavour to integrate these dif-ferent observations into a simple conceptual framework us-ing more multi-instrument observations over more local time sectors and throughout the substorm cycle.
4.1 Field-aligned current analysis
It was mentioned previously that the observations of Yeoman and L¨uhr (1997) and Wild and Yeoman (2000) were inter-preted as the signatures of ionospheric Hall current vortices associated with field-aligned currents (FAC). In an attempt to visualise the pattern of FAC during this event, the curl of the velocity field (derived from the electric potential) has been determined for the interval of maximum auroral disturbance at 22:32 UT, using the technique described by McWilliams et al. (2001). This is shown alongside the corresponding auroral map in Fig. 7, with positive vorticities (red/yellow) indicating upward field-aligned current, and negative vortic-ities (blue) downward field-aligned current. As expected, the region of high intensity emission in the pre-midnight auro-ral zone corresponds to an upward field-aligned current as-sociated with downward precipitating electrons. Poleward of this and slightly later in magnetic local time is a region of downward field-aligned current. These two regions must presumably be connected via ionospheric Pedersen currents, forming a current system not dissimilar to a typical substorm current wedge. However, the apparently low Hall conductivi-ties involved (evidenced by the small magnetic perturbations
in conjunction with this Pedersen current (Cowley, 2000), hence, also explaining the lack of a typical substorm elec-trojet signature in the magnetometer data. In this case, the Pedersen current must therefore also be relatively small in comparison to that observed in a typical substorm electrojet. Using the results presented in Fig. 7, it is possible to make a rough determination of the total amount of current flow-ing in this BBF current “wedgelet”. The results imply that during the interval of maximum auroral disturbance, there is
an upward field-aligned current density of ∼0.1 µA m−2S−1
flowing over a relatively limited region of ∼3×10⁵km2.
As-suming a non-substorm Pedersen conductivity of just a few S puts an upper limit on the amount of FAC of ∼0.1 MA. A study by Akasofu and Kamide (1976) found that, for an
auroral oval at 22◦co-latitude (as is approximately the case
in the present study) under conditions of IMF Bz<−3 nT,
the total current in the substorm electrojet is of the order of 1 MA, a factor of 10 greater than that suggested for the BBF. A likely explanation for this difference may lie in the size of the auroral disturbance, usually observed to be much larger during substorms, such that similar current densities will in-volve much larger currents overall. Also, as discussed above, the large Hall conductivities associated with substorms con-tribute a significant Hall component to the current in the elec-trojet and thus, may play a part in enhancing the current. Ei-ther way, this result implies that a “lone” BBF amounts to only a fraction of a substorm, with some further conditions being required to initiate a fully fledged expansion phase.
4.2 Evidence for reconnection
If, although not necessarily associated with fully developed substorms, BBFs do result from intervals of tail reconnec-tion, then there should be measurable evidence of it. It was noted with reference to Fig. 5 above, that a flow reversal boundary in the CUTLASS data moves poleward during the BBF and equatorward after it. If the flow reversal boundary is representative of the open-closed field line boundary, then this would suggest that the BBF was accompanied by an in-terval of flux closure and hence, tail reconnection. This idea is corroborated by an analysis of the transpolar voltage be-low. The fact that the BBF takes place during a substorm growth phase also then explains the apparent return to an equatorward motion of the boundary after the event, which is the expected motion during intervals of dayside loading. Data from the CUTLASS Finland radar (not shown) were in-spected for further evidence of growth phase behaviour. With more meridionally pointing beams than the Iceland radar, it is more suitable for investigating the equatorward motion of auroral zone scatter associated with an expanding polar cap (Lewis et al., 1997). There is some evidence of equatorward motion in the data between the time of the BBF and the on-set of the substorm (∼22:30–23:20 UT), consistent with what was inferred from the Iceland data. However, there is nothing
-9
3
3
B J N NAL K IR HLL J AN 0 100 200 300 400 005 600 700 800 900 Intensity (R ayleighs)22:32:00 - 22:34:00 UT
F igure 7
-9
3
3
B J N NAL K IR HLL J AN -0 .0 8 -0 .0 6 -0 .0 4 -0 .0 2 0 .0 0 0 .0 2 0 .0 4 0 .0 6 0 .0 8 V orticity (10-6 A m-2 S-1 )07 S ep 2001
49 kV AP L Model 4<B T <6 B z-/B y-1000 ms-1 +Z (5 nT ) +Y (-73 min)Fig. 7. IMAGE UV auroral data for the interval 22:32–22:34 UT in the same format as the maps in Fig. 6 (left-hand panel), and patterns
of field-aligned currents for the same interval (right-hand panel). The field-aligned current has been estimated using the curl of the velocity field (derived from the electric potential), with positive vorticities indicating upward field-aligned current, and negative vorticities downward field-aligned current. Intensity and vorticity colour scales are indicated at the bottom of the figure.
conclusive in the scatter during the BBF concerning the na-ture of any boundary motion.
The main evidence for reconnection then is the enhance-ment in the transpolar voltage which occurs at the time of the BBF onset. Before the BBF, as noted above, we see voltage values slightly lower than the steady-state statistical values of Ruohoniemi and Greenwald (1996). The ∼20 kV increase observed at the time of the BBF then implies an increase in flux throughput as a result of reconnection enhancements in the tail. It is relevant to note, however, that the BBF also co-incides with a reorientation of the IMF to a more southward direction. This might itself explain the change in voltage, if it resulted in an increase in the reconnection rate at the dayside. Further investigation of the flow data, however, reveals that the enhancement is likely to have been due to a combination of both. Performing the Map Potential analysis with the data from the CUTLASS radars (in which the enhanced night-side flows were observed) omitted results in only a ∼10 kV enhancement to the transpolar voltage, likely due to the in-crease in the southward component of the IMF, as suggested above. Performing the analysis with all the radar data in-cluded, but with the IMF fixed at the initial southward level, also results in a ∼10 kV increase in the voltage. This sug-gests that both enhanced dayside driving and tail reconnec-tion are contributing to the overall voltage increase observed. When compared to typical expansion phase associated volt-age increases, Grocott et al. (2002), for example, reported about 40 kV. This result corroborates the above suggestion that whilst similar to a substorm, a BBF is a significantly smaller scale phenomenon.
4.3 Relationship to the substorm cycle
It was mentioned above that BBFs are often classified in terms of substorm and non-substorm events, although there remains some ambiguity as to what exactly this distinction implies. As suggested by Amm and Kauristie (2002), BBFs which occur during substorm expansive phases can differ greatly in their phenomenology from non-substorm events (compare, for example, the present study with the studies of Yeoman and L¨uhr (1997), Yeoman et al. (1998), and Wild and Yeoman (2000), discussed above). However, they use the term “non-substorm” to classify all events which do not occur during a substorm expansion, irrespective of the back-ground conditions, although they stress that this is a tentative definition. This categorisation makes no distinction between so-called “quiet” intervals, where, for example, there is no evidence of the substorm cycle, and intervals of magneto-spheric loading such as substorm growth phases. As sug-gested recently by Grocott et al. (2003) there also exist
sup-posedly “quiet” intervals of positive IMF Bz during which
fast flows are observed in the nightside ionosphere which are apparently related to reconnection in the tail and modest loading from the dayside, yet are not accompanied by any injection or auroral signatures. Therefore, these bursts also differ phenomenologically to the BBF event discussed in this paper which occurred during a substorm growth phase. Nev-ertheless, at a fundamental level they must be manifestations of the same physical processes: reconnection, the closing of open flux and the convective transport of that flux earthward, away from the reconnection region.
On 7 September 2001 the Cluster spacecraft observed evi-dence of a bursty bulk flow in the near-Earth central plasma
sheet at a distance of ∼20 REdowntail. Upstream
interplan-etary magnetic field data from the ACE spacecraft showed this to be an interval of southward field, consistent with one
of active convection in the magnetosphere. This is
con-firmed by CUTLASS radar observations of plasma
convec-tion in the nightside ionosphere, in which ∼1000 m s−1flow
perturbations are seen in conjunction with the BBF. Optical measurements show enhanced auroral emissions from the re-gion magnetically conjugate to the BBF, indicative of elec-tron precipitation, yet ground magnetic records show only very small amplitude perturbations, implying very low levels of ionospheric Hall conductivity. An analysis of the pattern of field-aligned currents implied by the flow data indicates a substorm current wedge-type system. This ipoints to the occurrence of localised field dipolarisation and current dis-ruption in the tail, but on a scale not sufficient to involve a large-scale substorm expansion. Nevertheless, this event does appear to involve tail reconnection and flux closure, as evidenced in the auroral and flow data. Clearly, the simplistic concept of substorm cycle vs. quiet times is not sufficient to fully explain the variety of mechanisms by which the mag-netotail responds to varying levels of dayside loading. In-vestigation of similarly well observed events under differing conditions will hopefully provide further enlightenment on this ever evolving field of research.
Acknowledgements. We would like to thank the PIs of the
Super-DARN radars for provision of the radar data employed in this study. The data employed were from radars funded by the research funding agencies of Canada, France, the UK, and USA. We would also like to thank Mike Ruohoniemi of the Johns Hopkins University Ap-plied Physics Laboratory for provision of the “Map-Potential” al-gorithm software. For the ground magnetometer data, we thank the Finnish Meteorological Institute and its co-institutes who maintain the IMAGE magnetometer array, Børre Holmeslet of the Tromsø Auroral Observatory for providing the Jan Mayen magnetometer data, and Ian Mann and David Milling for the SAMNET data. SAMNET is a PPARC National Facility deployed and operated by the University of York. For provision of ACE magnetometer data we thank Norman Ness and Charles Smith of the Bartol Research Institute. We would also like to thank Kathryn McWilliams for the FAC software. AG was supported during this study by PPARC grant PPA/G/O/2001/00014, and SWHC by PPARC Senior Fellowship PPA/N/S/2000/00197. SuperDARN operations at the University of Leicester are supported by PPARC grant PPA/R/R/1997/00256. The IMAGE-FUV work was supported through SwRI subcontract 83820 at the University of California at Berkeley and by NASA un-der contract NAS5-96020.
Topical Editor T. Pulkkinen thanks two referees for their help in evaluating this paper.
Akasofu, S.-I., and Kamide, Y.: Substorm Energy, Planet. Space Sci., 24, 223–227, 1976.
Amm, O. and Kauristie, K.: Ionospheric signatures of bursty bulk flows, Surveys in Geophys., 23, 1–32, 2002.
Angelopoulos, V., Baumjohann, W., Kennel, C. F., Coroniti, F. V., Kivelson, M. G., Pellat, R., Walker, R. J., L¨uhr, H., and Paschmann, G.: Bursty bulk flows in the central plasma sheet, J. Geophys. Res., 97, 4027–4039, 1992.
Balogh, A., Carr, C. M., Acu˜na, M.-H., Dunlop, M. W., Beek, T. J., Brown, P., Fornacon, H., Georgescu, E., Glassmeier, K.-H., Harris, J. P., Musmann, G., Oddy, T. M., and Schwingen-schuh, K.: The Cluster magnetic field investigation: Overview of in-flight performance and initial results, Ann. Geophysicae, 19, 1207–1217, 2001.
Baker, K. B. and Wing, S.: A new magnetic coordinate system for conjugate studies at high latitudes, J. Geophys. Res., 94, 9139– 9143, 1989.
Baker, D. N., Pulkkinen, T. I., Angelopoulos, V., Baumjohann, W., and McPherron, R. L.: Neutral line model of substorms: Past results and present view, J. Geophys. Res., 101, 12 975–13 010, 1996.
Baumjohann, W., Paschmann, G., and Cattell, C. A.: Average plasma properties in the central plasma sheet, J. Geophys. Res., 94, 6597–6606, 1989.
Baumjohann, W., Paschmann, G., and L¨uhr, H.: Characteristics of high-speed flows in the plasma sheet, J. Geophys. Res., 95, 3801–3809, 1990.
Cowley, S. W. H.: Magnetosphere-ionosphere interactions: A tuto-rial review, in: Magnetospheric Current Systems, 91–106, edited by Ohtani, S., Fujii, R., Hesse, M., and Lysak, R. L., AGU, Wash-ington D. C., 2000.
de la Beaujardi`ere, O., Lyons, L. R., Ruohoniemi, J. M., Friis-Christensen, E., Danielsen, C., Rich, F. J., and Newell, P. T.: Quiet-time intensifications along the poleward boundary near midnight, J. Geophys. Res., 99, 287–298, 1994.
Eastman, T. E., Frank, L. A., and Huang, C. Y.: The boundary layers as the primary transport regions of the Earth’s magnetotail, J. Geophys. Res., 90, 9541–9560, 1985.
Elphic, R. C., Lockwood, M., Cowley, S. W. H., and Sandholt, P. E.: Flux transfer events at the magnetopause and in the ionosphere, Geophys. Res. Lett., 17, 2241–2244, 1990.
Greenwald, R. A., Baker, K. B., Dudeney, J. R., Pinnock, M., Jones, T. B., Thomas, E. C., Villain, J.-P., Cerisier, J.-C., Senior, C., Hanuise, C., Hunsucker, R. D., Sofko, G., Koehler, J., Nielsen, E., Pellinen, R., Walker, A. D. M., Sato, N., and Yamagishi, H.: DARN/SuperDARN: A global view of the dynamics of high-latitude convection, Space Sci. Rev., 71, 761–796, 1995. Grocott, A., Cowley, S. W. H., and Davies, J. A.: Comparison of
ionospheric electric currents and plasma convection patterns ob-served during substorms, in: Proc. Fifth Internat. Conf. on Sub-storms, ESA SP-443, ESA, Noordwijk, The Netherlands, 295– 298, 2000.
Grocott, A., Cowley, S. W. H., Sigwarth, J. B., Watermann, J. F., and Yeoman, T. K.: Excitation of twin- vortex flow in the night-side high-latitude ionosphere during an isolated substorm, Ann. Geophysicae, 20, 1577–1601, 2002.
Grocott, A., Cowley, S. W. H., and Sigwarth, J. B.: Ionospheric flows and magnetic disturbance during extended intervals of northward but By-dominated IMF, Ann. Geophysicae, 21, 509– 538, 2003.
Henderson, M. G., Reeves, G. D., and Murphree, J. S.: Are north-south aligned auroral structures an ionospheric manifestation of bursty bulk flows?, Geophys. Res. Lett., 25, 3737–3740, 1998. Hones Jr., E. W.: Transient phenomena in the magnetotail and their
relation to substorms, Space Sci. Rev., 23, 393–410, 1979. Huang, C. S., Sofko, G. J., Koustov, A. V., MacDougall, J. W.,
Greenwald, R. A., Ruohoniemi, J. M., Villain, J. P., Lester, M., Watermann, J., Papitashvili, V. O., and Hughes, W. J.: Long-period magnetospheric-ionospheric perturbations during northward interplanetary magnetic field, J. Geophys. Res., 106, 13 091–13 103, 2001.
Kauristie, K., Sergeev, V. A., Kubyshkina, M., Pulkkinen, T. I., An-gelopoulos, V., Phan, T., Lin, R. P., and Slavin, J. A.: Ionospheric current signatures of transient plasma sheet flows, J. Geophys. Res., 105, 10 677–10 690, 2000.
Khan, H. and Cowley, S. W. H.: Observations of the response time of high latitude ionospheric convection to variations in the in-terplanetary magnetic field using EISCAT and IMP-8 data, Ann. Geophysicae, 17, 1306–1335, 1999.
Lewis, R. V., Freemann, M. P., Roger, A. S., Reeves, G. D., and Milling, D. K.: The electric field response to the growth phase and expansion phase onset of a small isolated substorm, Ann. Geophysicae, 15, 289–299, 1997.
Lockwood, M., Sandholt, P. E., Cowley, S. W. H., and Oguti, T.: Interplanetary field control of dayside auroral activity and the transfer of momentum across the dayside magnetopause, Planet. Space Sci., 37, 1347–1365, 1989.
Lockwood, M., Moen, J., Cowley, S. W. H., Farmer, A. D., Løvhaug, U. P., L¨uhr, H., and Davda, V. N.: Variability of day-side convection and motions of the cusp/cleft aurora, Geophys. Res. Lett., 20, 1011–1014, 1993.
L¨uhr, H., Aylward, A., Bucher, S. C., Pajunpaa, A., Pajunpaa, K., Holmboe, T., and Zalewski, S. M.: Westward moving dynamic substorm features observed with the IMAGE magnetometer net-work and other ground-based instruments, Ann. Geophysicae, 16, 425–440, 1998.
Lui, A. T. Y.: Current disruption in the Earth’s magnetosphere: Ob-servations and models, J. Geophys. Res., 101, 13 067–13 088, 1996.
Lyons, L. R., Nagai, T., Blanchard, G. T., Samson, J. C., Yamamoto, T., Mukai, T., Nishida, A., and Kokubun, S.: Association be-tween Geotail plasma flows and auroral poleward boundary in-tensifications observed by CANOPUS photometers, J. Geophys. Res., 104, 4485–4500, 1999.
McComas, D. J., Bame, S. J., Barker, P., Feldman, W. C., Phillips, J. L., Riley, P., and Griffee, J. W.: Solar Wind Electron Proton Alpha Monitor (SWEPAM) for the Advanced Composition Ex-plorer, Space Sci. Rev., 86, 563, 1998.
McWilliams, K. A., Yeoman, T. K., Sigwarth, J. B., Frank, L. A., and Brittnacher, M.: The dayside ultraviolet aurora and convec-tion responses to a southward turning of the interplanetary mag-netic field, Ann. Geophysicae, 19, 701–721, 2001.
Mende, S. B., Heetderks, H., Frey, H. U., Lampton, M., Geller, S. P., Habraken, S., Renotte, E., Jamar, C., Rochus, P., Spann, J., Fuselier, S. A., Gerard, J.-C., Gladstone, R. , Murphree, S., and Cogger, L.: Far ultraviolet imaging from the IMAGE spacecraft. 1. System design, Space Sci. Rev., 91, 243–270, 2000a. Mende, S. B., Heetderks, H., Frey, H. U., Lampton, M., Geller,
S. P., Abiad, R., Segmund, O. H. W., Tremsin, A. S., Span, J., Dougani, H., Fuselier, S. A., Magoncelli, A. L., Bumala, M. B., Murphree, S., and Trondsen, T.: Far ultraviolet imaging from the IMAGE spacecraft, 2. Wideband FUV imaging , Space Sci. Rev.,
91, 271–285, 2000b.
Milan, S. E., Jones, T. B., Lester, M., Warrington, E. M., and Reeves, G. D.: Substorm correlated absorption on a 3200 km trans-auroral HF propagation path, Ann. Geophysicae, 14, 182– 190, 1996.
Milan, S. E., Lester, M., Cowley, S. W. H., and Brittnacher, M.: Convection and auroral response to a southward turning of the IMF: Polar UVI, CUTLASS, and IMAGE signatures of transient magnetic flux transfer at the magnetopause, J. Geophys. Res., 105, 15 741–15 755, 2000.
Moen, J., Sandholt, P. E., Lockwood, M., Denig, W. F., Løvhaug, U. P., Lybekk, B., Egeland, A., Opsvik, D., and Friis-Christensen, E.: Events of enhanced convection and related dayside auroral activity, J. Geophys. Res., 100, 23 917–23 934, 1995.
Nakamura, R., Haerendel, G., Baumjohann, W., Vaivads, A., Kucharek, H., Klecker, B., Georgescu, E., Birn, J., Kistler, L. M., Mukai, T., Kokubun, S., Eglitis, P., Frank, L. A., Sigwarth, J. B.: Substorm observations in the early morning sector with Equator-S and Geotail, Ann. Geophysicae, 17, 1602–1610, 1999. Nakamura, R., Baumjohann, W., Brittnacher, M., Sergeev, V. A., et
al.: Flow bursts and auroral activations: Onset timing and foot point location, J. Geophys. Res., 106, 10 777–10 789, 2001. Neudegg, D. A., Yeoman, T. K., Cowley, S. W. H., Provan, G., et
al.: A flux transfer event observed at the magnetopause by the Equator-S spacecraft and in the ionosphere by the CUTLASS HF radar, Ann. Geophysicae, 17, 707–711, 1999.
Neudegg, D. A., Cowley, S. W. H., Milan, S. E., Yeoman, T. K., Lester, M., et al.: A survey of magnetopause FTEs and associated flow bursts in the polar ionosphere, Ann. Geophysicae, 18, 416– 435, 2000.
Opgenoorth, H. J. and Pellinen, R. J. : The reaction of the global convection electrojets to the onset and expansion of the sub-storm current wedge, in: Subsub-storms-4, edited by Kokobun, S. and Kamide, Y., Terra Sci. Publ. Co., Tokyo, 663–668, 1998. Pinnock, M., Rodger, A. S., Dudeney, J. R., Baker, K. B.,
Green-wald, R. A., and Greenspan, M.: Observations of an enhanced convection channel in the cusp ionosphere, J. Geophys. Res., 98, 3767–3776, 1993.
Pinnock, M., Rodger, A. S., Dudeney, J. R., Rich, F., and Baker, K. B.: High temporal and spatial observations of the ionospheric cusp, Ann. Geophysicae, 13, 919–925, 1995.
Provan, G., Yeoman, T. K., and Milan, S. E.: CUTLASS Finland radar observations of the ionospheric signatures of flux transfer events and the resulting plasma flows, Ann. Geophysicae, 16, 1411–1422, 1998.
R`eme, H., Aoustin, C., Bosqued, J. M., Dandouras, I., et al.: First multispacecraft ion measurements in and near the Earth’s mag-netosphere with the identical Cluster ion spectrometry (CIS) ex-periment, Ann. Geophysicae, 19, 1303–1354, 2001.
Russell, C. T. and McPherron, R. L.: The magnetotail and sub-storms, Space Sci. Rev., 15, 205–266, 1973.
Ruohoniemi, J. M. and Greenwald, R. A.: Statistical patterns of high-latitude convection obtained from Goose Bay HF radar ob-servations, J. Geophys. Res., 101, 21 743–21 763, 1996. Ruohoniemi, J. M. and Baker, K. B.: Large-scale imaging of
high-latitude convection with Super Dual Auroral Radar Network HF radar observations, J. Geophys. Res., 103, 20 797–20 811, 1998. Sergeev, V. A., Aulamo, O. A., Pellinen, R. J., Vallinkoski, M. K., et al.: Non-substorm transient injection events in the ionosphere and magnetosphere, Planet. Space Sci., 38, 231–239, 1990. Shiokawa, K., Baumjohann, W., and Haerendel, G.: Breaking of
Field Experiment, Space Sci. Rev., 86, 613–622, 1999.
Stone, E. C., Frandsen, A. M., Mewaldt, R. A., Christian, E. R., et al.: The Advanced Composition Explorer, Space Sci. Rev., 86, 1–22, 1998.
Tsyganenko, N. A.: Modeling the Earth’s magnetospheric magnetic field confined within a realistic magnetopause, J. Geophys. Res., 100, 5599–5612, 1995.
Walker, A. D. M., Baker, K. B., Pinnock, M., Dudeney, J. R., and Rash, J. P. S.: Radar observations of magnetospheric activity dur-ing extremely quiet solar wind conditions, J. Geophys. Res., doi: 10.129/2001JA000063, 2002.
Walker, A. D. M., Pinnock, M., Baker, K. B., Dudeney, J. R., and Rash, J. P. S.: Strong flow bursts in the nightside ionosphere dur-ing extremely quiet solar wind conditions, Geophys. Res. Lett., 25, 881–884, 1998.
the nightside ionosphere during magnetospheric substorms, Ann. Geophysicae, 18, 640–652, 2000.
Yeoman, T. K., Milling, D. K., and Orr, D.: Pi2 pulsation polari-sation patterns on the U.K. Sub- auroral Magnetometer Network (SAMNET), Planet Space Sci., 38, 589–602, 1990.
Yeoman, T. K. and L¨uhr, H.: CUTLASS/IMAGE observations of high-latitude convection features during substorms, Ann. Geo-physicae, 15, 692–702, 1997.
Yeoman, T. K., Mukai, T., and Yamamoto, T.: Simultaneous iono-spheric and magnetoiono-spheric observations of azimuthally propa-gating transient features during substorms, Ann. Geophysicae, 16, 754–763, 1998.
Yeoman, T. K., Davies, J. A., Wade, N. M., Provan, G., and Milan, S. E.: Combined CUTLASS, EISCAT and ESR observations of ionospheric plasma flows at the onset of an isolated substorm, Ann. Geophysicae, 18, 1073–1087, 2000.